FONTÃO, Henio [1], LOPES, Eloisa de Moura [2]
FONTÃO, Henio; LOPES, Eloisa de Moura. The Taguchi method to Assertive and Probabilistic decision making in acquisitions in the stock market. Multidisciplinary Core scientific journal of knowledge. 03 year, Ed. 05, vol. 02, pp. 65-82, may 2018. ISSN:2448-0959
SUMMARY
This research focused in the study of the stock market. The goal was to identify significant factors for maximizing stock prices. Using the Taguchi Method (/inferential statistical) to identify the influence of certain factors on the variation of stock prices. The variables studied and their respective levels of control were, among others: the graphical trend Ibovespa (high or low); trading volume (above or below the average); the expectation of profit (optimistic or pessimistic) and the graphical trend of action (high or low). In an observational situation, analyzed the influences of these factors on a dependent variable, i.e., stock price. The population consisted of 63 companies listed on the BOVESPA and the data were collected in secondary sources, via internet: home broker, fundamentus, among other sites. The main results from the significance tests showed the best fit to the maximising of stock prices, being the ideal setting: graphical trend Ibovespa in high; corporate earnings growth; above average trading volume; optimistic profit expectations and graphical trend of high action. In relation to the final considerations, first, confirm the possibility of introduction of Taguchi method, applied, pioneered in this area. In addition, companies have different standards, that is justified by their respective peculiarities such as: different branches of activity and levels of sensitivity to economic cycles. The stock market is cyclical and dynamic and, therefore, an applied research, expanding the framework of factors studied, in companies in the same market segment, can increase the chances of arriving at conclusions more assertive and probabilistic.
Keywords: stock market, changes in stock prices, Taguchi method.
1. Introduction
In the development of the brazilian economy, observed throughout history, the great evolution as normative legislation governing the various guidelines. This procedure led to the need for a development of new governmental practices. The various changes and inclusions of laws that protect investors, minimizing investment risk and even tax incentives were deployed to make this mode more attractive investment (COMISSÃO DE VALORES MOBILIÁRIOS, 2012).
Among the changes that have occurred in the evolution of markets, two were of great importance to the development of the capital market. First, the creation of the new market, which should add value to the company listed on it, because that system serves to monitor the companies, make public all the facts, decisions and results of companies, ensuring total transparency to shareholders in investment analysis ensures the quality of the information. The second change was the creation and implementation of home broker system, which ended the trading session speaker (SILVA, 2012).
The home broker system there is a diversity of tools to aid decision making that can be accessed from anywhere in the world, facilitating negotiations for any person who is registered to a broker and have access to the internet. This new system comes attracting investors who can negotiate with convenience to quickly and safely. This system in a matter of seconds, communicates with the regulatory agency's central (BLANCO).
Making an evaluation of the growth of individual investors, after the year 2000, when it initiated the home broker system; at the end of 2001, there were 6,763 attracted new investors; in 2002, this number increased to 9,928; and in January 2003, have increased the number of new investors 11,030. The President of Bovespa Tay Pinto announced the target of achieving 5 million individuals in the market by the year 2018, which compared to the numbers published by the Bovespa in September 2012, still need a growth of more than 130%, compared to more than 2 million individual investors settled in that period (PINTO, 2008).
With the easy to operate via Home Broker, entrepreneurs saw a business opportunity, in which some new brokers and a wide range of products have been developed and offered for this niche market, including training courses professionals, teaching techniques to operate on the market. With great expectations pointing a growing number of investors (individuals) in the stock market, it becomes more valuable the efforts employed in the present study, complementing existing ones to understand how these investors Act against the various paths to get profits.
This research is justified with the need to deepen the knowledge on the stock market, from the alternative hypothesis that certain events that occur in the macro and microeconomic scenario significantly influence in stock price.
At the time the investor, rationally knows the fundamentals of investment and decides to buy shares in a particular company, it is understood that he has evaluated this company and found that she is being undervalued by the market, and that your price will fit the real value of the company. Because, through this investment strategy can achieve economic benefits, selling the shares at a price above the price paid on the purchase. An investor can still buy an asset in hopes that this keep your market value or that occur little variation in price, however, expecting to receive part of the profits of the company are called dividends, so your return on capital employee based on future payments.
Similarly, this can identify the time to sell a stock when it's overrated or that their dividends not offers a minimum rate of attractiveness on invested capital (Gitman, 2001b).
In this context, the objective of this research was to identify significant factors for maximizing stock prices, using the method Taguchi, such as a tool for decision-making of buys, innovative in this area.
2. Theoretical Foundation
The Brazilian Stock Market: types of analysis
So, as in corporate finance if calculates a company's liquidity, defined as the ability to time, the company has to receive money and pay off his debts, using its assets. In the stock market, liquidity of an action is defined by the ease of turning an action on money, selling this to the market at any time. This factor, important for investors and public companies. Liquidity can make investment more attractive in the short term, because, if the investment becomes unattractive to the investor or this needs the money for other purposes, he will ease out of the investment and receive your money (GITMAN, 2001b).
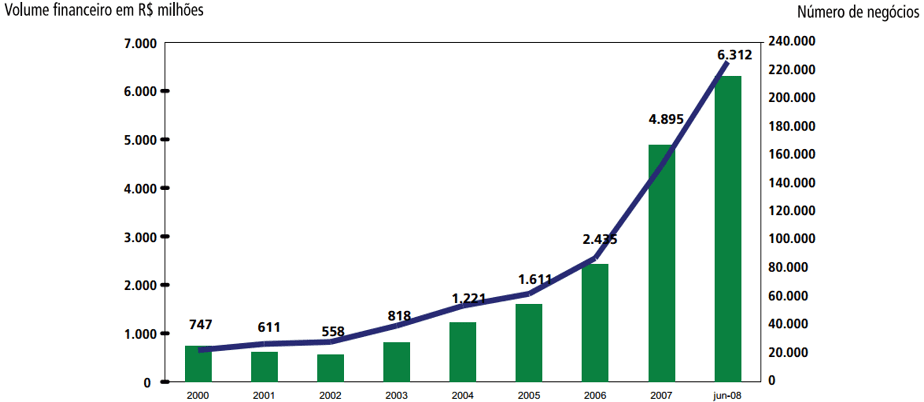
The graph in Figure 1 (2000 period until 2008), shows a major growth regarding the volume of negotiations made on the Bovespa. The volume is the representation of the amount of negotiations made during the period, the volume of currency or number of trades.
In the year 2011, the volume continued to grow, confirming the uptrend, despite the fluctuations during the period. These fluctuations can be evidenced by the statement of Piazza (2009). This author talks about the behavior of investors. Many of them enter the bag at the moment the top history, set by the highest point that the value of an index or action arrived, in relation to all previous periods.
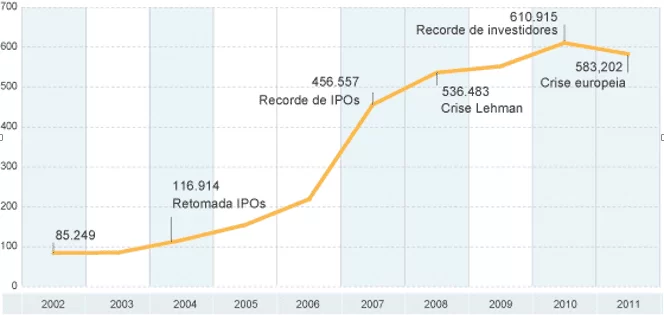
In Figure 2, can be seen the representation of the evolution in the number of investors (individuals) from 2002 to 2011. This period was marked by relevant facts of the time, when, in 2004 there was an improvement in demand from companies for IPO; in 2007 1 record for IPOs (Initial Public Offering) and the year 2008 marked by the bankruptcy of Lehman Brothers Bank. However, it remained the growth record for investors in 2010 and, soon after, the time of the European crisis, however, has already performed around 600% growth since 2002.
Currently, there is a much higher per capita number in the stock market, that individually make decisions about their investments in order to make a profit, which consequently makes the market more "liquid". With greater participation, these investors now collaborate strongly on increased volume of negotiations.
Studies have been developed to understand the "investor's head", how do you explain Mello (2012), which seek to analyze about the common profile among investors. The vast majority of individuals get in the stock market in search of quick gains and large, commonly acting without prior knowledge necessary to face the risks. These people act like they're doing in the gambling market, rising to levels that would not acting rationally. It is considered that most of the volumes traded are volumes of irrational and speculative movements, called movement of the herd.
Faced with the possibility of making investment, it is necessary to analyze the feasibility and the expected return. To do this, examine the financial statements of the companies is crucial.
For Padoveze (2012a), the financial statements are part of the traditional accounting, which became mandatory in Brazil for all joint-stock companies, and extended to the other companies, by creating international standards demonstrations accounting, where a flattening of financial information.
Gitman (2001a), States that the analysis of financial statements can be made in two ways: "Cross-Sectional analysis, involves the comparison of financial indexes of different companies in a single point in time." The author still lists this kind of analysis as a benchmarking, and claims that this kind of analysis has become very popular among investors, which seek to identify deviations from the average of companies in the sector.
On the other hand, "time series analysis evaluates the performance over time". In this kind of analysis is subject to the company's past and compared with your gift, coming to conclusions about the evolution of the company, as well as the identification of symptoms of possible problems in the same (Gitman, 2001a).
Padoveze (2010 p. 50), "the most important point of analysis is the need of the positive balance of the operating cash flow, since your main trainer is the operating profit." To this end, the profit is the one of the factors that investors should consider, because according to the author by the operating profit can verify the effectiveness of the company.
Using a fundamental analysis, the rational, considered from the point of view of the Efficient market hypothesis (EMH), Gitman (2001a) also highlights the importance of analyzing the p/e ratio (price per share/earnings per share) of a firm. According to this author, the P/L is to divide the price of closing of the action, by the annual profit of the company. So, if you can compute how long this company invested capital back to shareholders, considering a constant annual income. And yet, with this index you can get a mensurador result, how much shareholders are willing to pay for each real the company generates profit, reaching the following conclusion, namely, that the P/L increase, to the extent of investor confidence towards the company and if the p/e is down means that investors are with low expectation of return from this company.
However, there are numerous other ways to analyze an action, such as in the case of graphical analysis, which has been widely used by many investors, and that didn't bother to look at the numbers and fundamentalists seek to translate the graphic forms in future probes information behavior of the market. Already, the variable-income model of the stock market awakens the interest of investors, that on the possibilities of profits with the return on investment, the companies Association to obtain part of the profit on revenue. Still, speculation, aiming at the change of stock prices, is otherwise used in the market by investors.
To know which company to invest and what time to invest, it is not possible to count on luck; in the process of decision making can be used various techniques to assist the investor. One of the techniques used to analyze a purchase or sale, the market follows two main paths, i.e. investors opt for fundamental analysis, or opt for technical analysis, and may also find investors who use the two isolated way, but complement (SAINTS. 2012).
The so-called Dow theory, are described three trends. These trends are set according to your direction and time. The primary trend, your time can last for months or even years, drawing a high or low, depending on the direction in which the price is oscillating. The secondary or intermediate, are trends caused by deviations from the price for smaller periods, which can last for weeks or even months. Finally, the tertiary trend is taken by a reflection of small price fluctuations, in a short space of time, taking days or weeks, this latest trend is usually eliminated by the market corrections that come in an opposite direction soon in sequence (KANE; MARCUS; BODIE, 2005).
According to Rocha (2012b), most investors prefer the graphical analysis, because it allows you to make short spaces of time analyses, providing more opportunities than fundamental analysis, analysis of characteristic periods. While the graphical analysis enables you to analyze every minute of trading; on the other hand, through the fundamental analysis, the shortest period permitted in analysis is of a quarter, which are the periods in which companies disclose their balance sheets. Rock (2012b), also explains that the fact that most people use the graphical analysis due to a feature of the Brazilian stock market, that is, encompass a large number of young people.
In addition to these indications, the volume to Lunz (2013), when is great, shows that there is active involvement of investors, as well as an emotional commitment of shareholders. However, if there is a low volume, this may represent a low interest of these elements. But, the author points out that the volume must be taken into consideration for a graphical analysis. The turnover is also one of the main requirements for an action to participate, the composition of the Bovespa index theoretical portfolio. Second Bolsa de Valores de São Paulo (2013), the companies that comprise the index "must submit participation, in terms of volume, in excess of 0.1% of the total."
For Fonseca (2009, p. 123) "the Bovespa index is the most important indicator of the performance of the share price of shares traded in the Brazilian market."
Second Rassier and Hilgert (2012, p. 79), "The stock indices serve as reference (benchmark) to measure particular market." With them one can get a demonstration of changes in market prices, evaluate portfolio performance and uses them as the basis of future market negotiations.
Another hypothesis is that investors calculate the risk-return of a particular stock. In this approach the investor seeks to know what your active interface, and know what the standard deviation to the mean of the market, coming to a beta (ß), which shows the volatility of the paper. In this case the roles that move more than IBOVESPA are riskier than those that move the smallest (fields, WODEWOTZKI and JACOBINI, 2011).
With a different view of the graphical analysis, around 1925 the first studies of fundamental analysis. This method supports the view that the price of assets does not depend on purely speculative market factor. Started, since then, the idea of the analysis of future profits, contradicting the thought at the time that past profits enough to price the assets. Various theories within the fundamental analysis were developed for the intrinsic value of the action. Since then, I've used comparative balance sheets of companies, analyzing their results and making future projections, for then, discover your true growth potential, leaving these principles to price an action, the first fundamental analysis features (TOSTES, 2007).
In both analyses, it is understood that the purpose of the investor is to get hit in the choice of an investment that will bring you profits. Some investors are also the comparison of how the company generates profit on top of your net worth. To Gitman (2001a, p. 142), this kind of analysis is known as ROE (Return On Equity) and, generally, the bigger the better. This author still says that in order to assess the rate of return, one must compare doing a cross-sectional analysis and time series. To calculate the ROE must divide the net income by stockholders ' equity.
Making a temporal analysis of ROE, according to Kane, Marcus and Bodie (2005, p. 207), if the ROE is in decline, one arrives at the conclusion that the new investments that the company has been doing, are offering a smaller return, framing this information as an aspect negative for investors, since it expects a return to expand or at least remain stable.
Analyze the Foundation of companies is very important for investors. Yes, at times that the market makes movements of irrationality, the company's numbers will justify your investment position; enjoying the movements of most investors to counter the movement and identify opportunities (SANTOS, 2012).
3. Methods and techniques of research
Using the Taguchi Method (/inferential statistical) to identify the influence of certain factors on the variation of stock prices. In Figure 3 there is a representation of the methodological structure of the survey.
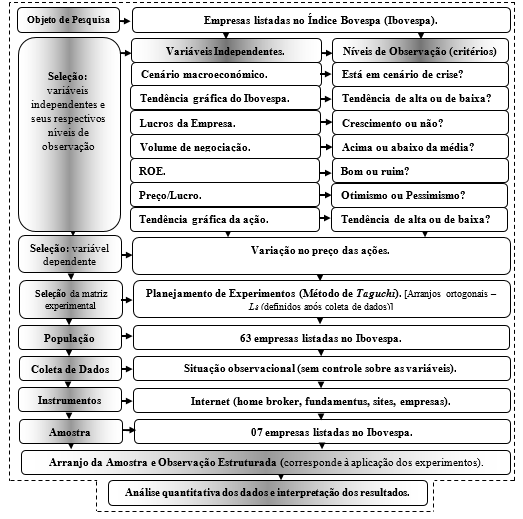
The variables studied and their respective levels of control were, among others: graphical trend Ibovespa (high or low); trading volume (above or below the average); expectation of profit (optimistic or pessimistic) and graphical trend of action (high or low). In an observational situation, that is, without control over the variables were analyzed the inferences of these variables on a dependent variable: stock price. The population consisted of 63 companies listed in the BOVESPA and the data were collected in secondary sources, via internet: home broker, fundamentus and other specialized sites.
3.1. Selection of independent variables and their respective levels of observation
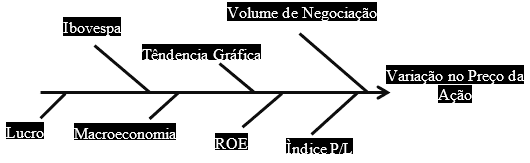
Based on the purpose of the search were delimited the factors studied, referring to the main sources of change in the price of the shares, based on the behavior of investors, in face of the possible elements relevant to decision-making. From the literature search, we selected seven influential factors on the variation of the stock price. Figure 4 shows the independent variables.
The independent variables were introduced intentionally to research, with the purpose to verify the relationships between their variations and the behavior of other variables correspond to that condition described as the goal of the research. In this case, the focus was on generalization of responses, that is, the researchers are interested in broad validation of conclusions found.
This possibility of generalization becomes, by the way, the big advantage of this approach, giving a high degree of credibility to the survey, which is intended to identify which factors, investors in the stock market of Brazil should pay attention to negotiate an action, based on current and historical data.
To influence variables or factors of influence, according to the situation of each factor during the analysis period, these have been classified into observation levels high (level 1) and low (level 2), as shown in the theory of Taguchi (1987).
The Table 1 presents the independent variables, the descriptive criteria adopted for determining the levels of control (note) and the levels of control.
Table 1-independent variables and levels of control (socio-economic).
| Independent Variables. | Descriptive criteria adopted for determining the levels of control of the independent variables. | Levels of control. | ||
| Low (1). | High (2). | |||
| The | Macroeconomic scenario. | Is in time of crisis? | Yes. | No. |
| (B) | Graphic trend Ibovespa. | Uptrend? | Yes. | No. |
| (C) | The company's profit. | Are growing? | Yes. | No. |
| (D) | Volume of business. | Are you above average? | Yes. | No. |
| And | ROI. | Is good? | Yes. | No. |
| (F) | Price/earnings. | P/L offers optimism? | Yes. | No. |
| G | Graphic trend. | Is high? | Yes. | No. |
Source: authors.
The observation levels served to check if the answers are affected by the level change in factors (Barros Neto; Scarmínio; Bruns, 2007). Statistical techniques were used to calculate the effects of factors on averages of answers, the values 1 and 2 are inserted as representatives of the observation levels high and low, respectively.
3.2. Dependent Variable
The dependent variables are those whose behavior you want to verify in the light of the oscillations of the independent variables, i.e. they correspond to what you want as a result. Ross (1991); Barros Neto, Scarmínio and Bruns (2007) the responses represent the dependent variables or output of a system that will be the subject of specific conditions and observations that may or may not be influenced by modifications resulting in the factors.
In this research, the dependent variable (response) is the fluctuation in the price of the action under review. To find the corresponding price variation, all factors must be in their respective levels according to the orthogonal matrix of Taguchi.
3.3. Experimental array: the Taguchi Method (to-Orthogonal Arrangements)
For the composition of the experimental array, selected among the various techniques of experimental planning, Taguchi method, through its orthogonal matrices.
Taguchi orthogonal arrangements, each level of a column combines with the other levels of the other columns, i.e. There are tests in all possible combinations.
According To Barros Neto; Scarmínio; Bruns (2007), these types of studies on Multivariate orthogonal planning maximizes the chances of success of the researchers, especially when compared to traditional methods varied uni. The 2 Framework was established through orthogonal arrangements which, for your time, are represented by matrices fractional factorials carrying an equivalent comparison and adjust the levels of any factor or interaction of factors. These matrices all columns can be evaluated independently. The interaction between factors is the synergistic effect of two or more factors in a factorial experiment, where the effect of one factor depends on another factor (ROSS, 1991).
In practice, the experimental array was selected only after collecting data because the temporal circumstances of this research induce a synthesized research, once, that observation and analysis on all of the selected factors would require a period of time not compatible with available for research.
Table 2 – array of Taguchi L8.
| Comments | Factors and levels | ||||||
| The | (B) | (C) | (D) | And | (F) | G | |
| 01 | 1 | 1 | 1 | 1 | 1 | 1 | 1 |
| 02 | 1 | 1 | 1 | 2 | 2 | 2 | 2 |
| 03 | 1 | 2 | 2 | 1 | 1 | 2 | 2 |
| 04 | 1 | 2 | 2 | 2 | 2 | 1 | 1 |
| 05 | 2 | 1 | 2 | 1 | 2 | 1 | 2 |
| 06 | 2 | 1 | 2 | 2 | 1 | 2 | 1 |
| 07 | 2 | 2 | 1 | 1 | 2 | 2 | 1 |
| 08 | 2 | 2 | 1 | 2 | 1 | 1 | 2 |
Source: adapted from Ross (1991); Montgomery (2009) and Barros Neto, Scarmínio, Bruns (2007).
The Table 2 shows an array of Taguchi L8 which features eight experiments or observations distinct to seven factors, levels of control or observation. Essentially, the experimental array was used as a reference model to find among the data collected a part probabilistic sampling.
3.4. Population and sample
Were used for the observations, only companies which exhibited behaviors from a combination of factors/observation levels that showed similarity to the requirements specified by the orthogonal matrix L8 of Taguchi, illustrated in table 2.
As the statistical techniques, reduced the search universe (population) to a sample, without affecting the final result. The population of this research consisted of 63 companies that make up the Bovespa index in September 2012.
This sample was divided by segments following the diversification criteria recommended and used by brokerages, which resulted in the following sectors: consumption; oil and gas; basic materials; construction and transport; telephony; financial and public utilities.
Each of the sectors received a company to represent him in the search. The choice of each sector was made by the criterion of greater weight in Ibovespa. The company that showed the highest participation in the index, one of the companies in the sector was part of the research, which resulted in the selection of 7 companies.
Not to inflict any ethical standard or harm the companies, the name of these has been preserved, being replaced by codes: E1, E2, E3, E4, E5, E6 and E7 and their respective sectors. These include a sample of 11.11% of the population.
3.5. Data collection
Due to the circumstances of this research, the data collection form that presented itself was the most appropriate observational, which made it possible for the values of the variables were observed, without any of these variables were under the control of the researcher.
The data collection was limited to the period from January 2005 to December 2012, except for cases in which they did time series analysis, where the 2004 period served as a basis for comparison with the following year. In the case of company "E6", data were collected from 2008, from that date the company began operations at Bovespa. Table 1 presents the source and criteria (periods) used for secondary data collection.
Table 1-source and data-collection criteria of the factors.
| Period | Source | ||
| 1 | Statement of results (DRE). | Quarterly. | Fundamentus/Company. |
| 2 | Return On Equity (ROE). | Yearly. | Fundamentus/Company. |
| 3 | Balance Sheet. | Quarterly. | Bovespa/Company. |
| 4 | Trading volume. | Monthly. | Apligraf. |
| 5 | Cyclical economic situation. | Monthly. | Bibliography. |
| 6 | Graphic trend. | Monthly. | Apligraf. |
| 7 | Asset and your price range. | Monthly. | Apligraf. |
Source: Authors.
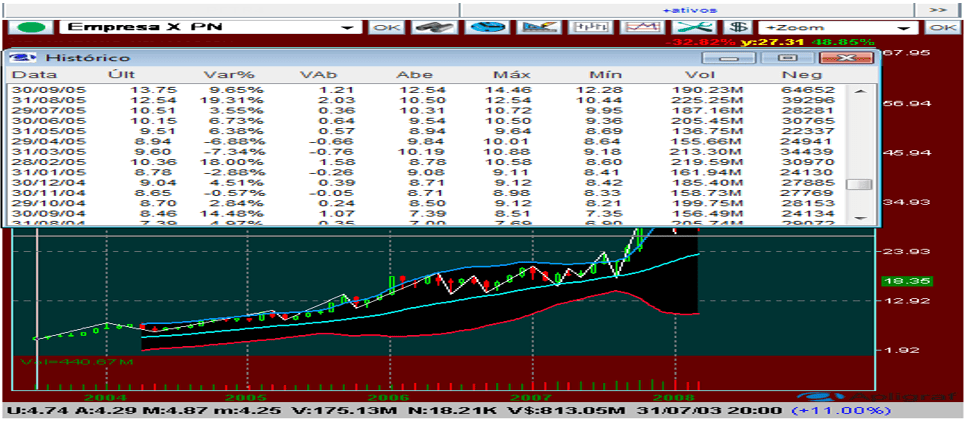
The data, 4, 6 and 7 were synthesized and removed apligraf platform, which provides reliable information, such as other brokerage platforms. Figure 5 shows the graphical platform apligraf and historical data window.
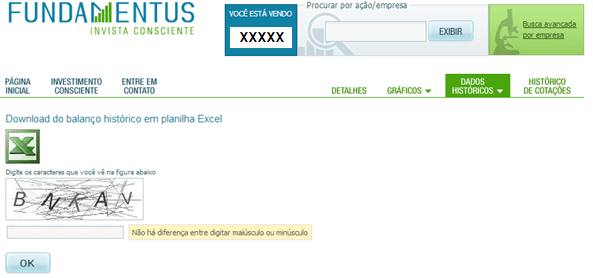
The data 1, 2 and 3 were obtained through the site Fundamentus, Bovespa's website and the company's own site in analysis
Due to the law of Corporation, companies listed on the stock exchange are obliged to disclose their balance sheets. Figure 6 shows the screen of the website page Fundamentus, through which you can download accounting statement of the companies history.
The analysis of the situation of "macroeconomic scenario" analysis was performed based on literature search in order to identify if the period selected for data collection, the factor was in crisis (level 1) or not (level 2).
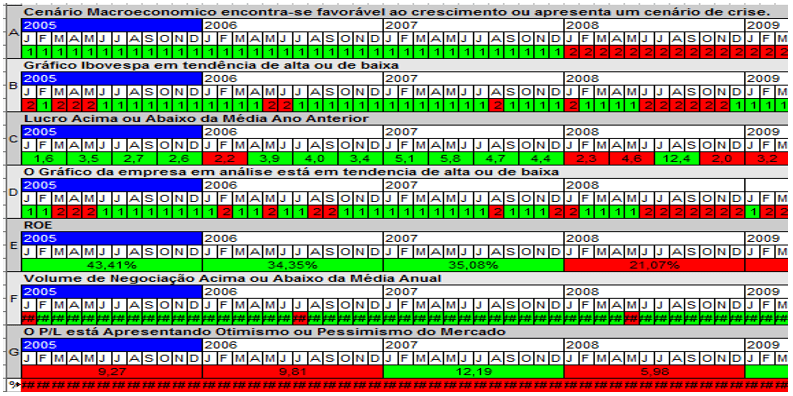
All data and information collected were organized into a table, in order to identify the lines of orthogonal matrix of Taguchi, which correspond to the experiments, in this case, the comments. As shown in Figure 7, for each identified factor the year, month, and the level of this period. In some cases such as ROE, factor was placed the value of this, however, prevails the color of the cell, where the green color represents the level 1 and level 2 red color. In the last line were put the change in the share price, month by month.
4. Results and analysis of the data
The sample data were processed by following the concepts and techniques of Taguchi and the logic of a matrix L8. Therefore, the data were treated quantitatively, through statistical procedures inferenciais.
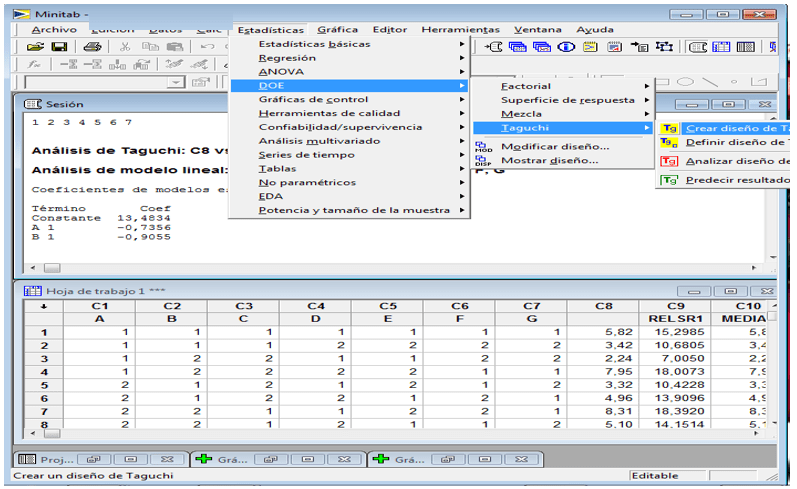
It was used, within the Group of parametric statistical tests, analysis of variance (ANOVA) to observe whether there existed, in the normal distribution of the variables, significant differences between the averages and, also, if the input variables exerted significance on the output variables. The sample data processing was done by means of software MINITAB 15 version, shown in Figure 8.
Second Tahara (2012), if the necessary calculations to arrive at conclusions, statistics were made manually, could make impossible a search, but today we can count on computer resources. Among these features is the Minitab software, which significantly reduces the time of data processing, among many advantages, can provide the answers as well as generate graphs for the analysis of responses.
Another functionality of Minitab is the possibility of performing the ANOVA, which is a statistically formulated decision tool, which takes into account the variation to detect any differences in average performance data series that have some structure. The analysis of variance of a model, starts with the algebraic decomposition of deviations of the observed responses in relation to the global mean response (ROSS, 1991; Barros Neto; Scarmínio; Bruns, 2007).
The responses generated by the Minitab 15, were organized into charts and graphs. The analysis contains: table with the calculation of the effects of factors on response averages, graph the main effects of the factors about the averages of the response and analysis of variance (ANOVA) on the averages of the response.
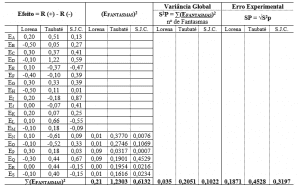
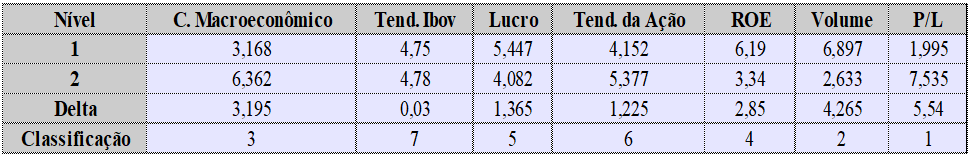
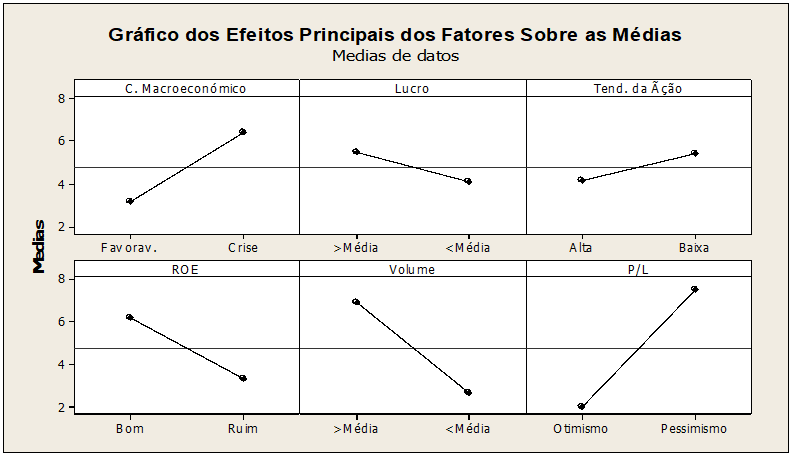
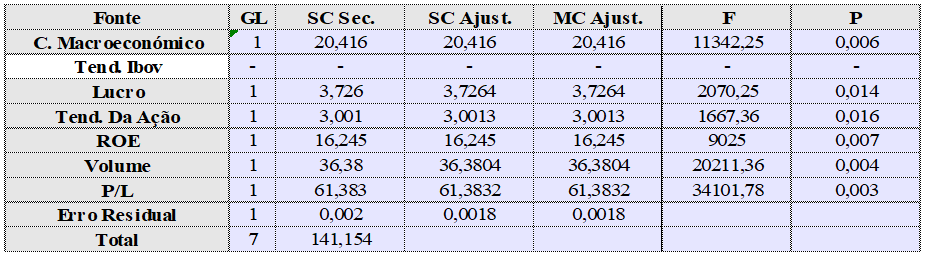
In table 2 are the information of the change (delta) between the level 1 and level 2 of each factor and on the line below, the classification of the factors according to your influence, being the value 1, the factor that had the greatest influence and the value 7 , the less influence among the factors analyzed. As a result, for carrying out the test eliminated by the sort order of the smallest factor influence, to perform the ANOVA, where Minitab 15 generates the graph of influence factors. Graph 1 shows the scale in which the factors influenced according to the preceding table, and in what level each of the 6 factors, had greater significance.
After the chart presents the 3 Table with the result of the observations, by eliminating the smallest factor influence, this is without corresponding values. In this table it can be observed the column "P", that is, the level of significance of each factor, being accepted to the process studied, factors with confidence level between 95% to 100%, so only those who have "P" value less than or equal to 0.05.
Graph 1 shows, the conditions in which occurred the stock price maximization, IE: in times of crisis; when profits were above average; When the graph of the action is in downtrend; When the ROE is good; When there is a high volume and the market is pessimistic. This is the best combination of E1 's response.
In table 3, the "P" values equal to or less than 0.05 represent significant factors for the maximization of the studied response (change in the price of the share). In the case of E1, it is concluded that all the factors are significant, each one in your respective level, according to the chart. This was the only company that showed significance of factors, therefore, the other showed no satisfactory conclusions significance levels, with reliable index equal to or greater than 95% on the results.
For E1, the p/e is influential factor on level 2 with 99.7% confidence, being the most reliable factor for the answer and the less confidence, however, is the tendency of the action, with 98.4%, when there is downtrend.
Statistical procedures used for observation of inferences about the factors E1, also have been applied to the analysis of selected factors on the other companies studied (E2 to E7). In order to synthesize this article, the other answers were deleted text. Already, the Organization of the discussion of the results was established from the evidence in the set of all responses studied (table 4).
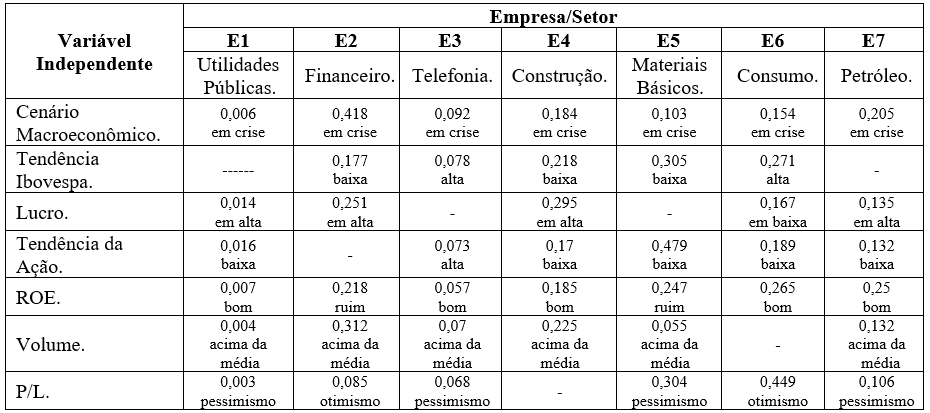
In E2 data analysis, although the factors have influence on the share price, none of them presented a satisfactory level of confidence in the responses. In this case the factor that was more influential, was again the P/L, with 91.5% confidence, being influential in the 1 level, already the least influential was the macroeconomic scenario 58.2% confidence.
For the E3 company the most influential factor became the trading volume, being influential in reply when you are at level 1, above average, but with no satisfactory confidence level of 93% confidence. The closest the response was the ROE with 94.3% confidence 1 level. The other companies follow the same reasoning, finding larger discussions in the next topic of research.
Final Considerations
One of the results of the research there were some factors more influential and some systemic, on the results, being highlighted by stay in evidence among the other factors studied. Here the factors will be examined seeking their purchasing in different companies. The order of the factors for influence.
As Rock (2012c), the p/e ratio is the most widely used in fundamental analysis. In a sort order, among the companies studied, this factor shows up in the results as the most influential factor in price variation.
Although important to the fundamental study, among the factors analyzed, isolated profit had the least influence on the stock price, but the profit when combined with the share price, (P/L) and equity (ROE), he introduced greater influence, indicating that investors are more interested in how this profit generating and what his destiny.
Although only one company have generated responses with satisfactory confidence level for the method, can be considered as reliable average of responses, the volume higher confidence in answers, with 88.60%.
According to the observed in charts and tables of response, the companies had systemic factor in levels 1 and 2. This indicates that there is a sense in the market where the majority shares the same opinion. For all the companies noted that the "Volume", presented at the 1-level influence, that is, to maximize the price, trading volume should be above average. This fact can give that the demand be greater than the offer, reflecting greater interest of investors by purchase of shares, which consequently will cause an increase in the stock price.
Already the factor "Macroeconomic Scenario" presented in all companies, 2-level influence, signaling that a crisis scenario is a systemic factor for maximizing the stock price. For Piazza (2009), many investors out of the stock market at a time when they should enter, can give because the crisis is a negative for the economy and people in General. But this scenario appears as an opportunity, that can give the fact that companies with robust administration come out better in times of crisis.
By a conpecção generic, it can be concluded that due to the global economic crisis of 2008, companies in the public utilities sector (electricity, natural gas and water) became more volatile factors influences (studied in this research) in relation to changes in stock price.
Inferred in this research that among the factors studied, the fundamentalists showed greater influence in the Brazilian market, which denotes strength and less speculative investors. If the securities brokerages expect their customers to obtain operating gains in this market, they provide in a timely manner the correct information about the most influential factors in stock price.
In the stock market should dominate the method that meets the expectations of most investors. It's like all the investors knew that, when there is a crisis scenario, then, has the best time to buy stocks, because the price will increase. However, in these cases, if many investors buy stocks, demand would be greater than the supply, which would lead to an increase in the price, making this true statement, to the extent that people no longer use this information. The methodology of this study proposed a bird's-eye view of the stock market, not belittling any existing theory, and can be placed in future studies, any statement that can be observed at different levels of influence, including put different theories, making interactions between factors and analyze the effectiveness of both in the same study, doing their comparative results.
REFERENCES
BARROS NETO, B.; SCARMÍNIO, I. S.; BRUNS, r. e. How do experiments: research and development in science and industry. Campinas: Universidade Estadual de Campinas, 2007. 480 p.
BLANCO, S. The Purse for women: experience of a stock investment club. 1. Ed. Rio de Janeiro: Publisher Elsevier, 2008. 154 p.
BOLSA DE VALORES DE SÃO PAULO. BOVESPA. Supervisory Board Bsm. What is the Ibovespa. Available in: <http: www.bmfbovespa.com.br/indices/download/ibovespa.pdf="">.</http:> Access in: 21 mar. 2013.
FIELDS, C. R.; WODEWOTZKI, M. L. L.; JACOBINI, r. Mathematical Modeling project: project 1: statistics, the capital market and Social responsibility. In: _ _ _ _ _ _. Education statistics: theory and practice in Mathematical Modeling environments. São Paulo: Authentic, 2011. Cap. 3, p. 65-124. (Collection trends in mathematics education).
SECURITIES AND EXCHANGE COMMISSION. Investor Portal. Available at: <http: www.cvm.gov.br/menu/investidor/portais/investidor.html="">accessed on: 10 October 2012.</http:>
FONSECA, j. w. f. the stock market and the stock market: stock market indices: what are and what are the main indexes. In: FONSECA, José Wladimir Freitas. Capital market. Curitiba: Iesde, 2009. Cap. 6, p. 111-130.
FUNDAMENTUS. Invista Conscious. Available in: < http://www.fundamentus.com.br/=""> </>. Access in: 03 jan. 2013.
GITMAN, L. J. Financial statement analysis. In: Lawrence J. Gitman, Author. Principles of financial management is essential. Translation of Jorge Ritter. Porto Alegre: Editora Bookman, 2001a. Translation of: Principles of Managerial Finance: Brief. p. 128-159.
____________. Risk and return. In: Lawrence J. Gitman, Author. Principles of financial management is essential. Translation of Jorge Ritter. Porto Alegre: Editora Bookman, 2001b. Translation of: Principles of Managerial Finance: Brief. p. 234-361.
KANE, A.; MARCUS, A.; BODIE, Z. In: Alex Kane; Marcus Alan; Zvi Bodie, Authors. Fundamentals of Investments. Translation of Artimed. Porto Alegre: Editora Bookman, 2005. Translation of Essentials of Investments. p. 432-456.
LUNZ, r. a. m. stock technical analysis course. Available in: <http: www.ebah.com.br/content/abaaabmoyad/curso-analise-tecnica-acoes="">.</http:> Access in: 20 mar. 2013.
MELLO, V. R. The head of the investor. 2012 Lecture held at the Expomoney event, held at Transamérica Expo Center, AV. Dr. Mario Villas Boas Rodrigues, São Paulo, on 22 Sept. 2012.
MONTGOMERY, d. c. Introduction to statistical quality control. Rio de Janeiro: LTC, 2009.
MYCAP. Apligraf Home Broker Platform. Available in: <www.mycap.com.br>.</www.mycap.com.br> Access in: 05 jan. 2013.
PADOVEZE, C. L. Managerial Accounting. Porto Alegre: Iesde, 2010. 376 p.
_ _ _ _ _ _, Managerial accounting, introduction to management accounting. In: Managerial Accounting. Curitiba. Publisher IESDE, 2012. p. 11-36.
PIAZZA, m. c., Welcome to the stock market. 8 ed. São Paulo: Editora new concept, 2009, 200 p.
Pinto, and Bovespa revises 5 million goal … investors for 2018. Available at: <http: economia.terra.com.br/noticias/noticia.aspx?idnoticia="201108101329RTR_1312981933nE5E7GK022">, 2008.</http:> Access in: 20 set. 2012.
RASSIER, L. H.; HILGERT, s. p. formation of stock price, Home Broker and Risk: stock indices. In: _ _ _ _ _ _. Learn how to Invest in the stock market. Curitiba: Iesde, 2012. Cap. 4, p. 63-84.
ROCHA, a. tips for Multiple p/e. Available in: <http: www.valor.com.br/valor-investe/o-estrategista/2656952/dicas-sobre-o-multiplo-pl="">.</http:> Access in: May 13, 2012.
_ _ _ _ _ _, By which Individual investors Prefer the graphical analysis? Available at: <http: www.valor.com.br/valor-investe/o-estrategista/2517926/por-que-o-investidor-pessoa-fisica-prefere-analise-grafica="">accessed on 29 Aug.</http:> 2012b.
______. Individual shareholder the Less abandoned. Available in:<http://www.valor.com.br/valor-investe/o-estrategista/2628796/acionista-pessoa-fisica-o-maior-abandonado, André Rocha. www.valor.com.br/valor-investe/o-estrategista/2628796/acionista-pessoa-fisica-o-maior-abandonado,="" andré=""></http://www.valor.com.br/valor-investe/o-estrategista/2628796/acionista-pessoa-fisica-o-maior-abandonado, André Rocha.> Individual shareholder, the largest abandoned > accessed: 10 set. 2012c.
ROSS, p. j. Taguchi techniques Applications in quality engineering: loss function, orthogonal experiment design, design by parameters and tolerances. Translation: Regina Claudia Loverri. Technical review: José Castro Waeny. São Paulo: Makron, McGraw-Hill, 1991. 333 p.
SANTOS, r. l. Guide for investments in the stock market: Learn about some of the main application strategies into actions and choose the ones that suit you. Public magazine, São Paulo, vol. 5, no. 36, p. 5, 2012.
SILVA, a. s. Individual Investor: Who is he anyway? Available at: <http: www.bmfbovespa.com.br/pdf/revistacapitalaberto11.pdf="">accessed on 13 Oct.</http:> 2012.
Taguchi, g. System of experimental design: engineering methods to optimize quality and minimize Costs. White Plains. New York: Kraus International Publications, UNIPUB/1987.
TAHARA, s. design of experiments (DOE). USP-A. Available in: <http: www.portaldeconhecimentos.org.br/index.php/por/content/view/full/9417="">.</http:> Access in: 25 mar. 2012.
TOSTES, f. p. finance and Risk Theory: classical period. In: Fernando P. Tostes. Market risk management: Financial and accounting Methodologies. 1 ed. Rio de Janeiro: Editora FGV, 2007, p. 19-37.
[1] Faculty of Technology of Pindamonhangaba; Centre for research in Economic and Sociology of organizations, Lisbon, Portugal
[2] Faculty of Technology of Pindamonhangaba