FONTAO, Ralph, LEE, Eloisa de Moura [2]
FONTAO, Sydney; LEE, Eloisa de Moura. The importance of intellectual property management for the processes of technological innovation. Multidisciplinary Core scientific journal of knowledge. 03 year, Ed. 05, vol. 02, pp. 5-18, may 2018. ISSN: 0959-2448
Summary
The objective of this research was to examine whether the business performance innovation (with emphasis on open innovation) in enterprises of technological basis-EBT ´ s-is affected by the lack or shortage of intellectual property-IP. The methodological procedures used in this study were experimental, observational, strictly on the basis of inferential statistics, complemented by a field, next to a population of EBT ´ 107 s. The approach was quantitatively and the goals were exploratory. The results emerge for the importance of intellectual property, not only as a way to legally protect innovation, but, above all, as an essential factor for the success of the innovation processes, as a mechanism to facilitate the negotiation of knowledge gained from other external sources.
Keywords: business performance innovation, intellectual property rights, external sources.
1. INTRODUCTION
A few years ago several phenomena come directly affecting the prospects for managing the processes of technological innovation in enterprises. It is already apparent that knowledge is dispersed throughout the world; social and professional networks of relationship are massively impacting on business; small businesses are increasingly if connecting etc. In this context of technological and social transformations, identified by Rothwell (1992), as the fifth generation of innovation, the fundamentals of open innovation.
Open innovation is a model that values collaborative relationships and technological connections, intensifying the markets and external flows of knowledge to add value to internal innovation rates, in these cases, because there are areas that companies have not interest in innovating through internal processes, either by lack of expertise in those specific areas of knowledge or simply because it recognizes that access to external sources is more viable (CHESBROUGH, 2003; TIDD 107 CHINESE FAMILY BUSINESSES and PAVITT, 2008).
These constituencies don't cheapen the importance of intellectual property rights, because in the context of business partnerships and the pursuit of knowledge, (PI) assumes a role to protect and facilitate the technological connections, ensuring legal certainty for access to external sources and technologies for business developed collaboratively
This research focused on the analysis of the business performance of technological innovation as a variable dependent on the risk of missing and/or lack of intellectual property.
For Fontão, Lee and Rao (2013) it is important that the EB ´ s know what combination of levels of risk can lead to maximizing the results of innovation processes. This involves knowing how the company is exposed and your tolerance to PI deficiency, that can be an indispensable condition for the return of the capital invested in research and development in innovation (P&DI).
2. REVIEW OF THE LITERATURE
The characterization of a intellectual property is limited to your affirmative condition under a set of requirements, such as: novelty, utility, tangibility and legality. The most common example and the main source of transactional PI refers to patents, however, trademarks, copyrights and trade secrets are also in your respective carcase (Chesbrough, 2012b).
In the context of open innovation, PI management strengthens the systematization of the processes of access to external sources, because it gives legal certainty and the expectations of commercial buying and selling of marketable skills. After all, when a company trades knowledge with other companies, research institutions, universities etc., expect to get benefits and mitigate the risks and market technicians. However, external connections, bring other types of risks related to the loss of knowledge; loss of control or field; cultural mismatch; lack of commitment; information leakage; insufficient trust etc. The PI management regulates the knowledge and reduces companies ' exposure to the risks of collaboration (CHESBROUGH, 2003, 2012a).
To Chesbrough and Vanhaverbeke (2011), on innovation management, the portfolio of PI is considered an important part of the portfolio of products and services, since it adds economic value, because the internal knowledge and technologies that don't matter to business can and should be negotiated with third parties. Considering the complexity and diversity of the organizations, the knowledge that do not add value to the business of a company, on the other hand, can mean reliable sources of utility and value to P&DI, if coadunadas the technological profile of other companies. For example, in cross-licensing transactions, patents represent the central element.
Companies holding patents may exclude third parties to exercise your patent-protected technology. But, on the other hand, this may make it impossible for these companies to exercise your own technology, in cases where any other company or person holds patents that overlap the protected approach. This fine distinction raises several circumstances that must be controlled as it develops a business model with emphasis on technology, because the cross-licensing may protect or not, the business model (CHESBROUGH, 2012a).
To Chesbrough (2012a), consistent knowledge about patents supports decision making in relation to risks present in the business, at the same time assists in identifying opportunities and technological niches, supporting companies in maintaining their business models or to reconfigure them when necessary. In General, the management of IP can contribute to:
- identification of areas of opportunities that help companies in introduction of products and services that benefit the portfolio of PI;
- get better in relationships as suppliers and consumers;
- trading in secondary markets for innovation and their respective PI ´ 's associates;
- administration of revenue streams derived from innovation;
- the approach phases that conform to the life cycle of the technology in the company.
In this sense, IP management is an effective strategic tool in an open innovation model. By virtue of your imperative role in the negotiation of technology and knowledge, the lack of legal protection of intellectual property rights could derail the flow of open innovation (CHESBROUGH; VANHAVERBEKE, 2011).
Innovation managers must broaden their perspective on the technology assets. Antagonicamente, while stakeholders require optimistic expectations for the return on capital employed; u.s. only, there's a are not being exploited to approximately US $ $1 trillion in assets (Rivette and Kline, 2000).
Second innovation Agency of Unicamp (2007), Brazil gives little importance to property rights, adopting policies aimed at regulating scanty production of knowledge. The evolution of the spread of the use of IP law instruments are punctual in few companies, research institutions and universities and, therefore, insignificant in national terms.
In Brazil, the Government, companies, research institutes and universities have an important role since taking on the challenge of doing collaborative P&DI. In these cases, find a common point between the goals and academic purposes and business expectations set by the market, perhaps the greatest difficulty in collaborative innovation processes. In this view, the PI management combined with knowledge management become essential.
3. SEARCH METHODS
The methodological procedures used were experimental (observational) basis of inferential statistics, complemented by a field, next to a population of 107 enterprises of technological basis. The approach was quantitatively and the goals were exploratory.
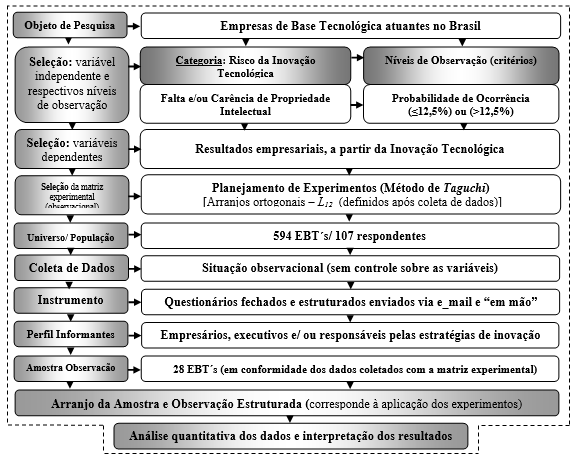
To facilitate the processing of the data from the technique of design of experiments, devised the Figure 1 as representation of methodological research framework:
- choice of search object;
- selection and categorization of input variables and their respective levels of observation;
- selection of the dependent variable;
- selection of experimental (observational) array;
- definition of the universe and population;
- data collection: instruments and profile of informers;
- sampling and structured observation arrangement, according to the experimental array;
- quantitative data analysis and interpretation of results.
This study used multivariate analysis procedures, however, it should be noted that only the variable "lack and/or shortage of intellectual property" was used for the analysis, primarily because of your particular relevance to the business performance innovation.
Technology-based companies (EBT ´ s) were chosen as the object of research, because, by their own nature, have interseccionados interests in technology and innovation, seek for technology and, once inserted in capitalist systems , understand the importance of private and intellectual property.
3.1 independent variable
The independent variable was characterized by a risk factor (lack and/or shortage of intellectual property), categorized as essential to the processes of innovation, especially innovation open.
Authors. such as: Chesbrough, Vanhaverbeke and West (2008) and Chesbrough (2003, 2007, 2012a, 2012b) claim that the absence of intellectual property management is a risk factor for the processes of innovation, especially, to the open innovation model; and can directly affect the performance and desired results with technological innovation and, consequently, reduce the return on capital invested in innovation.
Table 1-likelihood of occurrences for determining the levels of control.
| Level | Description | Indicators | |
| High "2" | Likely | Possibility to occur once per year or a chance to happen above 25% | Potential-occur multiple times in the next 10 years. Occurred in the last 2 years. Typical in such operations because of outside influences. |
| Possible | Possibility of occurring in a period of five years or a chance to happen less than 25% and greater than 12.5%. | Could occur more than once in the next 5 years. Can be difficult to control due to many external influences. There is a history of recent occurrence in the organization. | |
| Below "1" | Moderated | Possibility of occurring in a period of 10 years or a chance to happen above 2% to 12.5%. | Could occur in the next 10 years. There is a history of remote instance in the organization. |
| Remote | Unlikely to occur in a period of ten years or with chance to happen up to 2%. | Never happened in the country. An instance would be amazing. | |
Source: adapted from International Federation of Accountants (1999).
Remarkably, the independent variable was selected from a carcase of eleven variables, used originally in an orthogonal arrangement for other experimental research (observational).
The independent variable were assigned two levels of control, which agreed to find out if the dependent variable is affected by the change between levels. In addition, the levels of control through standardization of random variables (Barros Neto; Scarmínio; Bruns, 2007).
The Table 1 shows the fundamentals of the indicators adopted to secure the levels for observation and, subsequently, to the valuation of the variables.
The logic in determining the levels of control model was adapted from the International Federation of Accountants (1999), which lays down different probabilities of occurrence of risks. In this case, the levels were adjusted in the following configuration:
- "High level (2)": portrayed by indicators "probable" and "Possible".
- "Low level (1)": portrayed by indicators "moderate" and "remote"
3.4 dependent variables
The dependent variables are part of a group formed by eleven factors (table 2), which, for the purposes of this research, determine the performance of enterprises from innovation. The theoretical and conceptual basis on which such provision is justified by (DÁVILA; EPSTEIN; SHELTON, 2006). The dependent variables were evaluated by social subjects, following each of the indicators listed.
The business performance of technological innovation, associated with a lower risk was reproduced through the answers to the questions of quality, evaluated on a scale of one to ten, namely: (1 = Bad); (2 = very bad); (3 = bad); (4 = Bad); (5 = Partly reasonable); (6 = reasonable); (7 = Good); (8 = good); (9 = very good) and (10 = Great).
Table 2-dependent variables (business performance of technological innovation).
| BUSINESS PERFORMANCE OF TECHNOLOGICAL INNOVATION | |
| The response code (Rn) | Dependent variables (description of responses) |
| R1 | Return of Capital Employed in innovation. |
| R2 | Sales growth of new Innovation products. |
| R3 | Innovation Designed that hits the market. |
| R4 | Employee value in research and development (P&D). |
| R5 | Control of gaps in Innovation projects. |
| R6 | Product quality and innovation process. |
| R7 | Culture for innovation. |
| R8 | Customer satisfaction with Products that already exist. |
| R9 | Customer complaints-customer satisfaction survey. |
| R10 | Initiatives dedicated to the Internal product and process Innovation. |
| R11 | Number of registered patents. |
Source: adapted from Dávila, Epstein and Shelton (2006)
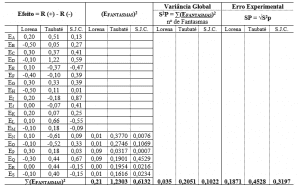
The rationale adopted for assessment of responses observed premise that companies reach better business performance with technological innovation, too, present positive responses (increasing) the dependent variables (responses questionnaire). So, to explain the process maximizing scoped to the study, the data processing system was parameterized with the signal-to-noise ratio: S/N = -10 (setting 1/y2)/n, i.e. "greater value is equal to the best result" (Taguchi, 1987).
3.5 Experimental Array: the Taguchi Method (AO-Orthogonal Arrangements)
Due to limitations of this kind of research, the experimental array, which served for the planned observations, was selected only after all data are properly collected. In this case, chose a orthogonal arrangement, using the Taguchi method.
Table 1 shows the orthogonal matrix of Taguchi L12 which features a total of twelve experiments, called in this survey comments, because there was no control of the researchers about the variables, since these are related to events pré-ocorridos in technology-based companies, which the researchers not interfered in no time or circumstances.
In this research, the isolated risk factor study (lack and/or shortage of Intellectual Property) corresponds to the independent variable represented by the letter "E" in table 1. As already described and justified in sub-item 3.1. exceptionally, the independent variable was selected from a set of 11 variables, used originally in an orthogonal arrangement for other experimental research (observational).
Table 1-Taguchi L12 array used for the planned observations.
| Array of Taguchi L12 | |||||||||||
| Comments | The | (B) | (C) | (D) | And – Lack and/or shortage of Intellectual Property | (F) | G | H | J | K | L |
| 01 | 1 | 1 | 1 | 1 | 1 | 1 | 1 | 1 | 1 | 1 | 1 |
| 02 | 1 | 1 | 1 | 1 | 1 | 2 | 2 | 2 | 2 | 2 | 2 |
| 03 | 1 | 1 | 2 | 2 | 2 | 1 | 1 | 1 | 2 | 2 | 2 |
| 04 | 1 | 2 | 1 | 2 | 2 | 1 | 2 | 2 | 1 | 1 | 2 |
| 05 | 1 | 2 | 2 | 1 | 2 | 2 | 1 | 2 | 1 | 2 | 1 |
| 06 | 1 | 2 | 2 | 2 | 1 | 2 | 2 | 1 | 2 | 1 | 1 |
| 07 | 2 | 1 | 2 | 2 | 1 | 1 | 2 | 2 | 1 | 2 | 1 |
| 08 | 2 | 1 | 2 | 1 | 2 | 2 | 2 | 1 | 1 | 1 | 2 |
| 09 | 2 | 1 | 1 | 2 | 2 | 2 | 1 | 2 | 2 | 1 | 1 |
| 10 | 2 | 2 | 2 | 1 | 1 | 1 | 1 | 2 | 2 | 1 | 2 |
| 11 | 2 | 2 | 1 | 2 | 1 | 2 | 1 | 1 | 1 | 2 | 2 |
| 12 | 2 | 2 | 1 | 1 | 2 | 1 | 2 | 1 | 2 | 2 | 1 |
Source: adapted from Ross (1991); Montgomery (2009) and Barros Neto, Scarmínio, Bruns (2007).
The experimental array was used as a representative model to discover between the data obtained a probabilistic sample.
3.6 Universe and Population
The population of this research involved a total of 107 companies of technological base, and this number was conditioning the total of companies willing to participate as respondents the data collection instruments (questionnaires) one of a search universe comprising 594 companies with similar characteristics.
3.7 Sample
From the data provided by the population of the research was identified, with the help of worksheet data, Excel for Windows 10, an arrangement compatible with the Taguchi L12 matrix specifications (table 1), with eleven independent variables (sampling factors). In practice, were identified between the data collected, a distribution among your variables/observation levels, similar to the specifications of the Taguchi L12 array. This procedure helped find a probabilistic sample based on twenty-eight ´ EBT's (sample of research), represented by their respective social subjects.
To meet the objectives and hypothesis of this research, the only risk factor (lack and/or shortage of intellectual property) was put aside for the analyses.
3.8 data collection
Unlike establishing common sense and to meet the claims of Ribeiro and Caten (2003), design of experiments techniques can be perfectly applied in experimental situations, in which search variables are not directly under the control of the researcher. In such cases and, as it was structured in this research, you can replace the experimental conditions, observational conditions.
In this way, the collection and structuring of data for research, that is, from the collection of the opinion of the representatives (executives and responsible corporate strategies direct) of the companies studied, the data were organized following a logical layout used in experimental treatments, and then observed, considering the statistical inferenciais meanings of these data.
In this sense, were observed the influences and significance of the independent variable (lack and/or shortage of PI) on the dependent variable (business performance of technological innovation).
In practice, the data were collected by means of structured questionnaires, with closed questions. These instruments were shipped and delivered the social subjects, by two different ways: electronically and in person.
3.9 data analysis
The data was based on experimental procedures, inferenciais statistical, quantitative approach, through the MINITAB software version 14. We used analysis of variance (ANOVA) to observe if the input variables have had significance on output variables and, also, if there existed, on homogeneity of data, significant differences between the averages. In this sense, one can confront three or more factors and their interactions, using in a manner complementary to the Taguchi method, to reiterate what are the significant factors in the process (CORREIA; CARDOZA, 2011).
4. RESULTS AND DISCUSSION
4.1 analysis of the effects of the independent variable on the averages of answers (Rn)
The analysis of the effect of the independent variable on the dependent variable used to identify and quantify the influence the risk of missing and/or lack of intellectual property rights over the dependent variables that represent the performance Enterprise technological innovation. Table 2 shows the main effects of the independent variable on the averages of answers (Rn).
The values displayed with the title "Rank" in table 2 correspond to the classification of the influence of the factor studied (risk of lack and/or shortage of intellectual property) on the responses. These values are presented in descending numeric scale and concerning the eleven independent variables of the original sample of intellectual.
These values are presented in descending numeric scale and concerning the eleven independent variables of the original sample (hidden in this survey).
In this sense, from the calculations of the effects and focusing on the values listed in the "Rank" (5th line) of Table 2, one can realize that the independent variable studied presents the following classifications:
- as the first most influential factor about 27.27% of the dependent variables;
- as the second most influential factor about 18.18% of the dependent variables;
- between the ranges: greater than second and less than fourth most influential factor, about 27.27% of the dependent variables.
Table 2-Calculation of the effects of the independent variable on the averages of answers (Rn)
| Level | R1 | R2 | R3 | R4 | R5 | R6 | R7 | R8 | R9 | R10 | R11 |
| Low (-) | 8.333 | 5.513 | 6.917 | 5.890 | 8.667 | 8.750 | 8.680 | 9.222 | 8.792 | 8.487 | 5.263 |
| High (+) | 7.167 | 4.722 | 5.333 | 4.250 | 7.583 | 7.917 | 7.917 | 8.250 | 8.250 | 7.833 | 4.083 |
| Effect | 1.167 | 0.792 | 1.583 | 1.640 | 1.083 | 0.833 | 0.763 | 0.972 | 0.542 | 0.653 | 1.180 |
| Traffic rank | 1 | 6.5 | 1 | 3 | 2 | 2.5 | 2 | 1 | 3.5 | 4 | 4 |
In other words, reiterates that there is between the process variables studied, justifying the deepening in the analyses.
4.2 analysis of variance (VA) on the average of the responses/significance test to identify which responses (Rn) are maximized by the main factor effect
To assess the quality of the fit of the model, from the significance tests, analysis of variance (ANOVA). This procedure made it possible to measure the statistical significance (hypothesis statistical discrepancy in relation to the observed data) the lack and/or shortage of intellectual property) for maximizing business performance, from the innovation. Table 3 shows the ANOVA on the averages of answers (Rn).
Table 3 – analysis of variance (ANOVA) on the average of the responses (Rn).
| Source of Variation | Answers | DF | Seq SS | SS Adj | MS Adj | (F) | P |
| Lack and/or shortage of Intellectual Property | R1 | 1 | 4.0833 | 4.08333 | 4.08333 | 423.88 | 0.002 |
| R2 | 1 | 1.8802 | 1.8802 | 1.8802 | 195.69 | 0.005 | |
| R3 | 1 | 7.5208 | 7.52083 | 7.52083 | 180.50 | 0.005 | |
| R4 | 1 | 8.0688 | 8.0688 | 8.0688 | 38.73 | 0.025 | |
| R5 | 1 | 3.5208 | 3.52083 | 3.52083 | 169.00 | 0.000 | |
| R6 | 1 | 2.0833 | 2.0833 | 2.08333 | 40.00 | 0.000 | |
| R7 | 1 | 1.74803 | 1.74803 | 1.74803 | 3277.56 | 0.000 | |
| R8 | 1 | 2.83241 | 2.83241 | 2.83241 | 59.74 | 0.016 | |
| R9 | 1 | 0.88021 | 0.88021 | 0.88021 | 299.22 | 0.003 | |
| R10 | 1 | 1.2805 | 1.28053 | 1.28053 | 87.11 | 0.011 | |
| R11 | 1 | 4.1772 | 4.17720 | 4.17720 | 84.76 | 0.012 |
Paying attention to the seventh column of the table 3, where the values of P (factor significance level about the answers) showed that the risk of missing and/or lack of intellectual property presented statistical significance for the maximization of all corporate results, after all, the values were less than 0.05, and the statistical confidence level of 95% was. Still, you can highlight it for the answers "R5, R6 and R7" the confidence level was 100%.
4.3 Proposal for the best combination of significant note of the variable levels for the maximization of the answers (Rn)
The independent variable introduced significance on all the studied responses (Rn). The fact that the level of control or of note have remained in level "(1)" for all the answers, means that when there is a probability of occurrence within a range of up to 2% (remote) and/or greater than 2% to 12.5% (moderate) for risk of missing and/or c arência of intellectual property, as a result, the business results are maximized.
From the statistical analysis it was possible to organize the best fit to the process defined in this research, that is, to maximize business performance of technological innovation must keep the risk of missing and/or lack of Intellectual property ("1"). For a didactic perspective, we can say that the more effective for the management of intellectual property, the better will be the results of innovation.
Therefore, there is a acedência of the variable studied, as the unit of observation level, in relation to the total set of responses in which exposed himself as significant, pointing out the decorrências of analysis as an imperative for maximization of the answers.
Otherwise, the results ratified, in conformity with the sample research, constituencies that companies operacionalizam their processes of innovation, keeping the risk of missing and/or lack of PI at levels lower than 12.5%, therefore , maximize your results with innovation.
Table 3 – Relationship between significance factor inferential/levels of input and responses.
| Independent Variable | Dependent Variables (Rn) | Signicância viewing levels on the responses | |
| Low (1) | |||
| Lack and/or shortage of Intellectual Property | R1 | Return of Capital Employed in innovation. | 1 |
| R2 | Sales growth of new Innovation products. | 1 | |
| R3 | Innovation Designed that hits the market. | 1 | |
| R4 | Employee value in External P&D. | 1 | |
| R5 | Control of gaps in Innovation projects. | 1 | |
| R6 | Product quality and innovation process. | 1 | |
| R7 | Culture for innovation. | 1 | |
| R8 | Customer satisfaction with Products that already exist. | 1 | |
| R9 | Customer complaints-customer satisfaction survey. | 1 | |
| R10 | Initiatives dedicated to the Internal product/process Innovation. | 1 | |
| R11 | Number of registered patents. | 1 | |
Due to the breadth and diversity of responses examined, with regard to innovation and, on the other hand, by the predominance of the factor on the completeness of the responses, the PI as a protective role of knowledge and business enabler, regulator, impactanto on system innovation and capillarity in the composition of the results of innovation performance.
The significance of the factor on the foreign P&D (R4), plus evidence of income directly proportional to this result, at the same time shows that the sample enterprises are investing in particular processes of open innovation systems.
The PI should not be managed in your essence, just as a mechanism of protection of exclusivity, as this may be a triggering event of market imperfections. Schumpeter (1982) stated that innovation is critical to the economy out of a State of balance and enter into a process of expansion, Yes, changed considerably the preconditions of market balance.
Levin (1987) warns that a greater level of protection technology can inhibit technical innovation, the economic, social and competitive performance between companies. Yes, the excessive increase of protection can stimulate the repetitive investment which are contrary to competitiveness, which could raise prices, in addition to the appropriate fee for the return of the capital invested and, still, slow down the process of generation and dissemination of technology.
On the model of open innovation, research and development (P&D) joins forces with internal exploration and incorporation of technology and knowledge, strengthening the role of PI as for bilateral regulatory research on connections with universities and other research institutions, suppliers, customers or to mitigate the risks and costs of innovation (CHESBROUGH; VANHAVERBEKE, 2011).
Lichtenthaler (2010) ressalvou that, in the context of open innovation, companies employ, from the portfolio of patents, two strategies for management of intellectual property, namely; the acquisition of foreign technology, related to the absorption of technological knowledge and the exploitation of foreign technology, related to the commercialization of technological knowledge, simultaneously to your internal application.
CONCLUSION
One of the conclusive, perspective the most compelling is that the independent variable studied reiterated the central hypothesis of this research. In this sense, the evidence also proved the correct alignment theory and scientific research variables, because the risk factor (lack and/or shortage of PI) presented the influence and significance of all dependent variables, therefore, affect directly the business performance of technological innovation.
In addition, yet, it can be affirmed that the goal of the research was, once, the methodological procedures allowed the analysis of the business performance of technological innovation as a factor dependent on the intellectual property.
For another perspective, the independent variable proved significant on the dependent variable, from their respective control low levels. This induces the more effective for the management of intellectual property in the EBT ´ s, the better their performances with technological innovation. The scope of open innovation, we can affirm that the PI is an instrument that contributes to the access to technological innovation and dissemination and transfer of technology.
The results reveal that the EBT ´ s must pay attention to the management of IP, particularly, the capitalist companies who are interested in business to maximize their business results and capital gains. For an economic point of view, the results appear to private property; in this research, specifically the PI, with potential to improve business results and produce benefits which go beyond the role of guarantee legally the property of the capitalist, i.e. as an effective mechanism for trading assets are not applied internally by companies.
It appears, from the assertiveness of the search results, founded on inferential statistical analysis that proved the relationship between maximizing the risk of missing and/or lack of PI (in remote and/or moderate level) and the value used in external P&D, which the IP management is an indispensable process for a system of open innovation.
REFERENCES
UNICAMP INNOVATION AGENCY (INOVA). Scenario exercises: trajectory of the NITs-the future of university relations, innovation and society. Campinas: INOVA, May 2007.
BARROS NETO, B.; SCARMÍNIO, I. S.; BRUNS, r. e. How do experiments: research and development in science and industry. Campinas: Universidade Estadual de Campinas, 2007. 480 p.
CHESBROUGH, H. W. The era of open innovation. Mit Sloan Management Review. Cambridge, v. 44, n. 3, p. 35-41, 2003.
___________________. Why Companies Should Have Open Business Models. MIT Sloan Management Review, Cambridge, v. 48, n. 2, p. 22-28, 2007.
CHESBROUGH, H. W.; VANHAVERBEKE, W.; WEST, j. Open Innovation: researching the new paradigm, Oxford: Oxford University Press, 2008.
____________________; _____________________. Open innovation and public policy in Europe. Brussels: Science Business Publishing Ltd. December 2011. Available at: www.sciencebusiness.net. Access in: 06 Aug. 2012.
____________________. Open business models: how to thrive in the new innovation landscape. New York: Bookman, 2012a, 220 p.
____________________. Open innovation: how to create and profit from the technology. New York: Bookman, 2012b, 241 p.
CORREIA, E. A. S.; CARDOZA, j. a. s. design of experiments in the productive process using Taguchi method. GEPROS magazine-production management, operations and systems, Bauru, Year 6, no. 1, p. 55-66, jan-mar 2011.
LEVIN, R. A new look at the patent system. American Economic Review, Year 2, v. 76, p. 787, may 1987.
DAVILA, t., ESPTEIN, m. j. SHELTON, r. innovation that works: how gestionarla, medirla y obtener real benefit of ella. Publisher Deusto, 2006. 324 p.
FONTAO, h. open innovation management: Risk Mitigation in the process of access to innovation. São Paulo: UNINOVE, 2012. 230 p. thesis (doctoral)-master's and doctoral program in business administration (PMDA), University Nove de Julho, São Paulo, 2012.
INTERNATIONAL FEDERATION OF ACCOUNTANTS (IFAC). Enhancing sharehold wealth by better managing business risk. International Management Accounting Study, n. 9, jun. 1999.
LICHTENTHALER, u.s. Intellectual property and open innovation: an empirical analysis. International Journal of Technology Management. Geneva, v. 52, no. 3-4, p. 372-399, 2010.
MONTGOMERY, d. c. Introduction to statistical quality control. Rio de Janeiro: LTC, 2009.
RIBEIRO, J. L.; CATEN, c. design of experiments. Porto Alegre: Universidade Federal do Rio Grande do Sul, school of engineering, the graduate program in production engineering, 2003.
RIVETTE, K.; KLINE, Discovering new value in intellectual property. Harvard Business Review, jan-Feb, 2000.
ROSS, p. j. Taguchi techniques Applications in quality engineering: loss function, orthogonal experiment design, design by parameters and tolerances. Translation: Regina Claudia Loverri. Tevisão technique: José Castro Waeny. São Paulo: Makron, McGraw-Hill, 1991. 333 p.
Rothwell, r. Successful industrial innovation: critical success factors for the 1990 ´ s. R&D Management. n. 22, p. 221-239, 1992.
SCHUMPETER, j. a. Theory of economic development: an inquiry into profits, capital, credit, interest and the business cycle. 3. ed. São Paulo: New Cultural, 1982.
Taguchi, g. System of experimental design: engineering methods to optimize quality and minimize Costs. White Plains. New York: Kraus International Publications, UNIPUB/1987.
TIDD, J.; 107 CHINESE FAMILY BUSINESSES, J.; PAVITT, k. innovation management. Bookman publishing, 2008. 600 p.
[1] Faculty of Technology of Pindamonhangaba; Centre for research in economic and Sociology of organizations, Lisbon, Portugal
[2] Faculty of Technology of Pindamonhangaba