FONTÃO, Henio [1], LOPES, Eloisa de Moura [2]
FONTÃO, Henio; LOPES, Eloisa de Moura. Plackett-Burman Saturated planning for analysis of Opportunities and improvements in Grocery retailers. Multidisciplinary Core scientific journal of knowledge. 03 year, Ed. 05, vol. 02, pp. 111-126, may 2018. ISSN:2448-0959
Summary
The objective of this study to identify opportunities for improvement of supermarket business retailers a municipality situated in the Vale do Paraíba Paulista-Brazil. Lean Six Sigma is proposing to improve quality and speed of the processes, with the aid of advanced statistical tools, such as the design of experiments. Applied the method of exploratory research, through a fractional factorial array Plackett-Burman, which served to direct the application to a research economically leaner. Significance tests were carried out on factors specific to a process studied. It is concluded that the most important factors for a process of opinion from customers on the quality of services provided by local and regional retailers are: age group and place of residence. Finally, we analyzed possible relationships between the information recorded and some improvements promised by the Lean Six Sigma.
Keywords: Lean Six Sigma, Design of Experiments, Plackett-Burman, Grocery retailers.
1. Introduction
It is observed that most of the publications on the concepts of Lean Manufacturing/Enterprise and Six Sigma describe practical applications of these concepts and methodologies in processing companies. However, these concepts can be applied in both contractors, as existing services in serial production. George (2004) claims to be common in manufacturing companies, the fact that about 80% of the price of their respective products are formed by indirect costs. In this sense, the techniques of Lean Six Sigma can result in improvements and minimizing costs and give companies an important competitive advantage.
In a context of globalization of production and high competitiveness, in which the prices of goods and services shall be determined by the market and oligopolies can establish market barriers to entry and/or continuity of small and medium-sized companies, makes it necessary for small and medium-sized supermarkets, local and regional retailers are involved in continuous improvement processes (incremental innovation). In these times, maybe you can be one of the ways to innovate, mitigate costs, remain competitive and stay in increasingly globalized markets.
The concept of Lean Six Sigma emerged with the aim of improving the speed and quality in the business. The method proposes to analyse and predict the variability, improving the quality of products and services, increase speed of processes, minimize costs and direct organizations to business success.
Whereas the literature, although to a lesser number of publications also provide cases of applications of these concepts in various service providers, it is believed, in the sense of business development, relevant research that explore the subject in the branch of the supermarket retailers in the region of Vale do Paraíba Paulista and can serve as a reference for further studies on the subject.
This research aims to investigate the effects and the significance of some factors specific to a process of perception of customers about the quality of the services provided by medium and small supermarkets, retailers in addition to analyze possible relations between this information and proposals for improvements promised by the Lean Six Sigma. For this, applied techniques of design of experiments, which is one of the advanced tools used by Lean Six Sigma.
Were investigated books, scientific articles and specialized web site, in order to structure the history of the topic and scientific methods applied in the research. However, as bibliographical Foundation, among other items, the book “Lean Six Sima for services: how to use Lean speed and Six Sigma Quality to improve services and transactions”, authored by Michael l. George.
2. Goals
This study aims to identify opportunities for improvement of supermarket business retailers in the city of Lorena, situated in Vale do Paraíba.
To assist the direction and design of this study, the specific objectives were:
- Identify the common customer profiles with the Plackett-Burman, N = 20 and investigate how they realize (the opinion of) the quality of services provided by small and medium-sized supermarkets retailers of a city in the Valley of Paraíba.
- Raise the significance of the studied factors and propose the best fit to the process defined in the research.
- Verify that the information gathered can aid in support of some proposed improvements with the deployment of Lean Six Sigma method, which in this study were: control over variabilities, improvement in the quality of services, increase in speed processes and minimizing costs. For that, we sought to identify potential opportunities for improvement, based on the relationship between the information gathered in the survey and the concepts studied.
3. Theoretical Foundation
3.1 Lean Manufacturing/Enterprise
In Europe, between the 16th and 18th centuries, the artisan production no longer answered fully commercial demand. In order to increase production and profits, traders hired craftsmen to working together in one place. This entailed in the separation between the capital and the job and began to arise the first capitalist industrial productions.
Handcrafting used highly qualified professionals and flexible tools to produce custom items according to customers ‘ need, however the high costs. While mass production, around 1760, wore an intense Division of labor, with various professionals with specific skills for a large-scale production of standardized and unique products and low-cost.
For almost two centuries, several production models are applied in organizations. However, around 1949, begins to set a template that later, in the years 70 and in full “oil crisis” and the world economy, manages to keep the Toyota Motor Company with profits greater than those of its competitors-the Toyota Production System (OHNO .1997).
However, in order to try to avoid the high costs of small-scale production and the rigidity of large-scale production, in the late 80 1 generic term for the Toyota Production System-Lean Manufacturing. If the intention was to define a flexible manufacturing system, responsive, innovative and efficient, which uses automated machines and outnumbered to produce high volumes of products in wide varieties. Its focus is the reduction of inventories, training of skilled and versatile employees, work in teams, the prevention of occurrences of failures and losses and the long-term cooperation relationship with suppliers (SHINGO, 1996).
For the purpose of application of the concepts and tools in all levels of the Organization and the need to extend the system to the entire corporation, the term Lean Enterprise.
3.2 quality management
Although only with ISO in 2000 the quality has officially evolved system for management, it was possible to perceive in classical authors publications as Deming and Juran the concern with quality management throughout the company.
To stay competitive, all parts of the companies should adopt a systematic approach to establishing and achieving goals of quality, (JURAN, 1990).
Deming, in the years 1950, (apud Anjard, 1995) developed the PDCA (Plan-Implement-Check (study)-Act). In an evolutionary sense and adaptive to the needs of the market, new acronyms naming systems, tools, models and quality management processes have emerged. According to George (2004), the DMAIC (Define-Measure-Analyze-Improve-Control) or DMEDI-(Define-Measure-Explore-Develop-Implement), are components of a project Six Sigma or Lean Six Sigma.
3.3 Six Sigma
Six Sigma-σ-6 is a system to achieve, sustain and maximize business success and uses understanding of customer needs, application of statistical methods and processes, and focus on business management. In this case, the business success can be translated by the Six Sigma system benefits, such as: cost reduction, productivity improvement, growth of the market share, customer retention, reduced defects, cultural change, development of new products and services as (PANDE, 2001).
The Six Sigma establishes a “closed loop” in order to track changes in the business and keep the Organization on the path of success, through process management, process improvement and process design/Advisory. For that aligns the system by an algebraic model in which Y (represented by the measures of business performance, such as: strategic objective, profit, customer satisfaction) is a function of X (represented by independent variables, such as: process input or variations in technology, cycle time, personal), that is: Y = f (X), (PANDE, 2001).
Table 1 – Simplified Table of conversion in sigma.
Simplified table of Conversion in Sigma |
||
| Yield% | DPMO | Sigma |
| 30.9 | 690,000 | 1.0 |
| 69.2 | 308,000 | 2.0 |
| 93.3 | 66,800 | 3.0 |
| 99.4 | 6,210 | 4.0 |
| 99.98 | 320 | 5.0 |
| 99.9997 | 3.4 | 6.0 |
Source: Adapted from Pande (2001).
Table 1 brings a simplified presentation of conversion in sigma, showing the relative values of defects per million opportunities and fees for production processes, as sigma levels.
The small letter sigma Greek alphabet-σ-represents the standard deviation, which in your time represents the variation, the inconsistency of the process. The six level indicates 99.9997% yield in the business process, i.e. 3.4 defects per million opportunities (DPMO). Is through the use of statistical tools that the Six Sigma system proposes to manage the variability and becomes relevant because it can help to automatically respond to signals from the processes, suppliers, employees and customers, and with this, achieve new levels of power and performance, yet (PANDE, 2001).
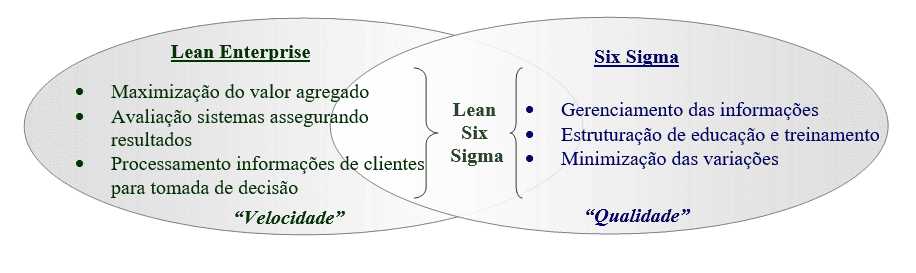
3.4 Lean Six Sigma
Lean Six Sigma is a methodology of continuous improvement of the business that maximizes shareholder value and search with speed and quality the best customer satisfaction rate and the capital invested. Is method which uses the prediction of climate variability, waste disposal and strategic planning on the opportunities. Can combine multiple tools as needed and the business level to meet the Organization, and is “key” to differentiate the specialized support for each project required, as (GEORGE, 2002, 2003).
Lean and Six Sigma interact and reinforce each other. Earnings are much faster if the Lean and Six Sigma are run together, George (2003). You can see the concept Lean Six Sigma not only as a tool to reduce waste and cost, but as a method of maximizing long-term capital investments, with fast and qualitative applications in each project.
According to the authors surveyed, the concepts of Design of Experiments (DOE) are widely applied in organizations by means of statistical tools disseminated in methodologies such as Six Sigma and Lean Six Sigma.
3.5 Planning of experiments – DOE (Design of Experiments)
In a highly competitive scenario, businesses that have effective conditions to choose the best method of continuous improvement may have an edge over your competitors. Statistical control tools can assist in the analysis of multiple variables for the best managerial decision-making and, therefore, in efforts to processes with higher chance of success. The Experimental Planning (DOE) comes across as a smart way of verifying production processes or services, or even broader and complex projects.
The DOE is a tool for optimization of experiments and refinement, used in Lean Six Sigma projects in the “Develop” in DMEDI, or “Improve” in DMAIC. The design of experiments is a methodology in which the input factors are varied to understand your impact on output variables. In a service environment can be prescription, cycle time, client satisfaction, as describes (GEORGE, 2004).
3.6 Planning Plackett and Burman Saturated
The Plackett-Burman model, besides being suitable for exploratory situations, can also be used in economically lean because it allows searches with “n” experiments investigate “n-1” factors and uses factors “ghosts”, which serve to make the estimate of experimental error, Barros Neto; Scarmínio; Bruns, (2003). These projects are useful for, economically, detect main effects, whereas all interactions are negligible when compared with few significant main effects (ENGINEERING STATISTICS HANDBOOK, 2007).
4. Methods and techniques of research
In this research, the exploratory study, which is recommended when there is little knowledge about the problem to be studied, Rampazzo (2001). Basically, the experimental method boils down to submit the study to the influx of certain variables, under controlled conditions by the researcher, to observe the results and for decision-making (BONDUELLE S.A., 2000).
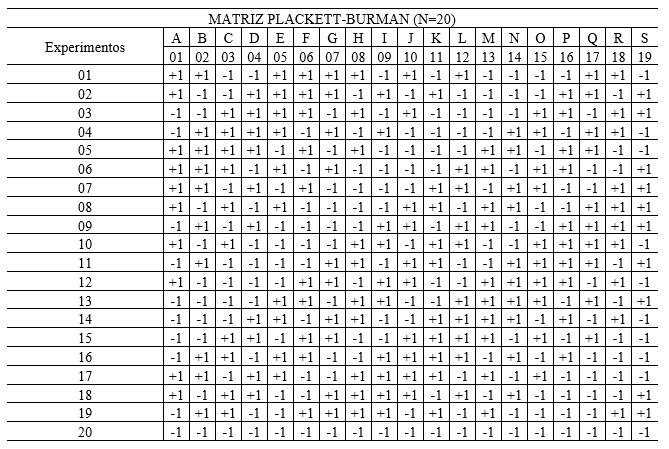
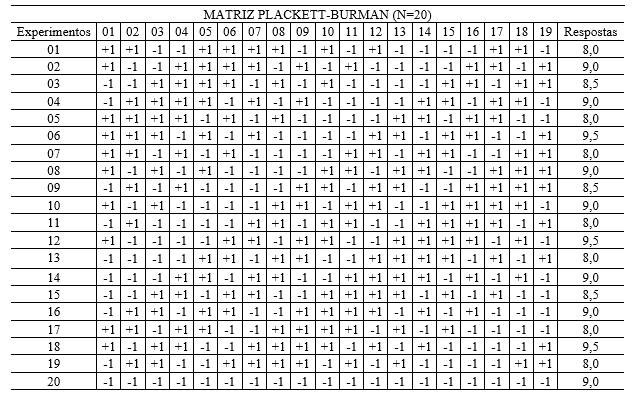
To align the factors investigated and goals to the experimental structure and direct the application of an exploratory research and with low investments, design of experiments techniques-Design of Experiments (DOE) were used- structured through a fractional factorial array Plackett-Burman saturated N = 20 (as Table 02), with a significance level of 5%. The statistical analyses were processed through a worksheet of Excel calculations.
As an exploratory research applied in a local segment formed by companies at the time of completion of study does not used the Lean Six Sigma method, chosen as some factors socio-economic profiles and consumption habits of customers of these companies. According to George (2004), a Lean Six Sigma project data from customers should be embedded in the process of improving and the information must be incorporated into decision-making.
The perception of the customers about the quality of services is more complex than on products. There is a greater demand on the procedure for the delivery of these, as involvement and sensitivity of the service provider, Quintella et al. (2004). However, when the client adds value to these aspects, companies seem to walk towards business success. Stock Exchange data show that companies with higher ratio between market value and book value, showed big revenue and profit growth, (GEORGE, 2004).
In case of this survey, were executed twenty experiments, with nineteen variables, being thirteen real factors and six empty columns or ghosts, taking into account the need of experimental array, as Table 03.
Table 03 – Factors investigated and their respective levels.
| Factors | Level | |||
| (+) | (-) | |||
| 1 | The | Genus. | Male. | Female. |
| 2 | (B) | Age group. | Above 40 years. | Up to 40 years. |
| 3 | (C) | Schooling. | Graduated. | Don’t graduate. |
| 4 | (D) | Works? | Yes. | No. |
| 5 | And | Family income level. | 05 above wages. | Until 05 wages. |
| 6 | (F) | Marital status. | Married/Amancebado. | Others. |
| 7 | G | Have kids? | Yes. | No. |
| 8 | H | Residence | In the city. | Others. |
| 9 | (I) | Got a car? | Yes. | No. |
| 10 | J | Villa. | Own. | Rental. |
| 11 | K | How often you use the supermarket? | + 01 time per month. | Until 01 time per month. |
| 12 | L | How many people are there in your family? | + 05 people. | Until 05 people. |
| 13 | M | Prefer frequent supermarket. | Days of the week. | Weekends. |
| 14 | N | “Ghost”. | ||
| 15 | The | “Ghost”. | ||
| 16 | P | “Ghost”. | ||
| 17 | Q | “Ghost”. | ||
| 18 | R | “Ghost”. | ||
| 19 | S | “Ghost”. | ||
Source: Authors.
4.1 Profile of Informants
Twenty specific profiles have been defined for customers of supermarkets which complied to the structure of the array proposal (table 04), which served as informers in the application of the questionnaire, for completion of the experiments and obtain the answers or dependent variables.
Therefore, 20 related experiments by combining two different levels of selected factors: high (+) and down (-), and thus defined the profile of each informant, which later served as a source of data collection on application of a closed questionnaire and directed.
Selected informants were asked about the perceived satisfaction about the services provided by supermarkets retailers of medium and small sizes, located in a city in Vale do Paraíba. Sought to maintain confidentiality regarding the identity of the companies involved in the trial process.
Table 04-Profile of Informants
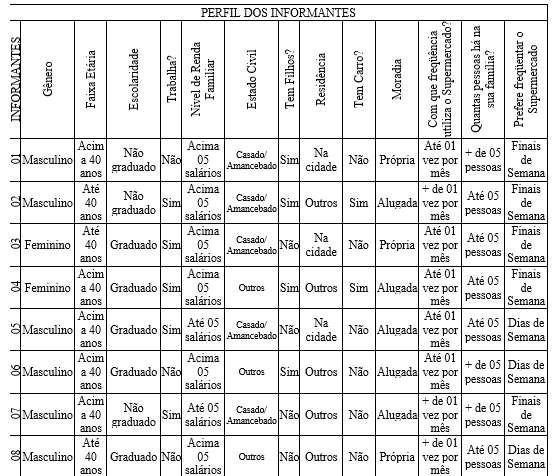
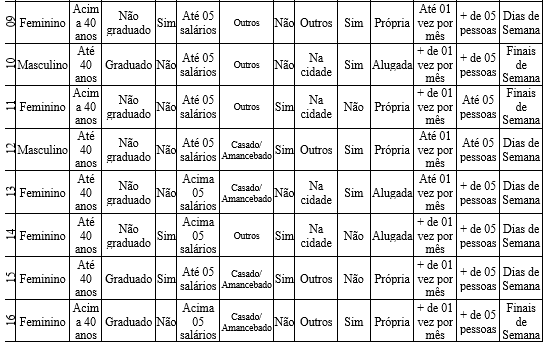
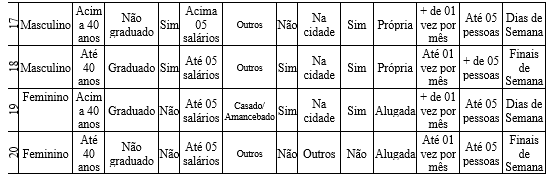
Source: Authors.
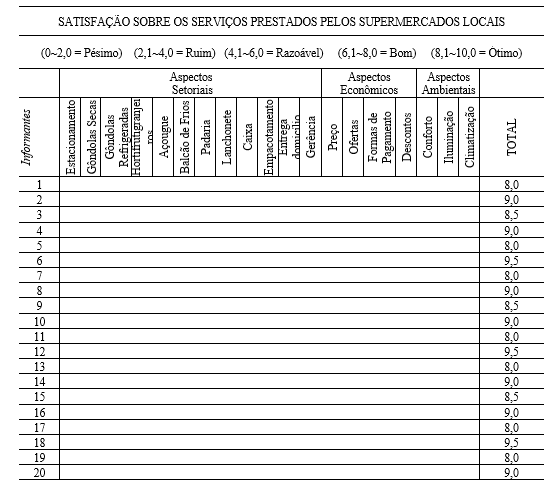
The measurement of satisfaction answered a scale from zero to ten, assigned to specific aspects of the supermarkets, as the result the arithmetic mean from the sum of all values. 05 table shows results and aspects considered in the questionnaire.
5. Space analysis
5.1 study site:
The municipality, object of this study is situated in the Paraíba Valley, in southeastern Brazil. It has an estimated population of 87,980 inhabitants, distributed in a land area equal to 414.160 square miles, according to data published in the IBGE – Brazilian Institute of geography and statistics (2017).
06 table – Table based on the information of the last IBGE senses.
| Municipality | Estimated population-2017 | Municipal human development index (IDHM) 2010 | GDP per capita-2015 R$ |
| Municipality studied | 87,980 | 0.766 | 24,456.18 |
| Guaratinguetá | 120,417 | 0.798 | 40,014.21 |
| Taubaté | 307,953 | 0.800 | 48,634.09 |
| São José dos Campos | 703,219 | 0.807 | 52,858.35 |
| São Paulo | 12,106,920 | 0.805 | 54,357.81 |
Source: adapted from IBGE – Brazilian Institute of geography and statistics (2017).
In order to identify most relevant to the achievement of this research, raised certain demographic information and human development index of some municipalities of Vale do Paraíba Paulista and the capital of the State of São Paulo, as a basis comparative.
The researchers raised also information related to domestic products of these municipalities, as Table 06.
07 table – Table based on the information of the last IBGE senses.
| Municipality | GDP at current market price-2015 (x 1,000) R$ | Gross value added in the industry – 2015 (x 1,000) R$ | Percentage of value added in industry GDP (%) | Value added service-2015 (x 1,000) R$ | Percentage of value added in service on GDP (%) |
| Municipality studied | 2,132,041.11 | 601,447.30 | 28.20 | 1,019,373.13 | 47.81 |
| Guaratinguetá | 4,764,611.60 | 1,527,977.49 | 32.06 | 2,046,006.68 | 42.94 |
| Taubaté | 14,703,591.83 | 4,965,631.35 | 33.77 | 5,688,837.47 | 38.69 |
| São José dos Campos | 36,398,100.25 | 13,517,172.25 | 37.13 | 15,273,198.61 | 41.96 |
| São Paulo | 650,544,788.73 | 63,665,137.84 | 9.78 | 431,465,442.20 | 66.32 |
Source: adapted from IBGE – Brazilian Institute of geography and statistics (2017).
You can tell, by analyzing the 06 and 07 Tables that the municipality studied, even with the lowest GDP per capita, i.e. 24,456 .18 R$ still has the second best percentage composition of value added in service on GDP, 47.81% and only in this item, below the performance of the city of São Paulo capital.
Believed to be relevant to study the services segment in this town, because, between the senses of 2004 and 2015, it found a growth in added value in the service of the municipality of 405.79% therefore presents itself, from these constituencies, a big potential for generating wealth and impact on the local economy and society.
Lean Six Sigma has helped service provider companies to minimize costs, George (2004). Therefore, the maximization of profits and this phenomenon, which has conceptual base in your financial and accounting equation, L (profit) = P (price)-C (cost), can increase the business competitiveness, attract new investment and cause the heating economical.
5.2 method limitations
Several limitations were encountered when studying a tool applied in Lean Six Sigma project in companies that do not use this method:
- The Plackett-Burman method was used for being a model suitable for economically detect main effects, however the needs of each company also must be analyzed separately to select the best method of design of experiments to be applied in each case.
- The survey was conducted with clients of supermarkets, outside the physical spaces and companies without seeking up the identity of the company preferred by informants. Thus, it was studied the segment in the region and not the companies themselves.
Although it may have been no limitations as to the search for a comprehensive analysis on the Lean Six Sigma method, it is believed that the findings raised by means of an experimental method efficient, which minimizes the impacts of development projects and abstract maximizes the achievement of theory, were sufficient to meet the proposals and hypotheses of this research. Therefore, it is believed that in examining socio-economic information and conclusions consumption habits of customers through statistical models can have added research and reliability given the basis for the quantitative research and qualitative.
6. Results
By means of the methods and materials used, one can perform the calculations required for the calculation of the effects, the significance tests and possible conclusions and adjustments to the process studied. 08 table demonstrates their responses of experiments performed.
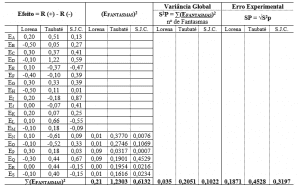
Were calculated the effects of the factors, the overall variance and the experimental error, obtained from the ghosts, as Table columns 09.
The effects were calculated by the difference between the averages of the answers relating to high and low factors. This calculation is repeated in each combination of levels, represented by nineteen 08 table columns.
09 table – table for calculating the effects of factors, global variance and experimental error.
| Effect = R (+)-R (-) | (EFANTASMAS) 2 | Global Variance | Experimental Error | ||
| S2P = 8 (EFANTASMAS) 2 in of Ghosts | SP = √ S2p | ||||
| And | 0.20 | 0.035 | 0.1871 | ||
| EB | -0.50 | ||||
| EC | 0.30 | ||||
| ED | -0.10 | ||||
| EE | 0.10 | ||||
| EF | -0.40 | ||||
| EG | 0.30 | ||||
| EH | -0.50 | ||||
| HEY | 0.20 | ||||
| EJ | 0.00 | ||||
| EK | 0.20 | ||||
| EL | 0.10 | ||||
| In | -0.10 | ||||
| EN | 0.10 | Ghost | 0.01 | ||
| And the | -0.10 | Ghost | 0.01 | ||
| EP | 0.30 | Ghost | 0.09 | ||
| EQ | -0.30 | Ghost | 0.09 | ||
| ER | 0.00 | Ghost | 0.00 | ||
| ES | -0.10 | Ghost | 0.01 | ||
| Projector (EFANTASMAS) 2 | 0.21 | ||||
Source: Authors.
The sum of the effects ghost raised to the second power and divided by the amount of these columns empty, the variance is extracted.
The experimental error is calculated by quadratic root of the variance.
The possession of these values allowed calculating the values of “t” and compare them to the value of the “t critical”, obtained through the Critical Values of table “t” and, therefore, define the significance of the factors studied, as shown in table 11. The model 10 table delineates the significance test.
Table 10 – Delimitation of the significance test.
| tcalc (≥) = SIGNIFICANT tcrítico | |
| tcrítico = tcalc (<) NOT SIGNIFICANT | |
Source: Authors.
Table 11 – test Table of significance of the effects studied.
| t Calculated | t Critic | Results of significance tests | |||
| | Effect | SP |
Critical Values of t | ||||
| tcalc the | 1.07 | < | 2.447 | NOT SIGNIFICANT | |
| tcalc B | 2.67 | > | 2.447 | SIGNIFICANT | |
| tcalc C | 1.60 | < | 2.447 | NOT SIGNIFICANT | |
| tcalc D | 0.53 | < | 2.447 | NOT SIGNIFICANT | |
| tcalc and | 0.53 | < | 2.447 | NOT SIGNIFICANT | |
| tcalc F | 2.14 | < | 2.447 | NOT SIGNIFICANT | |
| tcalc G | 1.60 | < | 2.447 | NOT SIGNIFICANT | |
| tcalc H | 2.67 | > | 2.447 | SIGNIFICANT | |
| tcalc I | 1.07 | < | 2.447 | NOT SIGNIFICANT | |
| tcalc J | 0.00 | < | 2.447 | NOT SIGNIFICANT | |
| tcalc K | 1.07 | < | 2.447 | NOT SIGNIFICANT | |
| tcalc L | 0.53 | < | 2.447 | NOT SIGNIFICANT | |
| tcalc M | 0.53 | < | 2.447 | NOT SIGNIFICANT | |
| tcalc N | 0.53 | < | 2.447 | NOT SIGNIFICANT | |
| tcalc the | 0.53 | < | 2.447 | NOT SIGNIFICANT | |
| tcalc P | 1.60 | < | 2.447 | NOT SIGNIFICANT | |
| tcalc Q | 1.60 | < | 2.447 | NOT SIGNIFICANT | |
| tcalc R | 0.00 | < | 2.447 | NOT SIGNIFICANT | |
| tcalc S | 0.53 | < | 2.447 | NOT SIGNIFICANT | |
Source: Authors.
The experiments revealed the significance of the effects on the process studied, as illustrated in table 12. The dotted lines in the table demonstrate significant effects.
Table 12 – Illustration of the process studied as the significance revealed in research
| The |
(B) |
(C) | (D) | And | (F) | G |
H |
(I) | J | K | L | M | N | The | P | Q | R | S | T |
| 0 | – | 0 | 0 | 0 | 0 | 0 | – | 0 | 0 | 0 | 0 | 0 | 0 | 0 | 0 | 0 | 0 | 0 | 0 |
| Up to 40 years | Other |
Source: Authors.
7. Discussion
Expected to in this research, above all, raise answers that addressed the proposed goal, i.e., identify opportunities for improvement of supermarket business retailers in a city situated in the Paraíba Valley, on the basis of the relationship among the information gathered in the survey and the concepts studied.
Significant effects were identified and the possibility of direct improvements for more value-added processes, avoiding wastes with non-significant, process variables can be related directly to a better control over variabilities, improvement in the quality of services, increase the speed of processes and minimizing costs. These relations will be discussed below.
7.1 control over variabilities
Six Sigma concepts establish a “closed loop” in order to control the variability, and are used to process data and customer information, Pande (2001).
In this research, customer profiles were used to represent the data needed for the calculation of the effects on the process, i.e., the perception of the quality of the services provided. The data collected with the application of the questionnaire represented the customer information, so valued in a Lean Six Sigma project.
It was realized in the research that the application of DOE allows direct control of independent variables by means of tests of significance and can assist in the reduction of existing waste. As the concepts studied, the six sigma level indicates 99.9997% yield in business process, i.e. 3.4 (three point four) defects per million opportunities.
Know the level “sigma” process studied requires the application of other tools. In the future, explore statistical tools in measuring phase of a Lean Six Sigma project can be relevant to try to experiment with few resources the concepts studied, until they complete the cycle DMEDI.
7.2 improvement in quality of services
Being the quality of the services a competitive differential, it is important that the medium and small business retailers stop economic means of continuous improvement and can remain on the market. However, the quality achieved by services should be perceived by customers to add value to the business. According to George (2004), companies that obtained best results in revenue and economic profit in the stock market were the ones that kept a high ratio between market value and book value. In this study, the DOE assisted the identification of customer profiles that perceive the quality of local supermarkets.
7.3 increase in speed of processes and minimizing costs
Can be identified in the literature that the design of experiments is a tool originally applied in the Six Sigma methodology, which is linked to defects in quality and the Elimination of waste, Pande (2001); George (2004). The method applied in this research proved efficient for identifying the effects with greater significance in the processes, and can be used prior to application of Lean Tools, which can add greater speed to projects or processes, since the DOE supports the decision about the direction of the efforts. According to George (2004), the Lean goal is to accelerate the speed of any process. Targeting for significant effects to the process, therefore, streamlines the process of continuous improvement, reduce waste and minimize costs.
Therefore, in the integration of Lean and Six Sigma concepts, an approach can add value to another methodology.
The economic method applied in this research enabled a search with minimized cost and speed, because the quantity of experiments can be reduced.
8. Conclusion
While the authors studied deem financially high implementing a Lean Six Sigma project, this study made it possible to experience the application of one of the most powerful tools of Lean Six Sigma-DOE, with low cost and, therefore, accessible financially small and medium-sized supermarkets retailers.
The supermarket retailers segment in Brazil, especially in the capital and in major cities, is dominated by large companies oligopolizadas. However, some inland cities have not yet suffered the impact of this neoliberalist economy. The mechanisms studied in this work revealed a tool that can assist small and medium-sized supermarkets to prepare and be more competitive.
In this research, the phase with the highest cost and expenses was the identification of customer profiles that attended to the structure of the experiment. However, the costs of application of DOE in these supermarkets can be minimized, since all the companies involved in the research have computerized systems, able to identify quickly and reliability the information needed for this type of research. These softwares provide information about the socio-economic profiles and consumption habits of customers, which streamlines the process of identification of informants, as the need of experimental structures, which in this case was a factorial array saturated fractional.
8.1 adjusting the process
In terms of competitiveness, the intention is to increase the results on the perception (opinion) of customers about the services provided by supermarkets the city retailers studied. It is concluded that the process must be adjusted as shown in table 13.
Table 13 – proposal for process adjustment.
| The |
(B) |
(C) | (D) | And | (F) | G |
H |
(I) | J | K | L | M | N | The | P | Q | R | S | T |
| 0 | – | 0 | 0 | 0 | 0 | 0 | – | 0 | 0 | 0 | 0 | 0 | 0 | 0 | 0 | 0 | 0 | 0 | 0 |
| Above 40 years | In The City |
Source: Authors
The results obtained indicate that customers with significance to improve the process of perception of the quality of services provided by supermarkets are people above 40 years and residents in the city.
8.2 opportunities for improvement
Not only were raised the significance of the factors in the process of assessing the satisfaction about the services provided by supermarkets, as well as retailers sought to identify potential opportunities for improvement in business.
Strategies for improvements in processes and businesses can depend on many variables. However, in the case of this work, it was noticed that the supermarkets retailers studied could be focusing its efforts on Marketing or investing in improvements in internal sectors, focusing on customers over 40 years, residents in the city.
The non-significant effects also led the researcher to question themselves about the possibility of these effects have significance on other processes, which can help identify the attractions that bring customers with these profiles to attend these supermarkets.
Finally, explored the application of statistical tools and part of Lean Six Sigma processes to provide services in the Vale do Paraíba region.
It is believed that this research can serve in the future as the basis for other experiments, because although the limitations have been great, the researcher sought the practical application of concepts, which until then were little exploited, especially in the area administrative.
8.3 Suggestions for future work
Through the identified problems and limitations of the method applied, you can raise potential opportunities for continuity of research work, namely:
- Experience the application of Lean or six Sigma tools in other processes and with low costs, focusing on medium-sized and small businesses.
- Get to work in partnerships with the MIDs and small supermarkets, in order to add value to future work, especially in order to search the internal environment of the companies and, therefore, with greater wealth of information and making it a alignment between the organizations strategic needs and objectives of the research.
Still, one can point out that the results obtained in this research also reveal likely problems to other works, such as:
- Study in isolation the sectors or internal departments of medium and small grocery retailers.
- Or, raise what are the factors that can attract customers with profiles that were “not significant” in the process studied in this research. The concepts dealing with the DMEDI with the improved model better suited to exploratory situations and the DOE applies in one of those phases. With it, the opportunity of future research to explore low-cost other phases of the project in this economic segment and place.
References
ANJARD, RONALDO, P. Management and Planning tools. Training for Quality, v. 3. N. 2. 1995. Pp. 34-37.
BARROS NETO, BENÍCIO OF; SCARMÍNIO S. IEDA; BRUNS, AND ROY. Planning and optimization of experiments. UNICAMP, 2003. 299 p.
BONDUELLE S.A., GHISLAINE, m. application of design of experiments to control the manufacture of wooden fibres. UFPR. 2000.
DEMING, W. Edwards. Out of the crisis. Boston, Ma: Mit Press, 1986.
ENGINEERING STATISTICS HANDBOOK. Available in: <http: www.itl.nist.gov/div898/handbook/pri/section3/pri335.htm=””>.</http:> Access in: 07 jan. 2007.
GEORGE, M.L. Lean Six Sigma: combining six sigma with lean speed. McGraw Hill, 2002, 323 p.
_ _ _ _ _ _ _ _, M.L.; KASTLE, B.; ROWLANDS, D. T.; What is a Lean Six Sigma? McGraw Hill, 2003, 96 p.
_ _ _ _ _ _ _ _, M.L. Lean Six sigma for services: how to use Lean speed and Six Sigma Quality to improve services and transactions. McGraw Hill, 2003, 436 p.
IBGE – BRAZILIAN INSTITUTE OF GEOGRAPHY AND STATISTICS. Available in: <https: cidades.ibge.gov.br/brasil/sp/lorena/panorama=””>.</https:> Access in: 01 10. 2017.
JURAN, J. M. The quality from the project: new steps for planning Quality into goods and services. São Paulo: Pioneer, 1992.
JURAN, j. m. Planning for quality. São Paulo: Pioneer, 1990.
OHNO, Taiichi. The Toyota production system, in addition to the large-scale production. Porte Alegre: Bookman, 1997.
PANDE, P. S.; NEUMAN, R. P.; CAVANAGH, r. r. Six Sigma Strategy: like GE, Motorola and other major companies are sharpening your performance. Rio de Janeiro: Thorsons, 2001.
RAMPAZZO, l. Scientific Methodology to students of undergraduate and graduate courses. 2 ed. São Paulo: Loyola, 2004, 141 p.
SHINGO, Shingeo. The Toyota Production System. Porto Alegre: medical arts, 1996.
[1] Faculty of Technology of Pindamonhangaba; Centre for research in economic and Sociology of organizations, Lisbon, Portugal
[2] Faculty of Technology of Pindamonhangaba