ORIGINAL ARTICLE
RIBEIRO, Beatriz Gomes [1], MOREIRA, Erika Silva [2]
RIBEIRO, Beatriz Gomes. MOREIRA, Erika Silva. Attendance at an emergency care unit: a case study at an emergency care unit located in Nova Iguaçu-RJ. Revista Científica Multidisciplinar Núcleo do Conhecimento. Year. 07, Ed. 04, Vol. 04, pp. 148-168. April 2022. ISSN: 2448-0959, Access link: https://www.nucleodoconhecimento.com.br/health/attendance
ABSTRACT
The satisfaction survey is a tool that identifies which factors generate the highest levels of dissatisfaction among users, providing data that make it possible to promote improvements in the quality of care. In the context of providing a public service, this research is fundamental to subsidize improvement actions, making the provision of the service more efficient. In view of this, the present study focuses on addressing the perception of users of an Emergency Care Unit (UPA)[3] located in the municipality of Nova Iguaçu, Rio de Janeiro, regarding the care received. Having as a guiding question: What are the users’ perceptions regarding the care provided in the investigated UPA? And, as a general objective, to analyze the perceptions of users regarding the care provided in the investigated UPA. The adopted methodology has a descriptive character, with results treated in a quali-quantitative way, from the collection of primary and secondary data, and survey of information through an applied questionnaire. For analysis of perceptions, some factors were raised, such as: waiting time and quality of care received at reception; satisfaction with the care received by nursing; waiting time and quality of care at the doctor’s office; cleaning and organization of the UPA; and satisfaction with the service in general. The data collected showed that: in relation to the waiting time for service at the reception, 55% of the interviewees considered it satisfactory, as for the quality of this service, 60.9% classified it as satisfactory. Regarding nursing care, 86.9% said they were satisfied or very satisfied; regarding the waiting time for medical care, the satisfaction and dissatisfaction indexes show identical results (33.3%); regarding the quality of care provided by physicians, 69 .6% declared themselves satisfied or very satisfied and 30.4% were dissatisfied or very dissatisfied. Regarding cleanliness and organization, 71% of users said they felt satisfied or very satisfied. Finally, it was possible to verify that, in relation to the service in general carried out in the investigated UPA, 44.9% classified the service in the unit as excellent, great or good, 31.9% considered the service regular and 23.2% classified the service as bad or bad.
Keywords: Quality of care, Emergency Care Unit, Quality in the user’s perception.
1. INTRODUCTION
The main focus of this article is to address the perception of users in the care of an Emergency Care Unit, located in the municipality of Nova Iguaçu, Rio de Janeiro. In this context, the importance of the satisfaction survey is highlighted as a tool that identifies which factors generate the highest levels of dissatisfaction in users, providing data that make it possible to promote the improvement of the quality of care.
According to Las Casas (2008), it is necessary to observe that service evaluations are subjective, and it is valid to consider the customer’s perception of the quality of the service provided. When considering the provision of a public service, it is important to emphasize that research on the quality of care is fundamental to subsidize improvement actions, making the provision of the service more efficient.
According to Tironi et al. (1991) the public service should not present discrepancy in quality even when provided by private entities, and should prioritize the satisfaction provided to the consumer, client or user. Therefore, given the complexity of health services, it is necessary to promote an evaluative culture in health units as an instrument for continuous improvement of processes that directly impact the perception of quality in care.
Discussing the users’ perception of care is fundamental and important to carry out a diagnosis of the care provided at the health unit, in addition to enabling the real needs of users of this system to be verified. It is also worth emphasizing that this assessment is not limited to simply exposing the perception of the Unified Health System (SUS)[4] user, but can also provide data that can influence the decision-making of managers, as it determines the acceptance rate and / or rejection of the services provided and offers subsidies to managers to identify possible failures and prepare an improvement plan.
Therefore, the article established as a research problem: What are the users’ perceptions regarding the care provided in the investigated UPA? And as a general objective: to analyze the perceptions of users regarding the care provided in the investigated UPA. For that, the following specific objectives were defined: conceptualize patient satisfaction; conceptualize the perception of quality in care and identify the perceptions of users regarding the care received in the investigated UPA.
The approach to this theme is justified by the need to carry out a diagnosis of the care provided in the Unit in question, in addition to enabling the verification of the real needs of the users.
The present study consists of the elaboration of the research that comprises, in the first stage, the collection of secondary data and, in the second stage, a field research through the application of a questionnaire that sought to identify the main points of dissatisfaction and deficiency in the service in the perception of users of this unit.
2. CUSTOMER SATISFACTION
The industrial revolution of the 17th century changed the way people consumed the world. With industrial production on a large scale, the main supplier of products is no longer the small craftsman, in which this transition in the mode of consumption became known as the era of statistical control. According to Longo (1996) with mass production came the need to think about and implement quality management systems with a focus on reducing production failures, the author points out that, from that moment on, “quality ceased to be an aspect of product and became a company problem, encompassing, as such, all aspects of its operation” (LONGO, 1996, p. 7).
According to Ensslin et al. (2013), until the early 1980s, there was still no information about the performance of product quality and user satisfaction, so that authors such as Parasuraman, Zeithaml and Berry (1988), Cronin and Taylor (1992), Aldlaigan and Buttle (2005) were the first to establish parameters that made it possible to assess quality performance from the point of view of consumers, and it was from the conception of these parameters that customer satisfaction became the thermometer that measures the quality of the service offered. According to Schmitt (2004, p.23), the satisfaction survey “is a result-oriented attitude emanating from customers who bought the product’s performance with their respective expectations about it.”
Taking into account the studies and definitions already prepared, it is understood that collecting and evaluating customer information makes it possible to understand important aspects with regard to the perception of service quality, the evaluation of this indicator plays a fundamental role in the management of organizations . According to Las Casas (2008), information collected through tools such as questionnaires and interviews, among other techniques, supports decision-making.
Pode-se considerar que qualidade seja algo abstrato, visto que nem sempre os clientes definem, concretamente, quais são suas preferências e necessidades; pode-se considerar que qualidade seja sinônimo de perfeição, da absoluta falta de defeitos no produto ou no serviço prestado; pode-se considerar que qualidade nunca se altera para certos produtos ou serviços; pode-se considerar que o conceito de qualidade seja um aspecto subjetivo de que ela varia de pessoa para pessoa, em função de especificidades que cada cliente possui; pode-se considerar que qualidade seja capacidade de fabricação, a fim de que um produto ou serviço seja concretizado exatamente conforme seu projeto; pode-se considerar qualidade como um requisito mínimo de funcionamento em situações em que os produtos são extremamente simples; pode-se considerar como qualidade a diversidade de opções que um produto ou um serviço oferece; e, até mesmo, pode-se pensar que qualidade seja a área com base na qual todo processo de ‘produção da qualidade’ se desenvolve ( PALADINI, 2010, p. 23-24).
For Paladini (2010), the perception of quality varies according to customer expectations. The entire process that makes up the customer experience will contribute to satisfaction or dissatisfaction. Thus, the importance of Total Quality Management methods and tools that make it possible to collect, measure and evaluate this experience is evident.
In the context of health management, user satisfaction and the provision of a quality service is part of a process that seeks continuous improvement. According to Machado et al. (2016, p. 2):
A satisfação do usuário, especificamente, é considerada um importante indicador da qualidade do serviço e ainda tem importante influência na adesão ao tratamento e continuidade do cuidado do paciente. A avaliação do serviço aponta condições de acesso ao serviço, relação profissional-paciente, adequação das instalações, entre outros. Desta forma, avaliações da percepção dos usuários podem desempenhar papel importante nas formas da prestação de serviços em saúde.
Organizations seek to improve the services offered to win new customers and retain those who already use their services. Thus, it can be concluded that the perception of users has a direct impact on improving the quality of care.
3. QUALITY IN SERVICES
At the end of the 18th century, quality began to be understood as a necessary process to optimize processes and increase production and profits. And, over the years, quality has gained prominence in organizations. This process of evolution is highlighted by Oliveira (2014) who divides the evolution of quality into four “ages” arranged in the following topics:
1. Inspeção – Período que quase iniciou antes da Revolução Industrial. No período da inspeção os artesãos eram responsáveis pelo projeto, produção e eram responsáveis pela qualidade de seus produtos. A inspeção da qualidade só era realizada ao final do Processo. Assim, este período teve ênfase na inspeção corretiva e não na prevenção.
2. Controle estatístico da qualidade – O aperfeiçoamento da teoria estatística forneceu apoio ao controle de processos e, somado ao surgimento dos elementos da Administração científica, foi possível o início da era do controle estatístico.
In this context, among the main characteristics of the Statistical Quality Control era, there is the end of 100% inspection, where inspections started to be done by sampling and the creation of the quality inspector role.
3. Garantia da qualidade – vigente no período pós segunda guerra mundial, a garantia da qualidade apresenta como principais características: a teoria de custos da qualidade; o controle da qualidade; as técnicas de confiabilidade e o programa zero defeitos. Nesta época despertou-se uma preocupação com a qualidade ao longo da cadeia de suprimentos e a ênfase migrou para a prevenção de erros e defeitos, deixando a inspeção corretiva no passado.
4. Gestão da qualidade total – A partir da década de 1970 foram criadas as bases para o surgimento da qualidade total. Suas principais características são: participação de todos, pessoas e setores, na empresa; aplicação de gestão da qualidade em todos os aspectos do negócio (processos e funções); integração da gestão da qualidade à gestão estratégica da empresa; percepção de qualidade pelo cliente a partir da comparação com produtos concorrentes; e reconhecimento da qualidade como uma poderosa arma organizacional para a competição.
Therefore, it can be understood that something has quality when it exceeds the expectation of the one who receives the product or service. In this way, quality becomes something that does not fit within just one concept, as it is linked to the user’s perception and takes into account the individual’s experience at a given moment.
Table 1: AGSS Principles
| AGSS Principles | |
| Principles | Definitions |
| Utility | Evaluation for the management of health services is based on its usefulness in the functioning of health services. It has to subsidize decision-making that brings solutions to the problems of the services that are preventing the achievement of the established objectives or that are making it difficult to obtain a greater impact on the health of the population. |
| Opportunity | The evaluation has to be done in time so that its results can be used in decision-making, that is, the deadline for its execution will be the time between the demand for the evaluation and the moment of decision-making. |
| Ease | The evaluation has to be not only viable in technical, economic and political terms, but also has to have the capacity to produce the expected effects of the decisions taken, that is, it has to be pragmatic in terms of making viable choices and about which it has governance. |
| Reliability | As a process that aims to support both decision-making and its implementation, the evaluation has to be coated with rationality, coherence and consistency so that it can be considered valid and accepted by all those who are involved in the decision and its implementation execution. |
| Objectivity | Considering the existence of limits to its realization, the assessment for management should seek the best knowledge and the greatest depth possible within the time and resources available. This means that, under these conditions, obtaining the greatest possible contribution to decision-making is more important than the search for greater evaluation validity. |
| Directionality | The evaluation for the management of health services has to lead, in all possible spaces, the choices towards the resolution of the problems that gave rise to the evaluation process, the satisfaction of the needs of the population and the implementation of the policies of the sector. |
Source: Tanaka; Tamaki (2012, p. 823).
According to Tanaka and Tamaki (2012), in health services it is necessary to consider the complexity, diversity of services, time and resources available in decision-making. To subsidize decision-making, there is an Assessment for the Management of Health Services (AGSS)[5], which the authors define as a technical-administrative and political process of judging the value or merit of something, to support decision-making in everyday life , which means producing information capable of supporting an intervention in a timely manner.
When the organization to be evaluated is a public health unit, it is necessary to observe the norms and guidelines of the National Program for the Evaluation of Health Services (PNASS 2015), which operates nationwide and has the general objective:
Avaliar a totalidade dos estabelecimentos de atenção especializada em saúde, ambulatoriais e hospitalares, contemplados com recursos financeiros provenientes de programas, políticas e incentivos do Ministério da Saúde, quanto às seguintes dimensões: estrutura, processo, resultado, produção do cuidado, gerenciamento de risco e a satisfação dos usuários em relação ao atendimento recebido. (BRASIL, 2015, p. 6)
Also according to the PNASS (2015), evaluations in the Emergency Care Units are carried out in accordance with the provisions of the PNASS, in which 48 items make up this evaluation process. In this context, together, these data provide information that guides, redirects and directs laws, public policies, norms and public health programs throughout the national territory.
Within the document of the National Program for the Evaluation of Services, the evaluated criteria are established, namely: the list of items, the user satisfaction survey and the set of indicators.
As explained in the PNASS document (2015), in the user satisfaction survey, the applied questionnaire aims to verify: “the agility in scheduling the service; service agility; reception; confidence; environment (comfort, cleanliness, signaling, noise); clothes; food; humanization marks; expectation about the service” (BRASIL, 2015, p. 49).
For the author Mallet (2005), with the evaluation of quality it is possible to measure and monitor the quality through the analysis of results. Thus, for a performance quality analysis, it is necessary to consider that the evidence can be direct or indirect and that these cannot be considered quality attributes, however, this information should be used for the purpose of assessing the interference in the quality of care.
For Donabedian (1990), a renowned author in the area of quality in health, the components that make up quality in health services can be grouped into what the author called: “Seven pillars of quality”.
Table 2: Definition of the pillars of quality in health services
| Quality Pillar | Definition |
| Efficacious | It is the ability of the science and art of medical care to offer the best under the most favorable conditions. |
| Effectiveness | It is the improvement achieved, or expected to be achieved, in real conditions of daily practice in relation to the best verified care. |
| Efficiency | Defined as the ability to obtain the maximum improvement in health at the lowest cost. |
| Optimization | The fourth pillar of quality can be defined as the most advantageous balance between costs and benefits. This aspect becomes relevant when the effects of care are not evaluated only in absolute terms, but in relation to the cost of care. |
| Acceptability | Acceptability refers to the adaptation of health care to the desires, expectations and values of patients and their families.
It largely depends on the patient’s subjective assessment of what is effective, efficient, and optimal. Also coming into consideration at this point: accessibility, the doctor-patient relationship and the convenience of treatment. |
| Legitimacy | Legitimacy introduces the social issue into the discussion of quality: at the social level, in addition to caring for the individual, there is responsibility for the well-being of all. Society often has a perception of costs that is very different from that of the individual. The main reason is the social financing of health by third parties or by the state. |
| Equity | It is the principle that determines what is fair in the distribution of care and its benefit among members of a population. At the social level, the equitable distribution of health care is carried out in accordance with a deliberate social policy. |
Source: Donabedian (1990)
It is important to highlight that the quality of service and the assessment of customer satisfaction is also worked on within public health units. According to Tironi et al. (1991):
Qualidade do serviço público é, antes de tudo, qualidade de um serviço, sem distinção se prestado por uma instituição de caráter público ou privado; busca-se a otimização dos resultados pela aplicação de certa quantidade de recursos e esforço, incluída, no resultado a ser otimizado, primordialmente, a satisfação proporcionada ao consumidor, cliente ou usuário. (TIRONI et al., 1991, p. 8)
Given the above, it can be concluded that the assessment of quality in services is an essential tool for management and this importance is related to the ability to provide data that enable the measurement of user satisfaction, the evaluation of the effectiveness of processes, the reduction costs, among other aspects. This set of data helps managers in decision-making and process improvement.
Currently, public and private organizations around the world use research tools that can provide them with data on customer satisfaction, and this concern also extends to health units. Knowing the customer, their needs and expectations is essential for any organization, as it makes it possible to identify weaknesses and set goals for improving the quality of the service provided.
4. METHODOLOGY
The present study consists of a descriptive research, with results treated in a qualitative and quantitative way, from the collection of primary and secondary data, and the application of a questionnaire with users of an Emergency Care Unit, located in the municipality of Nova Iguacu, Rio de Janeiro.
4.1 CHARACTERIZATION OF THE SURVEY LOCATION
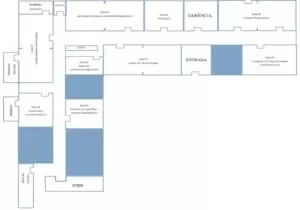
The UPA of Comendador Soares, object of research in this article, is located in the municipality of Nova Iguaçu in the state of Rio de Janeiro. It has 12 facilities distributed in: dressing room; plaster room; hygiene room; small operating room; rest and observation room – pediatric; critical patient care room/stabilization room; immunization room; undifferentiated attendance room; pediatric care room; dentistry room; welcome room and risk classification; and doctor’s office.
Currently, it is made up of 145 employees, including: 58 nursing technicians; 26 nurses; 21 clinical physicians; 6 pediatricians; 5 pharmacists; 5 technicians in clinical pathology; 3 general dentists; 2 office assistants; 2 orthopedic immobilization technicians; 2 clinical analysis laboratory assistants; 2 radiology technicians; 2 technicians in radiology and imaging; 2 biologists; 2 physicians in radiology and diagnostic imaging; 2 social workers; 1 nursing assistant; 1 orthopedist and traumatologist; 1 administrative assistant; 1 pharmacy technician; and 1 managing director.
Among the services provided to the community, we can highlight: stabilization of critically ill patients; electrocardiographic examination; biochemical tests; urinalysis; hematological examination and hemostasis; hormone tests; radiology and ultrasound.
In addition to these, some secondary services are also provided, such as: transportation by means of ambulance, material sterilization center, pharmacy, patient medical records, social work, laundry, nutrition and dietetics and equipment maintenance service.
4.2 PROCEDURES CARRIED OUT FOR DATA COLLECTION
Initially, a collection of research was carried out with different authors that deal with the quality of care and its main points, with the aim of interconnecting the ideas and thoughts aimed at the quality of care related to the UPAS.
After that, some factors related to the perception of users regarding the care provided at the UPA of Comendador Soares, located in the municipality of Nova Iguaçu in the state of Rio de Janeiro, were evaluated. The factors analyzed were: waiting time and the quality of care received at reception; satisfaction with the care received by nursing; waiting time and quality of care at the doctor’s office; cleaning and organization of the UPA; and satisfaction with the service in general.
The data collection instrument[6] was developed by google docs and has pre-defined questions, a stipulated period for the beginning and end of data collection, consisting of 13 closed questions and 1 open question, totaling 14 questions. Being sent to respondents through social networks, such as: WhatsApp, Facebook and Instagram.
Sampling was defined by convenience, consisting of 69 users of the researched UPA services. As for the definition of the sample, this is non-probabilistic, therefore not making use of statistical procedures, which enabled the selection of adequate characteristics to what was proposed by the research, with no generalization of the results and enabling the selection of interviewees intentionally.
Data collection took place between March 17 and May 17, 2021 and obtained 69 responses. Subsequently, the responses were analyzed and their results are described in the following topic.
5. RESULTS ANALYSIS AND DISCUSSION
In this topic, the results obtained with the application of the online questionnaire to 69 users of an Emergency Care Unit will be presented. The first question addressed aimed to verify satisfaction regarding the waiting time in the service provided at the reception (graph 1).
Graph 1: Waiting time for service at reception
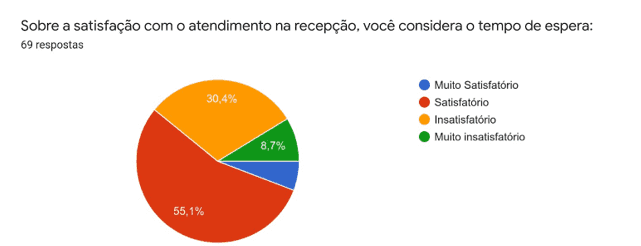
In Graph 1, it can be seen that more than half of the interviewees (55.1%) declared themselves satisfied with the waiting time for service at the reception. However, the result shows a very high number in the dissatisfaction index, in which 36.2% of respondents said they were dissatisfied or very dissatisfied with the waiting time to receive care in the sector.
This finding reinforces Silva’s perception (2016), when the author highlights that one of the contributions related to the satisfaction survey is the identification of dissatisfaction themes, through the evaluation of the patient’s experience, associated with other management indicators, in which it is possible to evaluate and monitor the quality of health services.
It can be concluded, therefore, that satisfaction or dissatisfaction, in this case, is related to the experience of each interviewee. Regarding the quality of care received at reception, graph 2 demonstrates the perception of users, as can be seen below.
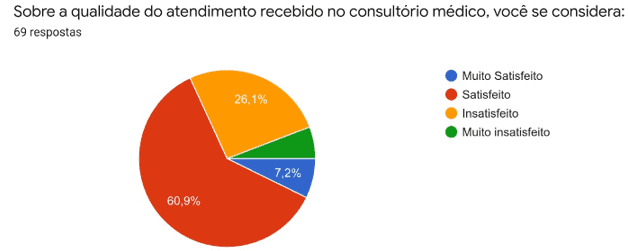
Graph 2: Quality of service at reception
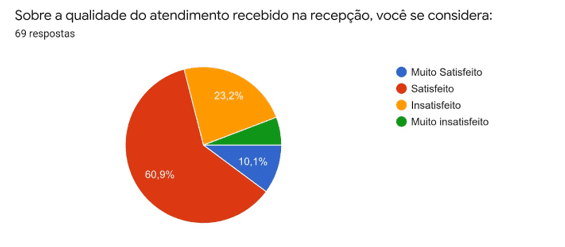
Graph 2 depicts the satisfaction rate with service at reception. Observing the graph, it can be seen that 71% of respondents believe that they received quality care in the sector. The remaining 29% declared themselves dissatisfied or very dissatisfied with the quality of care.
Kotler and Keller (2006) state that satisfaction is related to the individual’s expectations at a given time and it is necessary that customer satisfaction be measured frequently so that it is possible to obtain an evaluation parameter. In graphs 1 and 2, it can be seen that both results, satisfaction and dissatisfaction, show approximate results. The statement by Kotler and Keller (2006) supports the perception that satisfaction and dissatisfaction with care, at this point in the research, can be related to the waiting time for care.
In addition, the users’ perception of satisfaction with the care received in nursing was verified (graph 3).
Graph 3: Satisfaction index with nursing care
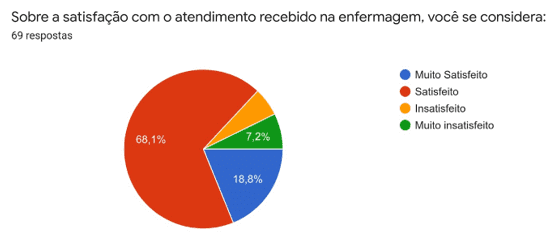
Graph 3 shows the highest satisfaction index in the survey, in which 86.9% of respondents said they were satisfied or very satisfied with the care received in the nursing sector.
The result shows an alignment of the sector with the Humaniza-SUS program (2010) which aims to apply the principles of the SUS in order to build a humanized SUS, also agreeing with Waldow (2004) who states that patients feel secure when cared for competently and kindly.
However, if, on the one hand, the data collected in this research item can show an effective and humanized service by these professionals, on the other hand, it is necessary to consider the possibility that this result is related to a smaller number of visits in the sector, since a part of consultations are completed in the offices, with guidelines for treatment at home and without the need to be medicated in the unit, reducing the demand for nursing care.
Regarding the satisfaction index related to the waiting time for medical care, graph 4 shows the results obtained.
Graph 4: Waiting time for medical care
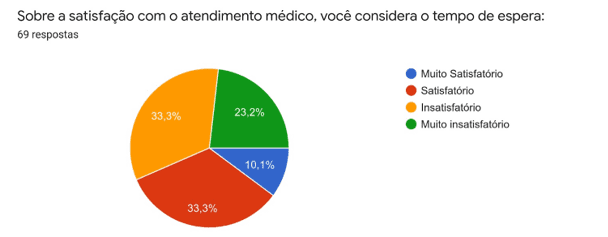
In this aspect of the research, it is observed that the satisfaction and dissatisfaction indexes present identical results (33.3%), where, in addition to these, 23.2% declared themselves very dissatisfied, and 10.1% very satisfied.
Returning to Donabedian’s thinking (1990), it is noted that this result is related to the fifth pillar of quality in health services. The principle of acceptability is directly linked to the adaptation of health care to the desires, expectations and values of patients and their families. Still according to the author, this evaluation depends on the subjective evaluation of the patient, on how he perceives what is effective, efficient and optimal.
The high rate of users dissatisfied with the waiting time (56.5%) conflicts with the goal of the National Health Agency (BRASIL, 2012), which stipulates a waiting time for a medical evaluation of up to thirty minutes for patients of urgency and emergency.
Next, the results of Graph 5 can be analyzed, which inform about satisfaction with the quality of care received at the doctor’s office.
Graph 5: Quality of care at the doctor’s office
Among the interviewees, 69.6% declared themselves satisfied or very satisfied with the care received and 30.4% were dissatisfied or very dissatisfied with the medical care.
According to Cronin and Taylor (1992), in an evaluation, the quality of the evaluated feature will be related to the customer’s perception of the performance of that feature. The results presented show that the perceived quality of health care “is judged by its compliance with a set of expectations […] the science of care determines effectiveness, individual values and expectations determine acceptability, and social values and expectations determine the legitimacy.” (DONABEDIAN, 1990, p. 1118).
Even with a waiting time of more than thirty minutes, as established by the National Health Agency (ANS)[7] (BRASIL, 2012), the service obtained a high level of satisfaction, this evaluation by the users may be related to assertiveness in the diagnosis and recommended treatment.
Graph 6 presents data that demonstrate the satisfaction rates of the unit’s users in relation to the cleanliness and organization of the environment.
Graph 6: satisfaction index with cleanliness and organization of the environment
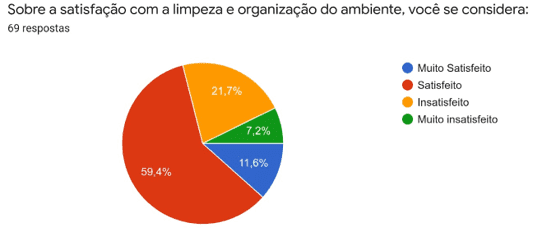
With regard to cleaning and organization of the environment in the unit, 71% of users said they felt satisfied or very satisfied and the other respondents said they felt dissatisfied or very dissatisfied.
For Sznelwar et al. (2004), the evaluation of the cleanliness of the environment is subjective and meets personal criteria, so that it is common for the cleaning criterion to be evaluated only by observing garbage particles in the environment.
In this context, it is important to consider that 29% of dissatisfaction can pose a risk to the patient’s life. According to the document “Aliança Mundial Para a Segurança do Paciente” of the World Health Organization (2005), infections related to health care are one of the main causes of death worldwide, the document reports that, only in the United States, at least At least 2,000,000 patients acquire infections related to care in health facilities, the country registers an average of 247 deaths per day as a result of these infections.
One can analyze the user’s perception of the care received at the unit, where care was evaluated considering all aspects of the research (graph 7).
Graph 7: Satisfaction index with the care received at the unit
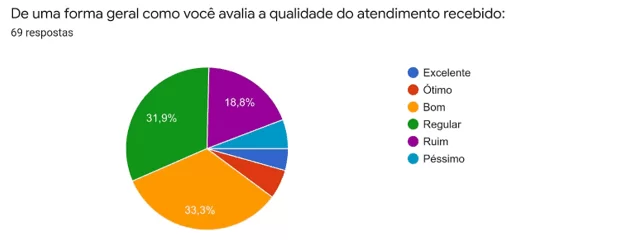
In Graph 7, it can be seen that 44.9% classified the service in the unit as excellent, excellent or good; 31.9% consider the service regular and 23.2% classified the service as bad or terrible.
With this question, we sought to understand how the user of the unit evaluates the service in its entirety, considering all experience related to the service in the target unit of this research.
According to Paladini (2010) each service has several characteristics, which are unique and result from the producer and consumer interaction. The result of this graph portrays the concept of Las Casas (2008) when this author states that, for customers, the result of these interactions will form a final concept, which may or may not be satisfactory on the part of customers. “It will be the company’s ability to carry out all the planned activities that will determine the level of quality.” (LAS CASAS, 2008, p. 15).
Therefore, it can be concluded that, bringing together all the aspects investigated in this research, less than half of the interviewees received satisfactory care.
At the end of the questionnaire, the interviewee can point out a point to be improved in the service provided by the target unit of this research. The table below presents a summary of the most discussed topics in this phase of the research.
Chart 1: Aspects identified as points to be improved in the unit.

With the individual notes, it can be identified that the aspects with the highest rate of dissatisfaction may be the result of the need for management to articulate a strategy focused on the motivation and continuous improvement of the active employees, however, it is possible to see that the lack of investment by the State to hire more professionals, put a stop to most of the strategic improvement actions developed by the unit’s management.
6. FINAL CONSIDERATIONS
The content addressed throughout this work demonstrates the perception of some users of an Emergency Care Unit (UPA) located in the municipality of Nova Iguaçu, Rio de Janeiro, as well as their direct contribution to the expansion of knowledge in the area of health management and public policy planning. The article allowed a discussion about the reality of the Emergency Care Units and highlighted the importance of satisfaction surveys as a tool to improve quality. However, knowing the subjectivity of evaluations, it is important to reinforce the need to implement a continuous evaluation process. Therefore, it is believed that this article will be able to contribute to the evaluation of the Unit’s performance, allowing the management to elaborate a plan of strategic actions adapted to the needs of the users.
Returning to the guiding question of this research, which aimed to answer the users’ perceptions regarding the care provided in the investigated UPA, it was found, as main results that: in relation to the waiting time for the service at the reception, 55% of the interviewees consider it satisfactory , regarding the quality of this service, 60.9% classified it as satisfactory. Regarding nursing care, 86.9% said they were satisfied or very satisfied; regarding the waiting time for medical care, the satisfaction and dissatisfaction indexes show identical results (33.3%); regarding the quality of care provided by physicians, 69 .6% declared themselves satisfied or very satisfied and 30.4% were dissatisfied or very dissatisfied. Regarding cleanliness and organization, 71% of users said they felt satisfied or very satisfied. Finally, it was possible to verify that, in relation to the service in general carried out in the investigated UPA, 44.9% classified the service in the unit as excellent, great or good, 31.9% considered the service regular and 23.2% classified the service as bad or bad.
The contents presented here demonstrate that many other studies can still be carried out on the origin of the problems listed in this article, due to the importance of the theme and numerous contributions to the academic environment, with the purpose of knowing the complexity of the management of a health unit, to develop public policies that effectively bring about improvements in the care provided to patients and their families. It is necessary to have effective measures for its control, such as stricter inspection of funds allocated to these health units, greater control of the inflow and outflow of medication, hospital equipment and physicians responsible for providing care. All this with the aim of making the service provided efficient and avoiding corruption within healthcare organizations.
REFERENCES
BRASIL. Ministério da Saúde. Agência Nacional de Saúde Suplementar. Tempo de espera na urgência e emergência. Vol. 1. ed. 01. Brasília: Editora do Ministério da Saúde, 2012. 7 p. Disponível em: https://www.gov.br/ans/pt-br/arquivos/assuntos/prestadores/qualiss-programa-de-qualificacao-dos-prestadores-de-servicos-de-saude-1/versao-anterior-do-qualiss/e-ace-02.pdf. Acesso em: 13 de fev. de 2022.
BRASIL. Ministério da Saúde. HumanizaSUS: Documento base para gestores e trabalhadores do SUS. 4. ed. 4. reimp. Brasília: Editora do Ministério da Saúde, 2010. 72 p. Disponível em: https://bvsms.saude.gov.br/bvs/publicacoes/humanizasus_documento_gestores_trabalhadore s_sus.pdf. Acesso em: 10 de fev. de 2022.
BRASIL. Ministério da Saúde. PNASS: programa nacional de avaliação de serviços de saúde. Brasília, 2015. 66 p. Disponível em: https://bvsms.saude.gov.br/bvs/publicacoes/pnass_programa_nacional_avaliacao_servicos.pdf . Acesso em: 2 de jan. de 2022.
CRONIN, J.; TAYLOR, S. Measuring service quality: A reexamination and extension. Journal of Marketing, v. 56, no 3, 1992, pp. 55–68. Disponível em: https://doi.org/10.2307/1252296. Acesso em: 12 de fev. de 2022.
DONABEDIAN, A. The seven pillars of quality. Arch Pathol Lab Med, 1990. Disponível em: https://edisciplinas.usp.br/pluginfile.php/2621255/mod_folder/content/0/DONABEDIAN_1 990.pdf?forcedownload=1. Acesso em: 24 de fev. de 2022.
ENSSLIN, L.; ROLIM ENSSLIN, S.; DE MORAES PINTO, H. Processo de Investigação e Análise Bibliométrica: Avaliação da Qualidade dos Serviços Bancários RAC. Revista de Administração Contemporânea, vol. 17, n. 3, maio-junho, 2013, p. 325-349. Disponível em: https://www.redalyc.org/pdf/840/84026305005.pdf. Acesso em: 27 de jan. de 2022.
LAS CASAS, A. L. Qualidade total em serviços: conceitos, exercícios e casos práticos. 6ª ed. São Paulo: Atlas, 2008.
MACHADO, G. V. C. et al. A visão do usuário em relação à qualidade do atendimento em um serviço de urgência. Revista Médica de Minas Gerais, [S.L.], v. 26, n. 1, p. 1-7, mar. 2016. Disponível em: http://rmmg.org/artigo/detalhes/2057. Acesso em: 24 de fev. de 2022.
MALLET, Ana Luisa Rocha. Qualidade em Saúde: tópicos para discussão. Revista da SOCERJ, [S.L.], v. 18, n. 5, p. 449 – 456, set/out. 2005. Disponível em: http://sociedades.cardiol.br/socerj/revista/2005_05/a2005_v18_n05_art08.pdf.
OLIVEIRA, O. J. Curso básico de Gestão da Qualidade. Cengage Learning, 2014.
SANTOS, I. E. Dos. Manual de métodos e técnicas de pesquisa científica. 9º ed. Rio de Janeiro: Impetus, 2013.
SCHMITT, B. H. Gestão da experiência do cliente: uma revolução no relacionamento com os consumidores. Porto Alegre: Bookman, 2004.
SILVA, V. K. G. da. Avaliação da qualidade do serviço público de saúde na Unidade de Pronto Atendimento (UPA) de Potengi. 2017. 92 f. Trabalho de Conclusão de Curso (Graduação em Administração), Departamento de Ciências Administrativas. Universidade Federal do Rio Grande do Norte, Natal, 2017. Disponível em: https://monografias.ufrn.br/jspui/bitstream/123456789/5107/1/ViviamKGS_Monografia.pdf.Acesso em: 14 de jan. de 2022.
SUÍÇA. Organização Mundial de Saúde. Aliança mundial para a segurança do paciente: diretrizes da OMS sobre higienização das mãos na assistência à saúde (versão preliminar avançada): resumo. 2005. 34 p. Disponível em: https://www.paho.org/bra/dmdocuments/manualparahigienizacao.pdf. Acesso em: 14 de fev. de 2022.
SZNELWAR, L. I. et al. Análise do trabalho e serviço de limpeza hospitalar: contribuições da ergonomia e da psicodinâmica do trabalho. Revista Produção. v. 14, n. 3, p. 045-057 , set./dez. 2004. Disponível em: https://doi.org/10.1590/S0103-6513200400030000 6. Acesso em: 14 de fev. de 2022.
TANAKA, O. Y.; TAMAKI, E. M. O papel da avaliação para a tomada de decisão na gestão de serviços de saúde. Ciência & Saúde Coletiva, [S.L.], v. 17, n. 4, p. 821-828, abr. 2012. Disponível em: https://www.scielo.br/j/csc/a/jPGmmcBncYzk36SvwvC3bzj/?lang=pt. Acesso em: 28 de fev. de 2022.
TIRONI, L. F. et aI. Critérios para Geração de Indicadores de Qualidade e Produtividade no Serviço Público. Ipea. Texto para discussão, no 238, 1991. Disponível em: https://www.ipea.gov.br/portal/index.php?option=com_content&view=article&id=3261. Acesso em: 27 de fev. de 2022.
WALDOW, V. R. Cuidar: expressão humanizadora da enfermagem. Petrópolis (RJ): Vozes, 2006.
APPENDIX – REFERENCE FOOTNOTE
3. Unidade de Pronto Atendimento (UPA).
4. Sistema Único de Saúde (SUS).
5. Avaliação para a Gestão de Serviços de Saúde (AGSS).
6. Link to access the questionnaire used in the research: https://docs.google.com/forms/d/1CPeLshrpJf3tuxED9M7w_WWtA_lVKbRzP4-7PsvOaBs/edit
7. Agência Nacional de Saúde (ANS).
[1] University graduate. ORCID: 0000-0001-8961-8533.
[2] University graduate. ORCID: 0000-0003-4600-5459.
Submitted: March, 2022.
Approved: April, 2022.