ORIGINAL ARTICLE
RIBEIRO, Fernando de Sá [1], JESUS, Jéssica Barbosa de [2], SOUZA, Alessandra Mendonça Teles de [3]
RIBEIRO, Fernando de Sá. JESUS, Jéssica Barbosa de. SOUZA, Alessandra Mendonça Teles de. Analysis and characterization of a promising therapeutic target identified in Leishmania spp. Revista Científica Multidisciplinar Núcleo do Conhecimento. Ano 05, Ed. 05, Vol. 09, pp. 99-132. Maio de 2020. ISSN: 2448-0959, Access link: https://www.nucleodoconhecimento.com.br/health/target-therapeutic, DOI: 10.32749/nucleodoconhecimento.com.br/health/target-therapeutic
SUMMARY
Leishmaniasis is a neglected disease caused by protozoa of the genus Leishmania spp., which affects about 1.6 million individuals each year and 500,000 present themselves in the visceral form. In Brazil there are about 30,000 new cases each year. In addition, the country is responsible for 90% of reported cases of Visceral Leishmaniasis, and this is more severe form of the disease. Allied to these facts, the current treatment is ineffective, contributing to the establishment of resistant strains. Currently, the treatment has several side effects and permanent damage to the health of patients, this fact has contributed to the search for new drugs against leishmaniasis. The enzyme oligopeptidase B (OPB) has been studied as a possible therapeutic target in the development of antiparasitic agents. Thus, the objective of this work is to construct the three-dimensional model of the enzyme Oligopeptidase B of different species of Leishmania spp. and compare them to each other. For this purpose, the comparative modeling method was used. In this method, the models of the species L. brasiliensis, L. donovani, L. infantum, L. mexicana and L. panamensis were constructed using the MODELLER program. Once the models were ready, the validation process was carried out and subsequently characterized, which was possible to verify a promising degree of similarity between the models. Finally, these models were submitted to the method of analysis by normal modes, which obtained a similar movement pattern, thus it was possible to verify a movement in a specific region of an alpha-helix, consequently leading to the triad of the enzyme being exposed, which may be indicative of a mechanism of action. Finally, it is expected to use the models built to assist in the development of a promising new therapy for the treatment of leishmaniasis.
Keywords: Leishmaniasis, oligopeptidase B, molecular modeling, normal modes.
INTRODUCTION
Leishmaniasis, caused by leishmania spp., is a disease characterized by several types of manifestations, from mild, in which there are reports of small lesions that even without due treatment regress to the most severe ones such as Visceral Leishmaniasis (VL). In Brazil, the most severe form of this disease presents alarming data compared to other countries, making the country the largest holder of VL cases in all of America (ALVARENGA, 2010; WHO, 2019).
This disease belongs to the group of neglected diseases, which are part of all those diseases that mainly affect underdeveloped countries and poorer regions, so that it does not arouse interest in the development of medicines. Therefore, it is necessary that efficient and low-cost techniques survive to overcome this lack of financial incentives for the study of this disease. Thus, computational methods can be used in order to reduce the time in the development of a promising new therapy and consequently the cost compared to more traditional methods for drug development (BAILEY et al., 2017; WHO, 2017).
Despite the little investment in this area, there is treatment for the disease such as the antimonial pentas valentes (drug of first choice) or amphotericin B (drug of second choice). However, such treatments have several disadvantages such as the high resistance rate and the wide variety of side effects, ranging from seasickness to possible problems caused to the third (3rd) pair of the cranial nerve, leading to motor difficulties (MACEDO-SILVA et al., 2014).
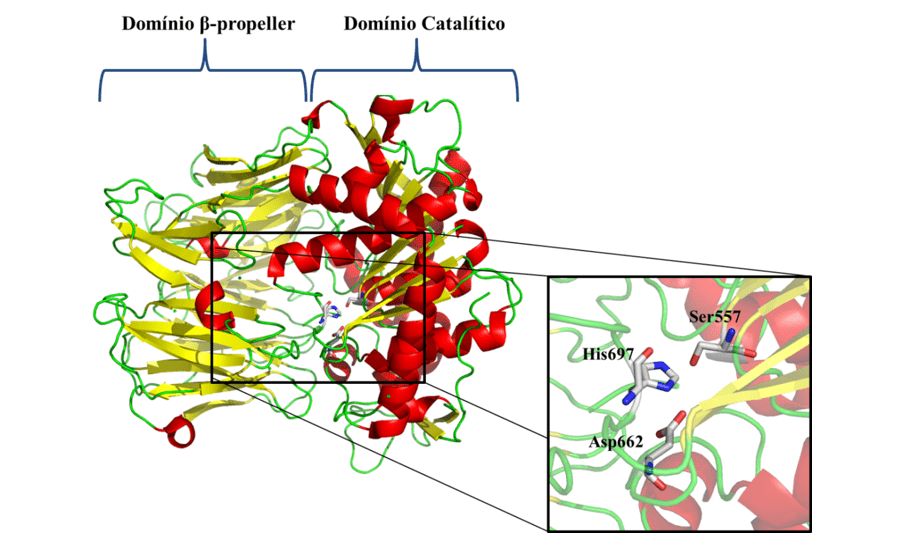
In view of the problems presented and the epidemiological importance of leishmaniasis, the need for the investigation of new specific therapeutic targets against the disease is notorious. As one of the new therapeutic targets, we have Oligopeptidase B (OPB) (Figure 1), which is a serine protease, belonging to the subfamily S9A, having as characteristic a catalytic triad composed of the residues of amino acids serine (Ser), asaptic acid (Asp) and histidine (His) that are located between the two domains. This enzyme has as characteristic the ability to cleave residues of protein structures. In addition, it is described in the literature as a key component for the immune escape mechanism of the parasite, cleaving enolase, a protein that will opsonisar the protozoan, so that when recognized by the macrophage it is destroyed. However, while the parasite is inside the macrophage, the OPB is super expressed, causing the parasite not to be recognized within the cell, so it will multiply until it is smoothed (SODERO et al., 2016; SWENERTON et al., 2011; OVCHINNIKOVA et al. 2018).
Figure 1: Three-dimensional structure of L. major OPB (PDB code 2XE4) (MCLUSKEY et al., 2010) showing the catalytic and β-propeller domains. Secondary structures such as α-helix, β-leaves, and handles are shown in red, yellow, and green, respectively. In particular, the residues (Ser557, Asp662 and His697) of the catalytic triad are shown.
Therefore, the study in question aimed to investigate and characterize the OPBs and their active sites, of the species L. brasiliensis, L, donovani, L. infantum, L. mexicana and L. panamensis. Finally, it was expected to identify possible similarities between proteins, so that it would enable the future development of a promising new therapy with a broad spectrum of action on enzymes of all species in the study.
GENERAL OBJECTIVE
In view of the need for the development of new chemical entities for the treatment against leishmaniasis, this work had as main objective to build and characterize the enzyme oligopeptidase B of Leishmania spp. using computational study techniques.
SPECIFIC OBJECTIVES
- To construct and validate the models of oligopeptidase B enzymes of Leishmania species;
- Perform the characterization of enzymes;
- Perform simulation studies by normal modes.
MATERIAL AND METHODS
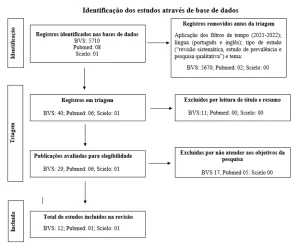
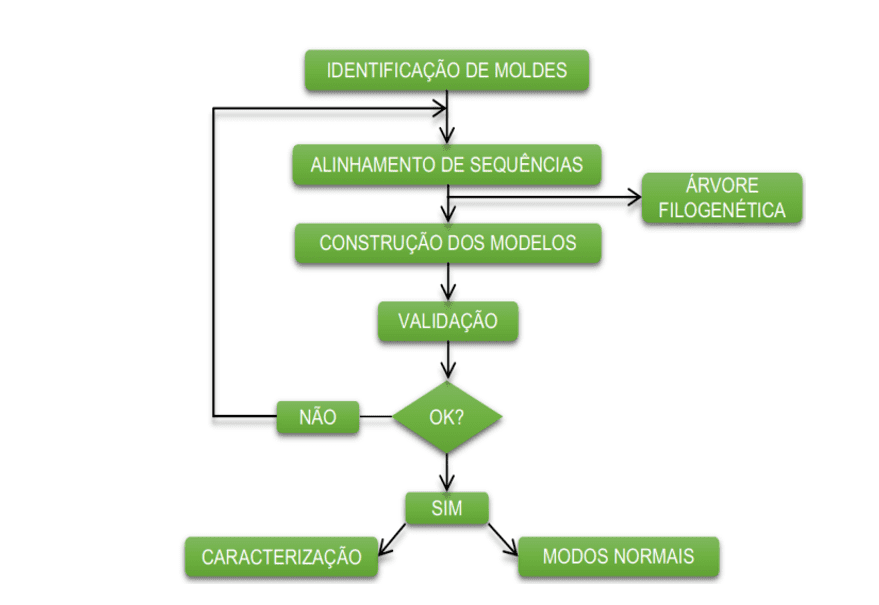
The diagram below (diagram 1) shows in a simplified way the steps used during the development of this work.
Schema 1: Simplified schema of material steps and methods.
OBTAINING THE PRIMARY STRUCTURE
The primary structures of Leishmanias OPBs were obtained from the Uniprot database (The Universal Protein Resource) (WANG et al., 2012).
MOLD ID
Then, the search for mold proteins was performed from the alignment between the amino acid sequence of the target protein and amino acid sequences of proteins deposited in the Protein Data Bank (PDB) by the BLAST server (Basic Local Alignment Search Tool) (ATLSCHUL et al., 1997) based on the identity between amino acid sequences.
ALIGNMENT OF SEQUENCES
Once the mold to be used was defined, the mold sequence was aligned with their respective OPBs, in the ClustalOmega program (ClustaO) (SIEVERS et al., 2011).
MODEL CONSTRUCTION
After obtaining the alignment, this information was used in the MODELLER v9.20 program to construct the 3D structures of the models (WEBB and SALI, 2016).
VALIDATION OF BUILT MODELS
For the validation of the models, the Ramachandran graph generated by the PDBsum, Verify 3D and ProSA-web server was used, all obtained from the Saves server.
In the analysis of the Ramachandran graph, it is permissible to visualize the dihedral angles (phi (ψ) and psi (φ)) of amino acid residues in protein structure. The phi angle (ψ) is the result of the link between the NH group and alpha carbon, while the psi angle (φ) originates from the link between alpha carbon and the carbonyl group (RAMACHANDRAN et al., 1963).
The graph provides an easy way to visualize the distribution of the torm angles of a protein structure. In addition, it provides an overview of the allowed and not allowed regions of the torm angle values, serving as an important factor in assessing the quality of 3D protein structures. With this, it defines the residues that are found in the regions that are energetically more favorable and unfavorable and guides the evaluation of the quality of theoretical or experimental models of proteins. This graph is divided into regions, so that the most favorable regions are in red, additional regions more permissive in brown, permissive regions in yellow and non-permissive regions in white. According to this validation for a predicted model to be considered of excellent quality, it must have more than 90% of amino acid residues in the most favorable region (SANTOS-FILHO and ALENCASTRO, 2003).
In addition, it needs to have the majority of its residues in the most favorable regions, as well as not having residues in the non-permissive regions, except the amino acids glycine (Gly) and proline (Pro) that are exceptions for this area. These two residues present variations in the lateral chain that confer greater rigidity, in the case of Pro, and greater flexibility, in the case of Gly, thus being can assume unexpected angulations. For this reason they are accepted in the non-permissive regions of the chart. The existence of the regions not allowed is due to the fact that there are steric effects among the residues (side chains) of amino acids. (MORRIS et al., 1992).
Verify 3D analyzes the compatibility of an atomic (3D) model with its own amino acid (1D) sequence. Each residue receives a structural class based on its location and environment (alpha, beta, loop, polar, apolar, etc.). Soon after, a database generated from good structures is used to get a score for each of the 20 amino acids in this structural class. The vertical axis on the graph represents the mean score of the 3D-1D profile for each residual in a sliding window of 21 residuals and the results in the form of scores range from -1 (poor score) to +1 (good score) (EISENBERG et al., 1997).
ProSa-web calculates an overall quality score for a specific input structure. If the score of this is outside a range characteristic for native proteins, the structure probably contains errors. A lot of local quality scores point to problematic parts of the model that are also highlighted in a 3D molecule viewer for easy detection (WIEDERSTEIN and SIPPL, 2007).
ANALYSIS OF THE SECONDARY STRUCTURE
After the validation stage, the tertiary structures of the models were compared with the distribution of the secondary structure predicted by Quick2D, available on the Bioinformatics Toolkit server (https://toolkit.tuebingen.mpg.de/), thus choosing the models (ALVA et al., 2016).
CHARACTERIZATION OF OLIGOPEPTIDASES (OPBS) OF LEISHMANIAS
ELECTROSTATIC POTENTIAL MAP (MEP)
To obtain the MEPs of the surfaces and the sites of connection of the OPBs, an extension of the PyMOL program, apb tools (BAKER et al., 2001) was used. Before being analyzed in PyMOL, the enzymes were prepared in the PDB2PQR Server (http://nbcr-222.ucsd.edu/pdb2pqr_2.0.0/) using the standard server parameter (DOLINSKY et al., 2004).
CHARACTERIZATION OF OPBS SITES AND SUBSITES
The models and the mold were submitted in the proteins plus platform using the Dogsitescorer option (VOLKAMER et al., 2012), in which cavities were predicted in the 3D structures of the models. This generated results regarding possible binding sites and enzyme subsites for the prediction of these cavities. The program makes use of a three-dimensional mesh whose edge can be adjusted between 0.2 Å and 1.0 Å, along with a Gaussian filter that is used to identify cavities on the surface of the protein that are suitable to accommodate ligand atoms. In addition, DoGSiteScorer also predicts drugability for each predicted cavity. Thus, for each interaction between protein and the possible drug, a score referring to cavity drugability, called drugscore, is assigned. To predict the value of drugscore, the program uses a support vector machine (SVM), in which the following descriptors are used: volume, proportion of nonpolar residues and depth (VOLKAMER et al., 2012).
PHYLOGENETIC TREE
Finally, the degree of evolutionary kinship between Leishmanias species was analyzed using the MEGA (Molecular evulutionary genetics analysis) program, using the Neighbor-joining methods, which allows the construction of the phylogenetic tree in order to define the evolutionary proximities between populations of sequences previously defined by the user (KUMAR et al., 2004).
NORMAL MODES
To perform the normal modes, the files generated in the stages of energy minimizações made by GROMACs version 5.1.2 were used. The first 4 steps related to the molecular dynamics process were performed. The first was the generation of topology files, with the addition of hydrogens to the protein. In the second, the water box was created, and this is a very important step for the calculation of the interaction between the protein and the solvent. In the third, ions were added to establish a neutral system. Finally, in the fourth stage, energy minimizations were performed, in which the AMBER99SB force field was inserted. From this point on, the normal modes of the models were performed using the ANM (Anisotropic Network Model) (http://anm.csb.pitt.edu/) server in order to analyze the movement of enzymes of Leishmania species and also to observe some important characteristics for enzyme, such as possible movements related to the mechanism of action (EYAL et al., 2015).
RESULTS AND DISCUSSIONS
SELECTION OF MOLD PROTEINS AND ALIGNMENT BETWEEN SEQUENCES
We obtained 100 primary structures of the OPBs of leishmania spp. using the UniProt server, with 5 species of Leishmanias selected. The revised amino acid sequences selected from the OPB enzyme were L.brasiliensis, L. donovani, L. infantum, L. mexicana and L. panamensis under the codes A4H5Q8, C9EF60, A4HTZ8, E9AMS8 and A0A088RJA7, respectively These species were selected, due to their high incidence in South America and their resistance against current treatment for leishmaniasis (GHORBANI and FARHOUDI, 2018).
For the construction of 3D models, the BLAST program was used to compare the amino acid sequences of the target sequences with protein sequences of experimentally elucidated three-dimensional structures. Based on the identity between the sequences and the number of gaps, the ENZYME OPB of L. major (code PDB 2XE4) was selected as a mold protein (MCLUSKEY et al., 2010). The identity between the target enzymes and their respective mold presented values between 86% and 96% (Table 1). The percentage of identity between two sequences refers to the presence of the same amino acid in the same position between the aligned sequences. For the construction of a model of a protein with more than 80 amino acid residues, the percentage of identity between the primary structures of the mold and the model should be above 25%. In addition, the percentage of gaps must be low of 20% to be considered a good alignment (SANTOS-FILHO and ALENCASTRO, 2003). Thus, the probability of similarity of the three-dimensional structures of proteins is high.
Table 1: Percentage of identity between the models of oligopeptity B of Leishmania species and their respective mold.
| Proteína molde (código PDB) | Modelos de OPB
(código uniprot) |
Identidade (%) | Gaps (%) |
| OPB
L. major (código PDB 2XE4) |
L.brasiliensis
(A4H5Q8) |
86 | 0 |
| L. donovani
(C9EF60) |
96 | 0 | |
| L. infantum
(A4HTZ8) |
96 | 0 | |
| L. Mexicana
(E9AMS8) |
90 | 0 | |
| L. panamensis
(A0A088RJA7) |
86 | 0 |
Source: Authoral.
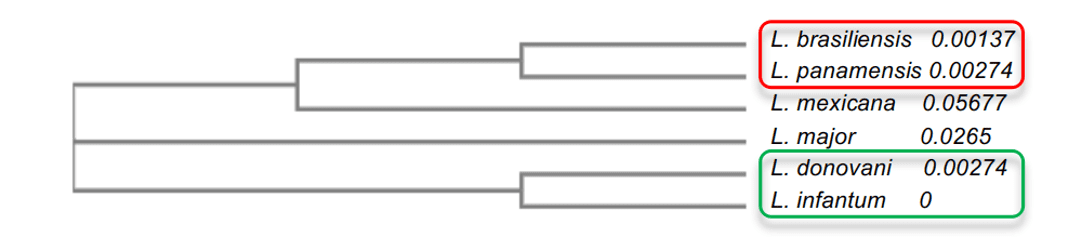
In the phylogenetic tree analysis, it was possible to explain the degree of identity among leishmania species. It was observed that the species with higher degree of identity, such as L. infantum and L. donovani, both with 96%, presented a proximity to each other, besides being closer to L.major. The other species presented lower values such as L.mexicana (90%), which was in the median in relation to the other models. Finally, the models with the lowest percentage of identity, L. brasiliensis and L. panamensis, both with 86%, were more distant evolutionarily from their mold, but were very close to each other (Figure 2). This analysis allowed the understanding of the difference between the degree of identity between species and the understanding of some important characteristics of the enzyme among the species.
Figure 2: Phylogenetic tree scheme of Leishmania spp. OPBs enzymes. In this representation, the groups with the highest similarity to each other are evidenced, where group 1 is highlighted in red and group 2 in green.
THREE-DIMENSIONAL MODELS OF THE ENZYME OF LEISHMANIA SPECIES
The 3D models of the species were constructed using the Modeller program (WEBB and SALI, 2016) from the alignment of the primary structures (figure 3 and 4).
Figure 3: Result of alignment between the primary sequences of the OPBs selected in UNIPROT (Part 1/2).
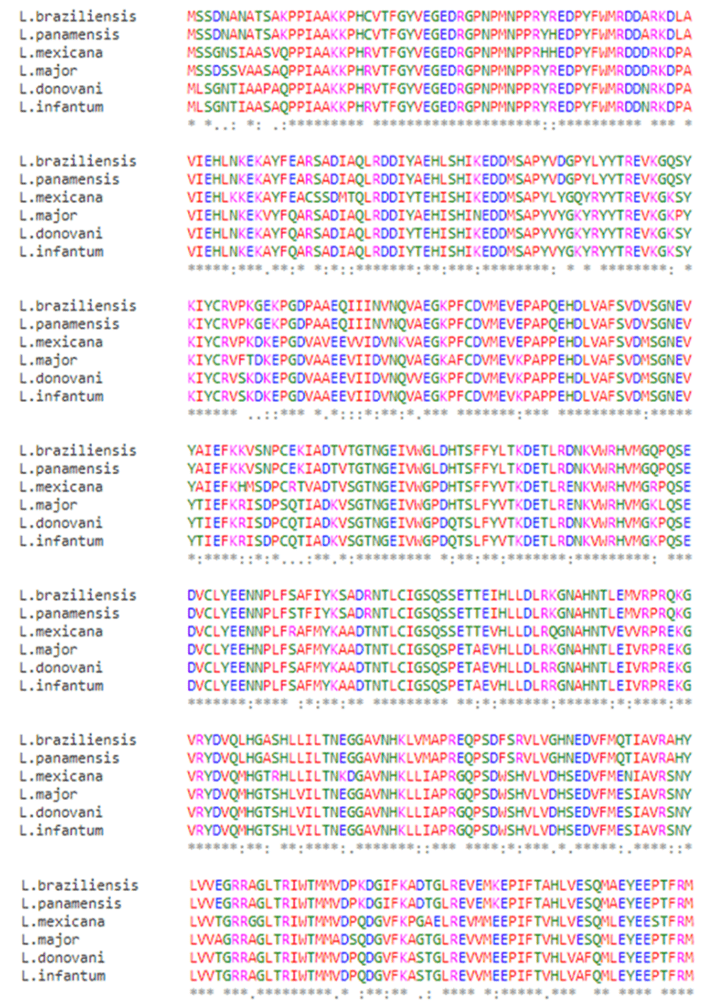
Figure 4: Result of alignment between the primary sequences of the OPBs selected in UNIPROT (Part 2/2).
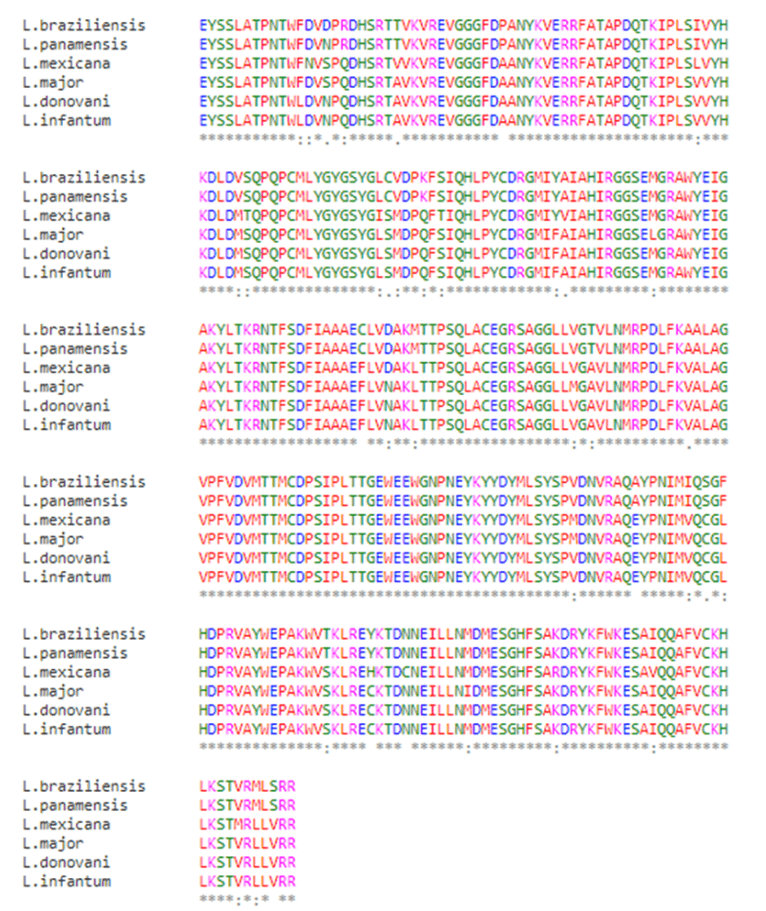
When observing the result of the alignment of the structures (Figures 3 and 4), a higher degree of similarity was observed between L. donovani and L. infantum (group 2) as well as a greater correspondence between L. brasiliensis and L. panamensis (group 1). These results reinforce what was presented by the phylogenetic tree in Figure 2, where it is suggested a proximity between the species, L. donovani and L. infantum and another proximity between the species of L. brasiliensis and L. panamensis. On the other hand, the two groups mentioned presented a greater evolutionary distance when compared to each other. This fact is notorious when a comparison is made in the alignment analysis, where the primary structures showed a greater difference between the residues, when compared to the two groups. Moreover, the result of the alignment of L. mexicana proved to be very promising, which refers to the support of this proposed discussion, since the differences observed in comparison with the other species were equivalent, sometimes to the first group mentioned, sometimes to the second. In some parts of the analyzed sequence, specific mutations that are characteristic only of L. mexicana were also observed in some parts of the analyzed sequence. Thus, this fact can be attested due to its position in the median in the phylogenetic tree, in relation to the other species.
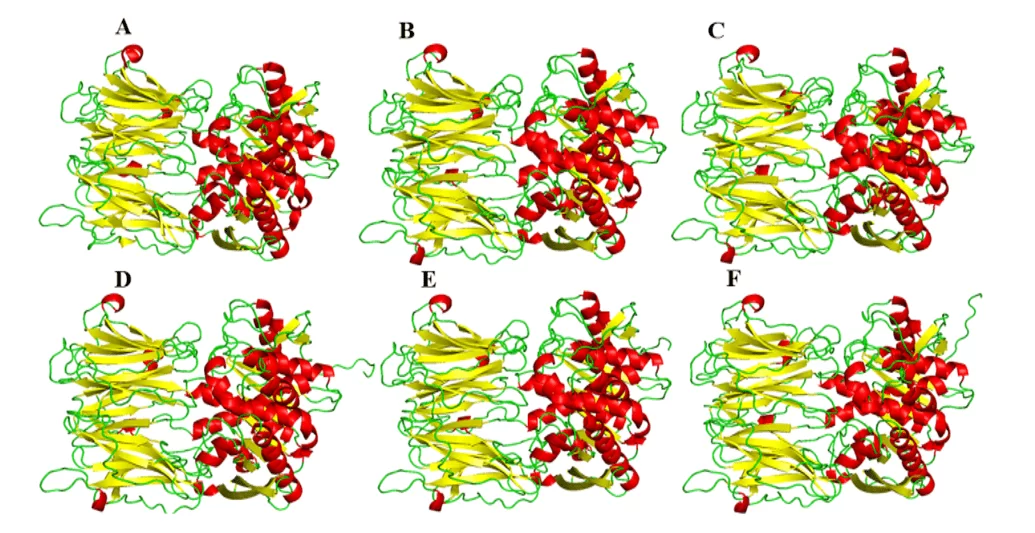
As a result of the comparative modeling, the models of the present study were obtained, which suggested a great visual similarity in its three-dimensional shape in relation to the mold (Figure 5). Regarding the comparison between the models, they presented different amounts in the α-helix and leaf-β structures among themselves. This difference can be explained by the specific differences in the composition of protein residues, but such differences did not present in important regions of these enzymes, such as the binding site. Therefore, these differences are not so important as to modify the structures or the profile of interaction with a possible drug at the binding site.
Figure 5: Models and mold of the OPBs of leishmania spp., being evidenced in red the α-helixes, green the handles and yellow the leaves-β. Para OPB, (A) L.major (molde) e modelos: (B) L. brasiliensis, (C) L. donovani, (D) L. infantum, (E) L. mexicana e (F) L. panamensis.
In the validation stage, they were analyzed based on ramachandran graph analysis (provided by PDBsum server), 3D-1D score (provided by verify-3D program) and score-Z (provided by ProSA-web server). The values obtained for the models were compared to those obtained for the mold.
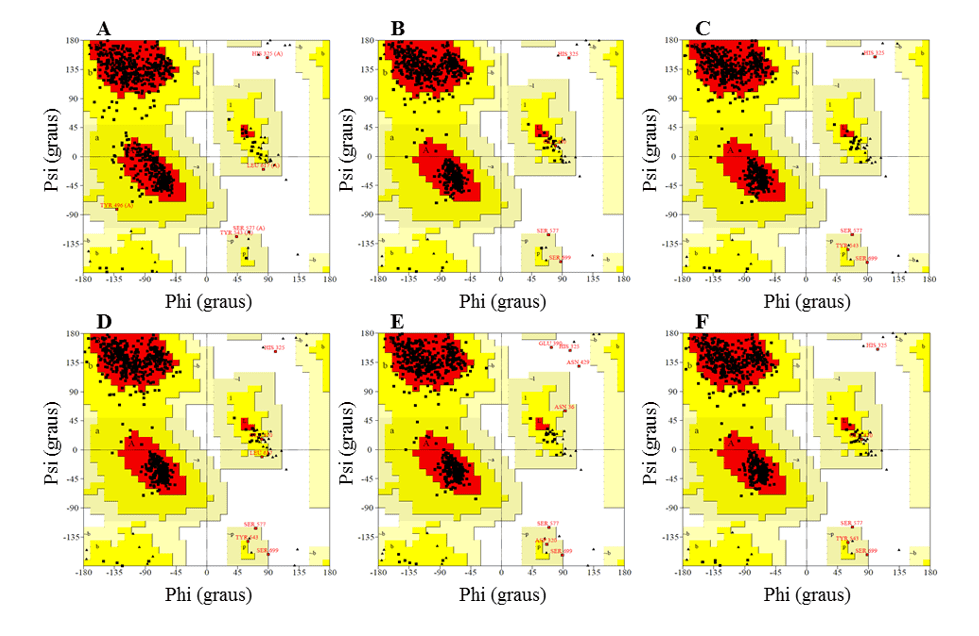
In the Ramachandran graph, the models presented the majority of residues in the favorable regions, ranging between 91.2 and 92.3%, while the percentage of residues in unfavorable regions was a maximum of 0.5%, and the best models were L.infantum and L.brasilienses. These models presented the highest number of residues in favorable regions with 92.3% and 92.2% and the lowest percentage of residues in unfavorable regions with 0.3% and 0.2%, respectively (Figure 6).
In all models it was possible to observe that the Ser residue, which is part of the catalytic triad, was in the unfavorable regions. However, this fact does not affect the validity of the models, since when comparing the mold presented the same result. Therefore, this result does not configure a low reliability of the models.
Figure 6: Results of ramachandran graphs, obtained by the PROCHECK program, the structures of the generated OPBs models, and the mold.
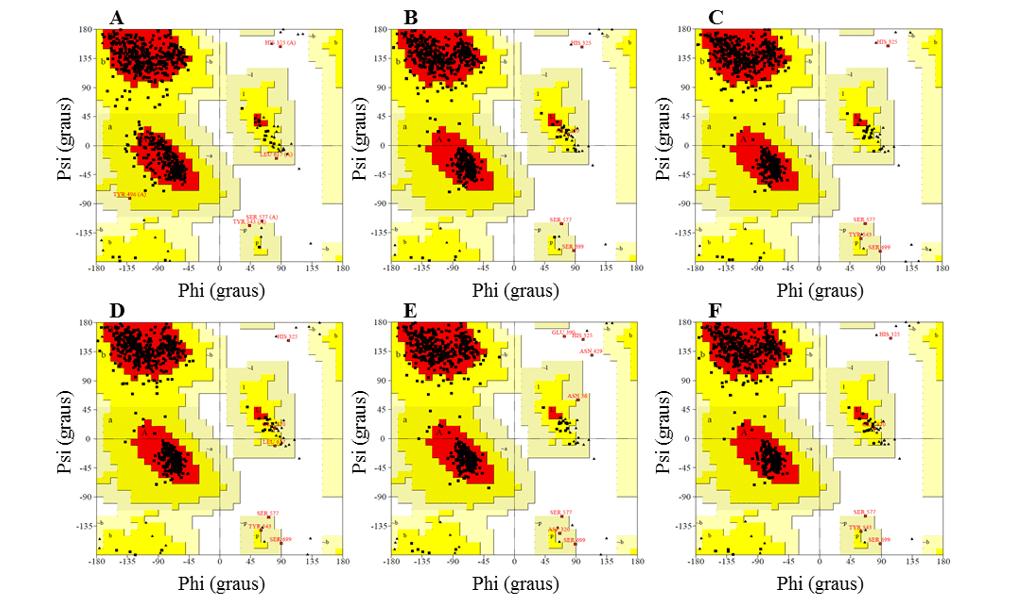
| Structures | % waste in regions | ||||
| Favorable | Allowed | Unfavorable | |||
| OLIGOPEPTIDASE B | L. major (A)
(PDB 2XE4) |
90,2 | 9,5 | 0,3 | |
| L.brasilienses (B) | 92,2 | 7,7 | 0,2 | ||
| L. donovani (C) | 91,9 | 8,0 | 0,2 | ||
| L. infantum (D) | 92,3 | 7,3 | 0,3 | ||
| L. Mexicana (E) | 91,2 | 8,3 | 0,5 | ||
| L. panamensis (F) | 91,4 | 8,3 | 0,3 | ||
Source: Prepared by the author based on procheck results.
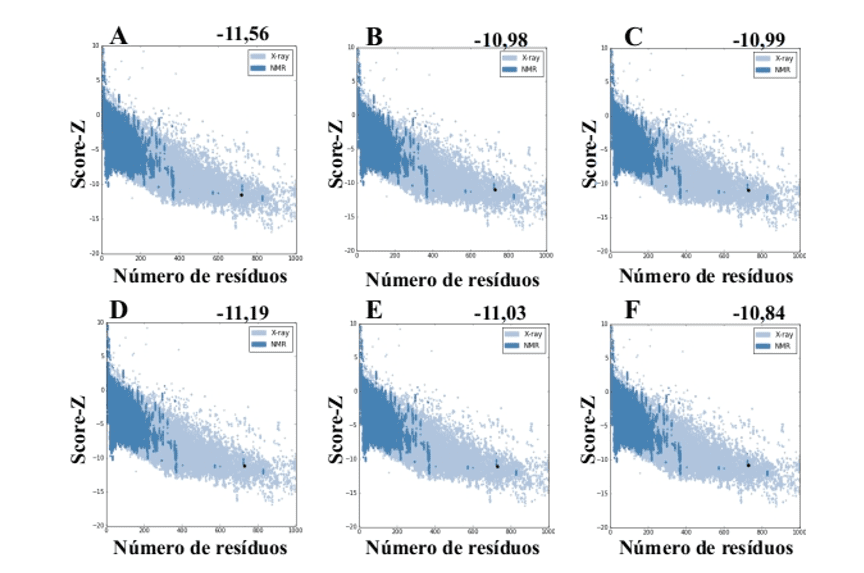
When using the ProSA-web server from the models generated by MODELLER, they presented values of score-Z -10.84 to -11.19 and these values are compatible with PDB structures (Figure 7).
Figure 7: Z-score results calculated on the ProSA-web server of the mold structures (for comparison). (A) L .major (molde) e modelos: (B) L. brasilienses (C) L. donovani (D) L. infantum (E) L. mexicana (F) L. panamensis. The region in dark blue indicates the score of the proteins obtained by NMR and in light blue of the proteins obtained by X-ray diffraction.
The Verify 3D program was used to evaluate the compatibility between 1D and 3D structures. The obtained models presented 95.28% to 98.34% of amino acids with 3D-1D> compatibility 0.2, and the L. donovani and L.brasilienses models obtained better results. According to the ideal parameters of the program, most residues should present values above zero, since values below zero indicate regions of the molecule with problems. The percentage of amino acids with 3D-1D> compatibility 0.2 must be above 80% (EISENBERG et al., 1997). Thus, these results indicate that the models presented 1D-3D compatibility, and the residues that presented incompatibility are not part of the active site of the enzymes (Table 2).
Table 2: Results of Verify 3D, showing the percentage of residuals with score > 0.2.
| Estruturas | % de resíduos com score > 0,2 | |
| OLIGOPEPTIDASE B | L.major
(PDB 2XE4) |
93,20 |
| L.brasilienses | 95,62 | |
| L.donovani | 97,12 | |
| L.infantum | 94,93 | |
| L.mexicana | 95,62 | |
| L.panamensis | 94,93 |
Source: Authoral.
VALIDATION OF THE CATALYTIC TRIAD OF THE ENZYME OF THE MODELS
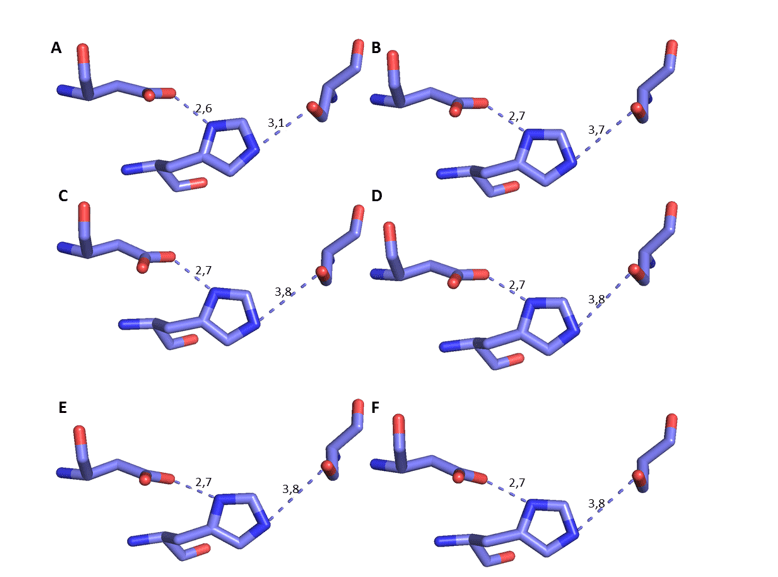
Due to the mechanism of PB, it is essential to analyze the distance and orientation between amino acid residues and the catalytic triad (Ser, Asp and His) of the generated models in order to increase the reliability of the models.
It is possible to observe the comparison of these specific residues of the OPB models with the mold in question in Figure 17. In addition, it was possible to measure the distance between the residues of the catalytic triad, based on the mechanism of interaction between the site and the substrate, with His as reference (DEREWENDA et al. , 1994). Therefore, there must be a specific distance to the mechanism of action. This distance should be about 3.5Å between his oxygen and Ser nitrogen, in addition to the distance of approximately 2.6Å between aspartate oxygen and his other nitrogen, as described in the literature (DEREWENDA et al. , 1994). In this analysis, it was possible to verify that the distance in question underwent a small variation, and is still in accordance with what has already been described. This distance is important because serino proteases require his for substrate cleavage to occur (HEDSTROM, 2002) (Figure 8). Based on these reliable results, further characterization of the models was continued.
Figure 8: 3D representation of the catalytic triad of THE OPBs, respectively, Ser, His and Asp. The dark blue color represents the nitrogen atom, the red oxygen and the lilac carbon. Para OPB, (A) L.major (molde)e modelos: (B) L. brasilienses (C) L. donovani (D) L. infantum (E) L. mexicana (F) L. panamensis.
CHARACTERIZATION OF OLIGOPEPTIDASES OF LEISHMANIAS
PREDICTION SECONDARY STRUCTURE
From the prediction of the secondary structure of OPBs enzymes, the number and position of the secondary structures of the models were revealed. The PSISPRED presented between 15 and 16 α-helix structures and all presented 38 pairs of β-leaves (Table 3). From the results generated by PSIPRED, a visual comparison of this predicted secondary structure with the three-dimensional structures of the 5 models was performed, using the Pymol program. The models of L.brasilienses, and L. panamensis presented the best similarity, in relation to the secondary and tertiary predicted structures (2D-3D), presenting 15 α-helixes and 38 β-leaves. Of the 15 α-propellers presented in the three-dimensional structure of model 8 of the α-propellers were in the same position as predicted by the PSIPRED. These helixes correspond to the amino acid sequence: 59 to 74, 78 to 93, 535 to 540, 545 to 563, 631 to 640, 703 to 721 and 727 to 730.
In the general analysis, there was no exacerbated difference in the amounts of α-helix and β leaves between the predictions and the models obtained (Table 3).
Table 3: Comparison between the secondary structures predicted by psipred and that found through Pymol.
| Modelos | α-Hélices | Folhas β | PSIPRED
α-Hélices |
PSIPRED
Folhas β |
| L.brasiliensis | 15 | 38 | 11 | 36 |
| L. donovani | 16 | 38 | 11 | 36 |
| L. infantum | 16 | 38 | 11 | 36 |
| L. mexicana | 15 | 38 | 10 | 36 |
| L. panamensis | 15 | 38 | 11 | 36 |
Source: Authoral.
Moreover, it was possible to observe that the amount of 15 α-Propellers was the same for L.brasilienses, L. Mexicana and L. panamensis. Just like L.infantum and L.donovani, they got the number 16 α-Helix. According to the phylogenetic tree, these two groups mentioned are in the same internal node and are considered monophyletic (Figure 2).
Then, the RMSD (root-mean-square deviation) was performed between the models and the mold. The values were promising, as can be seen in Table 4, because the RMSDs did not exceed the value of 0.19 Å. This finding can be justified by the high degree of identity between the mold and the respective models. In general, it is expected that proteins with an identity greater than 30%, have excellent overlap of the main chains, thus obtaining an RMSD of the order of 2Å (BENNER et al., 1997 ; CHOTHIA et al., 1986).
Table 4: RMSDs of the OPBs generated by the Modeller, having with orientation the alpha carbons of the OPB mold of L. major.
| Molde | Modelos | RMSD (Å) |
| L. major
(2XE4) |
L.brasiliensis | 0,15 |
| L. donovani | 0,15 | |
| L. infantum | 0,16 | |
| L. Mexicana | 0,19 | |
| L. panamensis | 0,14 |
Source: Authoral.
MAP OF MOLECULAR ELECTROSTATIC POTENTIAL (MEP) OF THE SURFACE OF ENZYMES AND RECEPTIVE SITES
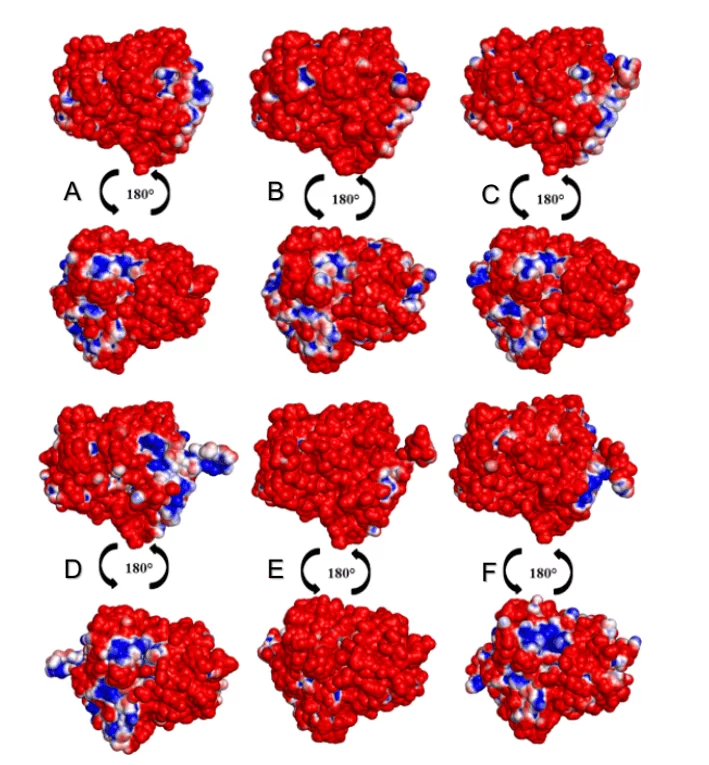
In the analysis of the MEPs of the surfaces of the OPBs, it was possible to observe that all leishmania species presented a higher percentage of negative than positive regions as shown in Figure 15. The species L. donovani and L. infantum (green group) suggested a negative area (in blue color) in the same region. The species L.brasilienses and L. panamensis (red group) presented a similar negative region, in a similar colorimetric pattern. Both results can be justified by the fact that the species compared to each other belong to the same monophyletic (Figure 2).
Figure 9: Map of the electrostatic potential of the 3D models of Leishmania spp OPBs and that of their mold. Para OPB, (A) L.major (molde) e modelos: (B) L. brasilienses (C) L. donovani, (D) L. infantum, (E) L. mexicana (F) L. panamensis. In the blue color it presents the positive region and in the red color, the negative region.
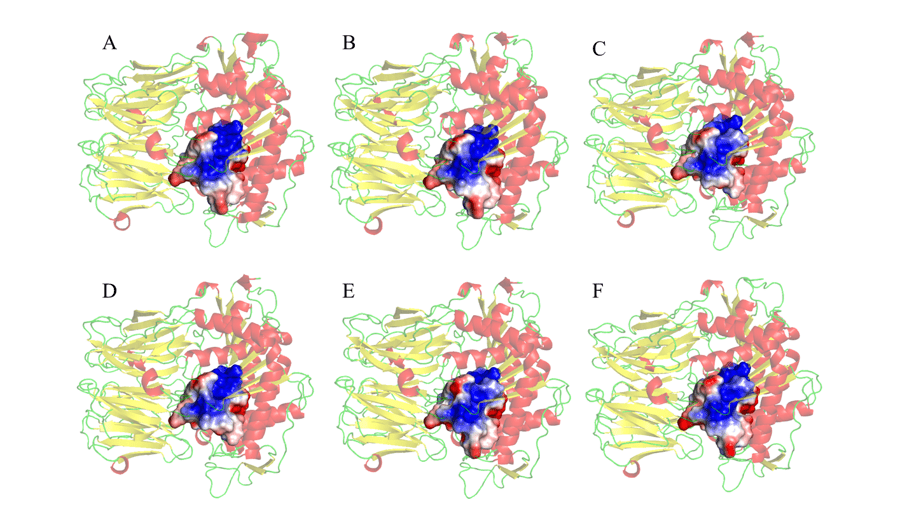
Finally, the MEP of the residues was also performed at a radius of 5 Å around the catalytic triad, as shown in Figure 10. The choice to observe the MEP of the region around the catalytic triad was because this is the second region of interaction between the enzyme and the substrate, in which there will be accommodation (ANDERSSON et al., 2010). Thus, in view of one of the objectives of the study, it was possible to verify significant similarities and correspondences between the mold and the tested models. These results, as shown in Figure 10, revealed mainly a larger electropositive portion (in blue) in the central region of the connection sites. Negative regions (in red) were observed in peripheral areas of the MEPs studied. These results are promising, as it was found that these regions are fully similar in all models, and may help in the development of a drug that has the ability to act specifically in all models studied.
Figure 10: Representation of the potential map of the electrostatic surface of amino acid residues, 5Å around the catalytic triad that make up the active site of the enzyme. (A) L.major (molde) e modelos: (B) L. brasilienses (C) L. donovani (D) L. infantum (E) L. mexicana (F) L. panamensis. In red are the α-helixes, green the handles and yellow the leaves-β. In the golden color the binding site. In the blue color it presents the positive region and in the red color, the negative region.
DOGSITESCORER, CALIFORNIA
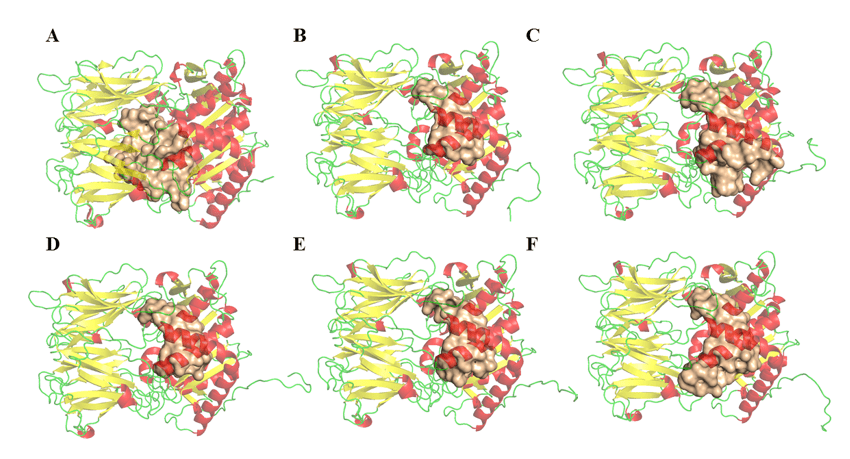
The determination of the volume, area and depth parameters of the possible binding sites of opb enzymes of Leishmania species was performed in the DoGSiteScorer (http://poseview.zbh.uni-hamburg.de/) program of ProteinsPlus – Structure-Based Modeling Support Server (VOLKAMER et al., 2012). The program points out three link sites as described in the literature. Figure 11 shows the comparison between the possible region of the active site and its differences. These variables among THE OPBs may be related to residues that are not described as important for their inhibition, but were considered during this analysis. Thus, this result does not rule out the possibility of antipain or any other molecule having a broad spectrum of inhibition on the enzyme, due to the fact that the results related to drugscore were very similar and positive in all regions. Table 5 is observed, a relative discrepancy between the volume and area results of the cavities found in the models. This result does not suggest a bias of doubt about the inhibitory potential of a single drug in the respective enzymes. However, it pays attention to the fact that some proteins have larger cavities than others. However, these same cavities have points in common, and these are the residues that make up the catalytic site, as can be seen in Figure 11 and can be explored.
Table 5: Values referring to the possible connection regions of the OPBs (obtained by the server).
| Estruturas | DogSiteScoore | |||
| Volume | Área | Drug Score | ||
| OLIGOPEPTIDASE B | L. major
(PDB 2XE4) |
1690,62 | 1818,41 | 0,80 |
| L.brasiliensis | 1527,84 | 1766,63 | 0,80 | |
| L. donovani | 1074,57 | 1428,55 | 0,79 | |
| L. infantum | 1309,97 | 1572,19 | 0,80 | |
| L. mexicana | 800,92 | 799,38 | 0,85 | |
| L. panamensis | 971,96 | 1083,40 | 0,81 | |
Source: Authoral.
Figure 11: OPBs structures and possible connection regions (obtained by the DogSite server). (A) L .major (molde)e modelos: (B) L. brasilienses, (C), L. donovani, (D) L. infantum, (E) L. mexicana e (F) L. panamensis. In red are the α-helixes, green the handles and yellow the leaves-β. In the golden color the binding site.
NORMAL MODES
After the characterization of the enzyme in the structural, superficial and binding sites, the normal modes for the enzymes of each species were performed with the purpose of their respective movements.
After relaxation and energy minimizações performed by molecular dynamics in GROMACS, these structures were submitted to normal analyses in order to observe possible compatible movements.
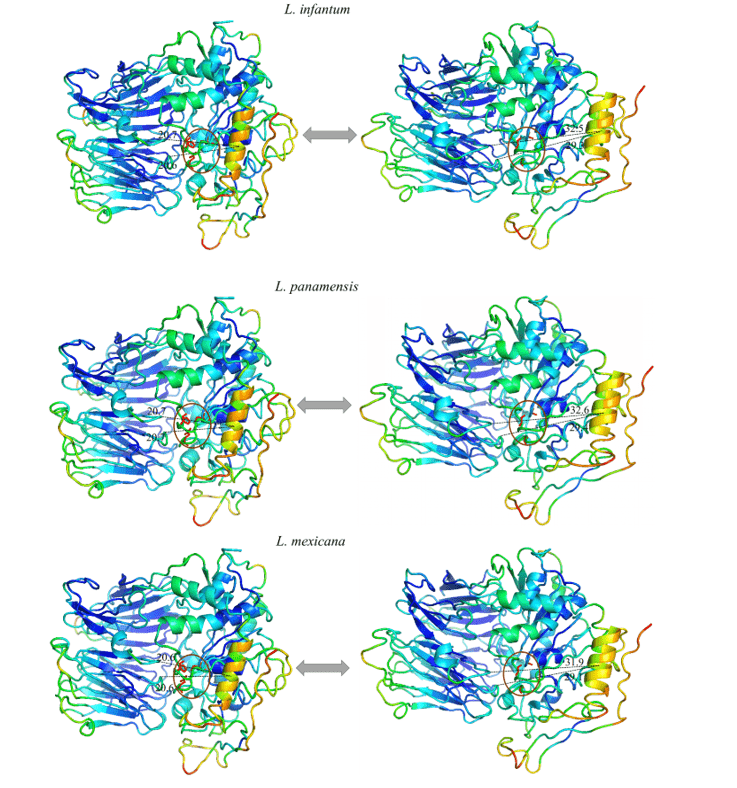
It was possible to observe in all models studied an expressive movement of a specific helix α, and when analyzing this region in its amino acid composition it is possible to notice that it is highly conserved. Thus, the movement pattern was repeated in all models in question. This region suggested a linear movement moving away from the center towards the periphery, exposing the catalytic triad. This may be indicative of the movement performed by the protein for the accommodation of the substrate.
When observing figure 12 and 13, the same color pattern can be observed in all models of the study. This data represents the ability given region has to move in a certain direction. The blue colors represent more invariable regions during the simulation by normal modes, with this, a pattern of stiffness in the proteins is noticeable corresponding mainly to the β-leaves of the β-propeller domain and some α-helixes that make up the catalytic domain. Colors close to green represent intermediate regions in relation to capacity and range of motion. Based on this information, it is possible to perceive this staining present in loops at the ends of the models as well as in some α-helixes of the catalytic domain. Finally, there are those regions that presented an orange/red coloration, in which is the representation of a huge movement potential. Thus, it can be seen that there are small regions of loops at the ends of the catalytic domains with this movement potential, as well as an α-helix located in the portion of the catalytic domain, more specifically in front of the catalytic triad of the OPBs, in which it obtained the most expressive movement of the study.
All models obtained the same movement configuration, where an α-helix (in orange) proved to be the region with the highest movement capacity. Thus, the OPBs of L. brasiliensis, L. donovani, L. infantum, L. mexicana and L. panamensis in their largest range of motion obtained, respectively, 9.8 Å, 11.3Å, 11.8Å, 11.9Å and 11.6Å (figure 12 and 13).
Figure 12: Result of the analysis by normal modes in representation by the pymol program, in the image the movements of the models are evidenced, in their relaxed forms (right) compared to the movement of greater amplitude (left). Also represented are the most rigid regions (Dark Blue), regions with little movement (Light Blue), intermediate regions (Green), regions with good movement potential (Orange) and extremely malleable regions (red) (Part1/2).
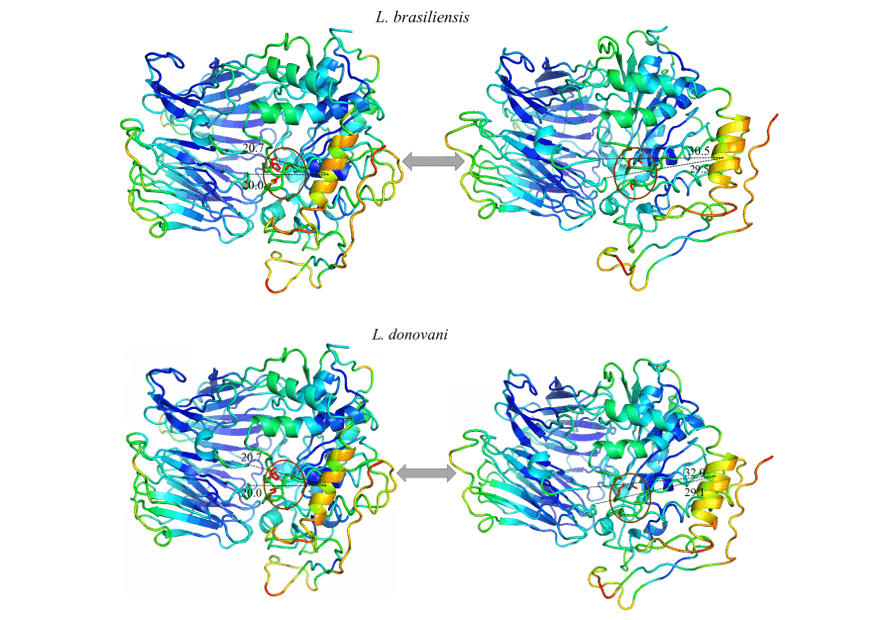
Figure 13: Result of the analysis by normal modes in representation by the pymol program, in the image the movements of the models are evidenced, in their relaxed forms (right) compared to the movement of greater amplitude (left). Also represented are the most rigid regions (Dark Blue), regions with little movement (Light Blue), intermediate regions (Green), regions with good movement potential (Orange) and extremely malleable regions (red). (Part 2/2)
In view of this, normal studies endorse a possible mechanism of OPBs not yet described for Leishmania spp species. until the present study.
CONCLUSION
In this study, the three-dimensional models of the opb enzyme of L.brasiliensis, L. donovani, L. infantum, L. mexicana and L. panamensis were obtained. The validation of the models presented reliable results for all three-dimensional models obtained. In the characterization of the enzyme, the surface electrostatic potential map showed that most of the residues presented negative charge. In the characterization of the region around the catalytic triad, it demonstrated similarity between volume, area and correspondence between positive and negative residues. Therefore, it was possible to verify that the results of the analysis by normal modes suggested an expressive movement in one of specific helix α, occurring a linear distance of this, from the center towards the periphery, thus exposing the catalytic triad. The description of these movements performed by this enzyme is of great importance to help the understanding of its functioning.
Finally, the results of the present study can add knowledge to the scientific community, bringing elucidations and new questions related to the theme, serving as a basis for eventual studies in the health area.
REFERENCES
A. Benner S, Cannarozzi G, Gerloff D, Turcotte M, Chelvanayagam G. Bona Fide Predictions of Protein Secondary Structure Using Transparent Analyses of Multiple Sequence Alignments. Chem Rev. 1997;97(8):2725-2844. doi:10.1021/cr940469a.
Alva, V., Nam, S. Z., Söding, J., & Lupas, A. N. (2016). The MPI bioinformatics Toolkit as an integrative platform for advanced protein sequence and structure analysis. Nucleic Acids Research, 44(W1), W410–W415. doi.org/10.1093/nar/gkw348.
Alvarenga DG, Escalda PMF, da Costa ASV, Monreal MTFD. Leishmaniose visceral: Estudo retrospectivo de fatores associados à letalidade. Rev Soc Bras Med Trop. 2010;43(2):194-197.
Altschul SF, Madden TL, Schäffer AA, et al. Gapped BLAST and PSI-BLAST: a new generation of protein database search programs. Nucleic Acids Res. 1997;25(17):3389‐3402. doi:10.1093/nar/25.17.3389.
Andersson CD, Chen BY, Linusson A. Mapping of ligand-binding cavities in proteins [published correction appears in Proteins. 2011 Apr;79(4):1363]. Proteins. 2010;78(6):1408–1422. doi:10.1002/prot.22655.
Bailey F, Mondragon-Shem K, Hotez P, et al. A new perspective on cutaneous leishmaniasis-Implications for global prevalence and burden of disease estimates. PLoS Negl Trop Dis. 2017;11(8):e0005739. Published 2017 Aug 10. doi:10.1371/journal.pntd.0005739.
Carmo RF, Luz ZMP da, Bevilacqua PD. Percepções da população e de profissionais de saúde sobre a leishmaniose visceral. Cien Saude Colet. 2016;21(2):621-628. doi:10.1590/1413-81232015212.10422015.
Chothia C, Lesk AM. The relation between the divergence of sequence and structure in proteins. EMBO J. 1986;5(4):823‐826.
Derewenda ZS, Derewenda U, Kobos PM. (His)Cε-H···O=C< Hydrogen Bond in the Active Sites of Serine Hydrolases. J Mol Biol. 1994;241(1):83-93. doi:10.1006/JMBI.1994.1475.
Dolinsky TJ, Nielsen JE, McCammon JA, Baker NA. PDB2PQR: an automated pipeline for the setup of Poisson-Boltzmann electrostatics calculations. Nucleic Acids Res. 2004;32(Web Server issue):W665–W667. doi:10.1093/nar/gkh381.
Eisenberg, D., Lüthy, R., & Bowie, J. U. (1997). [20]VERIFY3D: Assessment of protein models with three-dimensional profiles. Methods in Enzymology, 277, 396–404. https://doi.org/10.1016/S0076-6879(97)77022-8.
Eyal E, Lum G, Bahar I. The anisotropic network model web server at 2015 (ANM 2.0). Bioinformatics. 2015;31(9):1487–1489. doi:10.1093/bioinformatics/btu847.
Ghorbani Masoud, Farhoudi Ramin. Leishmaniasis in humans: drug or vaccine therapy? Drug Des Devel Ther. 2018;12:25-40. doi:10.2147/DDDT.S146521.
Hedstrom L. Serine Protease Mechanism and Specificity. Chem Rev. 2002;102(12):4501-4524. doi:10.1021/cr000033x.
Katsila T, Spyroulias GA, Patrinos GP, Matsoukas MT. Computational approaches in target identification and drug discovery. Comput Struct Biotechnol J. 2016;14:177–184. Published 2016 May 7. doi:10.1016/j.csbj.2016.04.004.
Kumar S, Tamura K, Nei M. MEGA3: Integrated software for molecular evolutionary genetics analysis and sequence alignment. Brief Bioinform. 2004;5(2):150-163.
Macedo-Silva RM, dos Santos C de LP, Diniz VA, De Carvalho JJ, Guerra C, Côrte-Real S. Peripheral blood fibrocytes: New information to explain the dynamics of Leishmania infection. Mem Inst Oswaldo Cruz. 2014;109(1):61-69. doi:10.1590/0074-0276130247
Machado P de A, Carneiro MPD, Sousa-Batista A de J, et al. Leishmanicidal therapy targeted to parasite proteases. Life Sci. 2019;219:163-181. doi:10.1016/J.LFS.2019.01.015.
Morris, A. L., MacArthur, M. W., Hutchinson, E. G., & Thornton, J. M. (1992). Stereochemical quality of protein structure coordinates. Proteins: Structure, Function, and Bioinformatics, 12(4), 345–364. https://doi.org/10.1002/prot.340120407.
Ovchinnikova M V., Mikhailova AG, Karlinsky DM, Gorlenko VA, Rumsh LD. Reversible cyclic thermal inactivation of oligopeptidase B from Serratia proteamaculans. Acta Naturae. 2018;10(2):65-70.
Ramachandran, G. N., Ramakrishnan, C., & Sasisekharan, V. (1963). Stereochemistry of polypeptide chain configurations. Journal of Molecular Biology, 7(1), 95–99. https://doi.org/10.1016/S0022-2836(63)80023-6.
Santos Filho, O. A., & Alencastro, R. B. de. (2003). Modelagem de proteínas por homologia. Química Nova, 26(2), 253–259. https://doi.org/10.1590/S0100-40422003000200019
Sievers F, Wilm A, Dineen D, et al. Fast, scalable generation of high-quality protein multiple sequence alignments using Clustal Omega. Mol Syst Biol. 2011;7:539. Published 2011 Oct 11. doi:10.1038/msb.2011.75.
SODERO ACR, DOS SANTOS ACGO, MELLO JFRE, et al. Oligopeptidase B and B2: comparative modelling and virtual screening as searching tools for new antileishmanial compounds. Parasitology. 2017;144(4):536-545. doi:10.1017/s0031182016002237.
Swenerton RK, Zhang S, Sajid M, et al. The oligopeptidase B of Leishmania regulates parasite enolase and immune evasion. J Biol Chem. 2011;286(1):429-440. doi:10.1074/jbc.M110.138313.
Volkamer, A., Kuhn, D., Rippmann, F., & Rarey, M. (2012). Dogsitescorer: A web server for automatic binding site prediction, analysis and druggability assessment. Bioinformatics, 28(15), 2074–2075. https://doi.org/10.1093/bioinformatics/bts310.
Wang Q, Arighi CN, King BL, et al. Community annotation and bioinformatics workforce development in concert–Little Skate Genome Annotation Workshops and Jamborees. Database (Oxford). 2012;2012:bar064. Published 2012 Mar 20. doi:10.1093/database/bar064
Webb B, Sali A. Comparative Protein Structure Modeling Using MODELLER. Curr Protoc Bioinformatics. 2016;54:5.6.1–5.6.37. Published 2016 Jun 20. doi:10.1002/cpbi.3.
Wiederstein, M., & Sippl, M. J. (2007). ProSA-web: Interactive web service for the recognition of errors in three-dimensional structures of proteins. Nucleic Acids Research, 35(SUPPL.2), 407–410. https://doi.org/10.1093/nar/gkm290.
WHO. Integrating Neglected Tropical Diseases into Global Health and Development: Fourth WHO Report on Neglected Tropical Diseases.; 2017. http://apps.who.int/iris/bitstream/10665/255011/1/9789241565448-eng.pdf?ua=1.
WHO. (2019). Leishmanioses – Informe Epidemiológico das Américas No 7 – Março, 2019. Retrieved from http://iris.paho.org/xmlui/bitstream/handle/123456789/50505/ 2019-cde-leish-informe-epi-das-americas.pdf?sequence=2&isAllowed=y.
ANNEX – FIGURES AND TABLES IN ENGLISH
Schema 1: Simplified schema of material steps and methods.
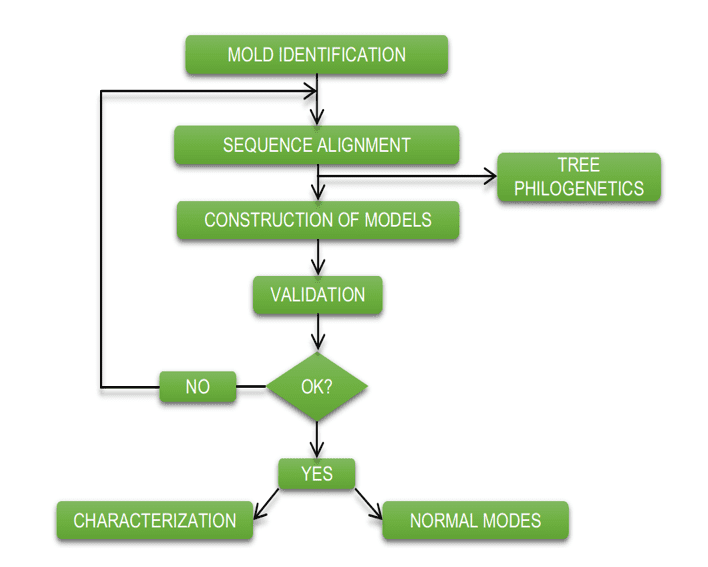
Table 1: Percentage of identity between the models of oligopeptity B of Leishmania species and their respective mold.
| Mold protein (code PDB) | Models OPB
(código uniprot) |
Identity (%) | Gaps (%) |
| OPB
L. major (code PDB 2XE4) |
L.brasiliensis
(A4H5Q8) |
86 | 0 |
| L. donovani
(C9EF60) |
96 | 0 | |
| L. infantum
(A4HTZ8) |
96 | 0 | |
| L. Mexicana
(E9AMS8) |
90 | 0 | |
| L. panamensis
(A0A088RJA7) |
86 | 0 |
Fonte: Autoral.
Figure 6: Results of ramachandran graphs, obtained by the PROCHECK program, the structures of the generated OPBs models, and the mold.
| Structures | % waste in the regions | ||||
| Favorable | Allowed | Unfavorable | |||
| OLIGOPEPTIDASE B | L. major (A)
(PDB 2XE4) |
90,2 | 9,5 | 0,3 | |
| L.brasilienses (B) | 92,2 | 7,7 | 0,2 | ||
| L. donovani (C) | 91,9 | 8,0 | 0,2 | ||
| L. infantum (D) | 92,3 | 7,3 | 0,3 | ||
| L. Mexicana (E) | 91,2 | 8,3 | 0,5 | ||
| L. panamensis (F) | 91,4 | 8,3 | 0,3 | ||
Source: Prepared by the author based on procheck results.
Figure 7: Z-score results calculated on the ProSA-web server of the mold structures (for comparison). (A) L .major (molde) e modelos: (B) L. brasilienses (C) L. donovani (D) L. infantum (E) L. mexicana (F) L. panamensis. The region in dark blue indicates the score of the proteins obtained by NMR and in light blue of the proteins obtained by X-ray diffraction
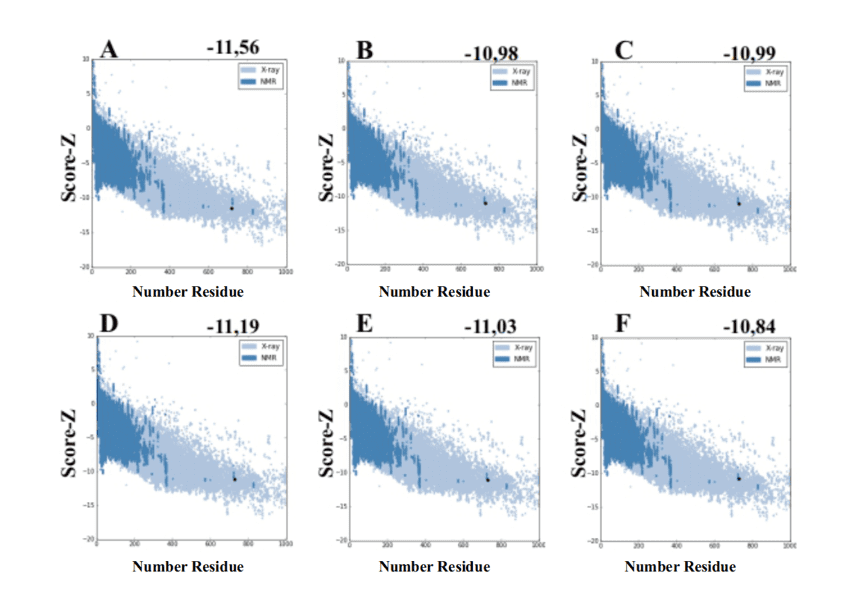
Table 2: Results of Verify 3D, showing the percentage of residuals with score > 0.2.
| Structures | % residue with score > 0,2 | |
| OLIGOPEPTIDASE B | L.major
(PDB 2XE4) |
93,20 |
| L.brasilienses | 95,62 | |
| L.donovani | 97,12 | |
| L.infantum | 94,93 | |
| L.mexicana | 95,62 | |
| L.panamensis | 94,93 |
Source: Authoral.
Table 3: Comparison between the secondary structures predicted by psipred and that found through Pymol.
| Models | α-Hélix | Sheet β | PSIPRED
α-Hélix |
PSIPRED
Sheet β |
| L.brasiliensis | 15 | 38 | 11 | 36 |
| L. donovani | 16 | 38 | 11 | 36 |
| L. infantum | 16 | 38 | 11 | 36 |
| L. mexicana | 15 | 38 | 10 | 36 |
| L. panamensis | 15 | 38 | 11 | 36 |
Source: Authoral.
Table 4: RMSDs of the OPBs generated by the Modeller, having with orientation the alpha carbons of the OPB mold of L. major.
| Mold | Models | RMSD (Å) |
| L. major
(2XE4) |
L.brasiliensis | 0,15 |
| L. donovani | 0,15 | |
| L. infantum | 0,16 | |
| L. mexicana | 0,19 | |
| L. panamensis | 0,14 |
Source: Authoral.
Table 5: Values referring to the possible connection regions of the OPBs (obtained by the server).
| Structures | DogSiteScoore | |||
| Volume | Area | Drug Score | ||
| OP OLIGOPEPTIDASE B | L. major
(PDB 2XE4) |
1690,62 | 1818,41 | 0,80 |
| L.brasiliensis | 1527,84 | 1766,63 | 0,80 | |
| L. donovani | 1074,57 | 1428,55 | 0,79 | |
| L. infantum | 1309,97 | 1572,19 | 0,80 | |
| L. mexicana | 800,92 | 799,38 | 0,85 | |
| L. panamensis | 971,96 | 1083,40 | 0,81 | |
Source: Authoral.
[1] Biomedical and master’s degree in Medical Biochemistry.
[2] Master in Pharmaceutical and Pharmaceutical Sciences from UFRJ.
[3] PhD in Chemistry, Master in Organic Chemistry and Industrial Pharmaceuticals.
Sent: May, 2020.
Approved: May, 2020.