ORIGINAL ARTICLE
SILVA, Sarley De Araújo [1], MAGNO, Rui Nelson Otoni [2]
SILVA, Sarley De Araújo. Probability, control chart applied to educational science software. Revista Científica Multidisciplinar Núcleo do Conhecimento. Year 06, Ed. 06, Vol. 11, pp. 43-73. June 2021. ISSN: 2448-0959, Access link: https://www.nucleodoconhecimento.com.br/mathematical-olympiads/educational-science
ABSTRACT
The present study mentions the reduction of variability and losses due to special causes in applications of the educational sciences, aiming to detect and correct variability deviations through software control charts in applied statistical problems. Thus, we sought to study concepts about control charts by variables and attributes in the control of abnormalities. In the realization of this theme, the quantitative methodology and the control chart of the Minitab Software were used. The results obtained allowed to reduce losses and improve the quality process through sample adjustments between minitab control limits, providing to understand and analyze the causes of anomalies. Therefore, it is concluded that the tool from corrective actions is able to stabilize the standard deviations and improve the quality of probability and statistical applications.
Keywords: Probability, Minitab Software, Control Chart.
1. INTRODUCTION
Statistics is a branch of mathematics that uses the probability tool to explain data groupings, both in observational studies and in experiments to model, estimate and predict future phenomena. Its purpose is to obtain, organize, analyze data, calculate control charts, correlations and regressions, enabling control in variability, statistical applications and educational institutions. Statistical methods refer to data obtained from observations in the form of measurements or counting. From information it is possible to study statistical problems related to the control of variability applied in the sciences in engineering, chemistry, physics, mathematics, geography and etc. The use of statistical software is an important tool for studies and applicability in the control of variations in probability and statistical problems.
Institutions are concerned with maintaining high performance indices with regard to quality and productivity due to the requirements in the provision of services. Information and new technologies have established a globalized environment of high competition, in which price and deadline should be met (VILAÇA and OLIVEIRA, 2011). In “Any production process, regardless of how well designed or maintained it is, will always be subject to a natural or inherent variability, which is the result of the cumulative effect of many small and inevitable causes, called common causes” (MONTGOMERY, 2004, p.154). Therefore, the reduction of abnormality in families of variables is of paramount importance in the statistical process.
According to Souza and Rigão (2005), the CEP acts preventively on the process using statistics as a base element to evaluate its changes. These characteristics enable the CEP to assist in the monitoring of the process and allows actions to be taken in a way directed to solve problems, assisting in the stabilization of the process and avoiding the production of non-compliant items (HORA and COSTA, 2009; MAYER, 2004).
The objective of this work is to use statistical techniques in software to identify, correct and eliminate abnormalities present in education science problems. The importance of the control charts of statistical software in the control of abnormalities.
The main objective of statistical process control is to quickly detect the occurrence of attributable causes in process changes, so that process investigation and corrective action can be performed before many non-compliant units are manufactured (MONTGOMERY, 2013, p.280).
Therefore, statistical software is relevant in the process of identifying and eliminating variability.
The function of statistical process control in the software charts is to evidence the modulations that occurred during processing and develop statistical graphs that can provide a more precise parameter, assisting in practices that can improve the predominant points of manufacturing, besides recognizing, correcting, eliminating, or adapting processes with abnormality, giving a more precise parameter, so that improvements can be applied in the production line (OLIVEIRA, 2015, p.22).
The control charts of the statistical software make it possible to find the variability demonstrated through the graphs, enabling better visualization of the process, in order to demonstrate possible defects, for the application of more efficient corrections, in the search for continuous improvement.
Even with the progress in the process through quality control, there are still causes of variability in the process, that is, when there is an oscillation around the mean or the ideal point of the specification, a constant monitoring of the production behavior is required. “Through analysis of the collected data and characterization of the cause of system instability or variability, used in control charts, tools of statistical process control as a result to obtain continuous process improvement” (JURAN and GRYNA, 1992).
All processes exhibit variability, that is, the greater the variability, the greater the uncontrol over the results produced and the desired results. (MONTGOMERY, 1997).
In improving the quality of a product it is necessary to make use of statistical software:
In a competitive environment, continuous process improvement makes it possible to monitor, control and improve production processes whenever any abnormality is detected. If there is a preventive nature, these actions contribute to minimize losses and increase productivity (BORTOLOTTI, 2009, p.02).
Such statistical techniques using minitab software contributeto the analysis of various products, detecting and reducing possible abnormalities, ensuring stocks within quality parameters. “One of the main results of the industrial quality study was the widespread use of statistical process control methods to eliminate special causes in processes and reduce the common causes of variation” (MONTGOMERY, 1997). In this context, statistical process control is an extremely important tool for the application of statistical techniques in the reduction of variation. Statistical process control can be defined as a set of seven troubleshooting tools to achieve process stability, in addition to improving its capacity. (FERREIRA et. al., 2008).
The control charts of the statistical software assists in the identification and stability of the causes of variability of the processes, serving as the basis for decisions and corrective actions of control, reducing variability and avoiding out-of-control sample data.
Statistical process control is a powerful collection of tools for data collection, analysis and interpretation, with the aim of improving quality by eliminating special causes of variation, and can be used for most processes. (MONTGOMERY, 2004, p.279-281).
The study on control charts in statistical software contributes to the analysis of applications in educational sciences in the reduction of variability in the analyzed samples, generating better results in quality control.
2. MATERIALS AND METHODS
2.1 MATERIALS
The materials used to control variability in educational science applications were the control charts in Minitab Software.
2.2 METHODS
To carry out the study, the quantitative method and the control chart of minitab software were used to reduce variability in education science applications. The methodology seeks data validation through the use of statistical data. The study had the following distribution: Choice of application to be analyzed, determination of lower and upper limits in mean parameters and amplitude, distribution of samples and verification of their points, analysis of problems by control charts and correction of special causes from the out-of-control sample analyses.
“The quantitative method seeks data validation through the use of statistical data, with analysis of a large number of representative cases. It seeks to quantify the data and apply some form of statistical analysis” (OLIVEIRA, 2011). The quantitative approach is frequently used in descriptive studies, which seek to classify the relationship between variables and the causal relationship between phenomena.
Richardson (1999, p.70) conceptualizes:
the quantitative approach, as its name implies, is characterized by the use of quantification both in the modalities of information collection and in the treatment of them through statistical techniques, from the simplest as percentage, mean, standard deviation, to the most complex, as correlation coefficient, regression analysis, etc. It represents, in principle, the intention to ensure the accuracy of the results and avoid distortions of analysis and interpretation, thus enabling a margin of safety in relation to inferences.
According to Michel (2005, p. 31), the quantitative approach is a social research methodology that uses quantification in the modalities of information collection and its treatment through statistical techniques, such as mean percentage, standard deviation, correlation coefficient, regression analysis, among others. The control charts are a beneficial tool that brings improvements and quality assurance of waste increasing costs, disappearance of scrap and resolution of various production problems related to specific methods etc. (ROSA, 2009).
The control charts were used by variables and attributes as techniques in the construction of graphs in probability and statistical applications, where stability improvement was observed in relation to the variability of sample defects. To find a possible cause of variability and verify if the process is under control, the graphs were used to control abnormalities at sampling points. Through the graphs it was possible to identify and compare variability in questions of statistical sciences.
He made use of minitab software as a data analysis tool. From the results between the control limits it was possible to solve defects and improve the quality. The control graphs of the mean, amplitude and standard deviation were chosen to control the variations of the mean in statistics.
The instrument aimed to identify, analyze, compare, correct and reduce variability in educational science applications made the use of Minitab which is a proprietary computer program aimed at statistical purposes (MINITAB, 2016). “It is a tool that allows us to perform complex statistical calculations and visualize the results, making data analysis accessible to the casual user and convenient for the more experienced user” (PEREIRA and PATRÍCIO, 2016).
In improving quality, statistical software technology is used:
The statistical tools in addition to prioritizing the proposed applications according to the degree of importance, they make the identification and help in the action on the problems for the elimination of possible causes. Enabling the institution to have a higher degree of stability in the applications analyzed (WERKEMA, 2006, p.32).
Stratification : “Stratification consists of dividing sectors into subsectors according to desired factors, which are called stratification factors, that is, for the process of dividing the heterogeneous whole into homogeneous subgroups” (VIEIRA, 1999).
Checksheet: For Werkema (2006), verification sheet is a form that has in its scope criteria to be analyzed, in order to facilitate the collection and filling of data. It is a tool used to assist in data collection and must be adequate for the collection to be effective. Therefore, the check sheet must clearly specify the type of data to be collected, the operation to be performed, the date of collection, the analyst and any other information that is useful for identifying the cause of poor functional performance (CARPINETTI, 2010; MONTGOMERY, 2009). According to Vieira (1999), the type of check sheet will depend on what its objectives will be, these being: how to raise the proportion of non-compliant items; inspect attribute; indicate where the defect is located in the final product; raise the causes of defects; analyze the distribution of a variable; and monitor a manufacturing process.
Pareto Chart: It is the tool that makes the distribution of frequency of data, pointing out the defect that occurs most frequently, and may be these of percentage or real order order. Remembering that a defect more often may not be the main or most critical problem of the process (CARPINETTI, 2010; MONTGOMERY, 2009). Vieira (1999) says that the Pareto chart is used to identify the causes of problems such as manufactured products that require rework, unnecessary expenses, work accidents, equipment breakdown, errors and delivery delays, among others.
Cause and effect diagram: Also known as Ishikawa Diagram has the function of identifying and analyzing the causes that promote an unwanted effect. It is an effective diagram for identifying the root of the problem (CARPINETTI, 2010; MONTGOMERY, 2009). Werkema (2006) states that the Cause and Effect Diagram is a tool used to present the relationship between the effect or problem and the cause that might alter the result. The Cause and Effect Diagram organizes the information so that it makes it clearer to facilitate the analysis and identification of the causes of the problem, allowing corrective actions to be taken to eliminate the cause of the problem (TRIVELLATO, 2010).
Histogram: According to Werkema (1995), a histogram can be defined as a bar graph in which the horizontal axis, subdivided into several small intervals, presents the values assumed by a variable of interest.
Dispersion diagram: The dispersion diagram is responsible for helping to identify relationships between a defect and a cause, that is, it aims to identify the relationship between two variables or even the relationship of a third cause. The relationships between the variables can be: positive, negative or non-existent (CARPINETTI, 2010; MONTGOMERY, 2009).
Control chart: According to Werkema (2006), any tangible or intangible asset, when elaborated and/or made, has a variation arising from the process. It is known that these variations should be strictly reduced. For Werkema (2006), control charts are used to monitor variability, distinguishing the types of variation, and evaluate the stability of the process, whether it is under control or not. However, the process may vary from common causes or special causes
The control charts were created by Shewhart, and are composed of central or middle limit (LC), lower limit (LI), and upper bound (LS). Its main function is to indicate whether the process is under control or not, that is, whether the process is making products according to the specifications or not. The process analysis is made from the verification of the control chart, observing whether the points plotted in it are between the upper and lower limits of specification (CARPINETTI, 2010; MONTGOMERY, 2009).
Control Charts: Serves to analyze process variations of common causes, and detect special causes, is a tool called Charts or Control Charts. Analyzing the capability of a process is a vital part of a global quality program. Among the main data uses of a process capacity analysis stand out (MONTGOMERY, 2004):
2.2.1 STATISTICAL RULES FOR IDENTIFYING SPECIAL CAUSES
Suggests a set of decision rules for distinguishing non-random patterns in control charts. Specifically, it suggests that it be concluded that the process is out of control if (MONTGOMERY, 2004):
1st case: identify six, eight or more points above or below the center line. Possible causes: change in machine adjustment process, method or different material, breakdown of a component in the machine, machine breakage and wide variation in the material received.
2nd case: find six, seven or more points up or down. Possible causes: gradual tool wear, equipment wear, or wear related to the measuring instrument.
3rd case: check the displacement of the mean. Possible causes: new method, new machine in quality improvement and a new batch of material.
4th case: points outside the control limits. Possible causes: measurement or typing error, tool breakage or unregulated measuring instrument, which does not allow the identification of the measurement.
5th case: periodicity of points. Possible causes: non-uniformity in the raw material received, rotation of operators, jigs and instruments, and difference between shifts.
2.2.2 CONTROL CHARTS FOR VARIABLES AND ATTRIBUTES
The control charts by variables are intended to inform about the improvement of quality, process capacity, decision-making regarding product specification, production process and decisions on newly produced parts. They are applied where quality characteristics can be measured quantitatively. They can be, for example, dimensions of parts, volume, weight, among others. Thus, its wide scope of application is perceived, since several types of processes have these types of characteristics (MAGALHÃES, 2011).
“Control charts for variables are more used than control charts for attributes, because they have more concrete information, working with small samples, allowing to identify more quickly the causes that affect the stability of the process” (REBELATO, 2006). “The control charts for variables are charts for means, used to control the average value of the process performance, amplitude chart or standard deviation chart, being the most used amplitude graph, because, in most cases, the standard deviation of the process is not known” (CASTRO, 2012).
Control charts can be classified into two groups: control charts for variables: it records the quality characteristics that are measured on a quantitative scale. And the control charts by attributes: it records the quality characteristics, being measured on a qualitative scale, for example, it is considered compliant and not compliant (SIQUEIRA, 1997). Thus, according to Spiegel and Stephens (2007), the terms ‘variables’ and ‘attributes’ are associated with the type of data collected from the process.
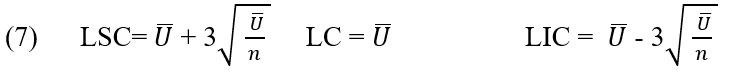
2.2.3 CONTROL CHART FOR MEDIUM (X-BAR) AND AMPLITUDE (R)
The average graph ![]() is used to control the average of the process (centrality) and the amplitude graph
is used to control the average of the process (centrality) and the amplitude graph ![]() to control the variability of the considered process (IPEK et al., 1999).
to control the variability of the considered process (IPEK et al., 1999).
Expressions for calculating the control limits of ![]() and R.
and R.
Control grafic ![]() . The centerline and upper and lower control limits for the control chart
. The centerline and upper and lower control limits for the control chart ![]() are:
are:
Control chart R. The center line and the upper and lower control limits for the Control Chart R are:
![]()
2.2.4 AVERAGE GRAPH (X-BAR) AND STANDARD DEVIATION (S)
The control chart for mean (X-bar chart) is used to control the process mean, while the control chart (standard deviation chart S) is used to control process variability. When the sample size (subgroup) is less than or equal to ten, the R and S charts will look the same. However, when the sample size grows, the S chart becomes more accurate than the R chart, and should be used (SIQUEIRA, 1997).
Control grafic ![]() . The centerline and upper and lower control limits for the control chart
. The centerline and upper and lower control limits for the control chart ![]() are:
are:
![]()
Control chart S: 
2.2.4.1 CONTROL CHARTS BY ATTRIBUTES
Attribute charts are used to control defect analysis. These charts are especially useful in the control of raw materials and finished products, and are also used in the analysis of quality reviews in consumer letters. An attribute is a characteristic of a product, a process, or any other population that can be counted, but cannot be described, so that its values are incremented (RODRIGUES, 1998). They are graphs that allow us to identify how sample sets behave around limits, trends and level exchange. In variables, it is quickly perceived when the data do not follow a random distribution. In attribute control charts, units are classified as perfect or defective according to the established criteria. Therefore, the probability of a defective unit being produced is constant, and consequently, the corresponding sample distribution is binomial (CHAVES and TEIXEIRA, 1997). Attribute charts are used to control defect analysis. These graphs are especially useful in the control of raw materials and finished products, and are also used in the analysis of comments on quality and characteristics expressed qualitatively, that is, when these characteristics analyzed are not represented numerically, and can be classified according to or non-conforming (SOUZA, 2005). It is the representative measures that result from counts of the number of items of the product on a discrete scale that present a particular characteristic of interest. Measurements are made by visual inspection, and non-measurable characteristics are recorded. It can be said control plot by discrete random variable with Poisson probability density function (LAGO, 1999).
The mathematics of attribute cards does not require tables. They can be applied to systems in which the measures consist of approving or disapproving or to processes in which it is very difficult or impossible to obtain measures of variables (RODRIGUES, 1998).
Statistical information of measurements by attributes in solutions to problems of educational sciences, is classified in products with abnormalities or defects. One of the main objectives of attribute measurement analysis is to identify, detect and correct defects, quality can be defined as the set of attributes that make a good or service fully suited to the use for which it was designed (MONTGOMERY, 1985). The four control charts for attributes in abnormalities and defects, used according to Montgomery (2004), are as follows: Control charts by attributes which are: Letter p (nonconforming proportions), Np Chart (nonconforming units), Letter C (number of non-conformity per unit), and Letter u (nonconformance rate per unit).
2.2.5 GRAPH P (NON-CONFORMING PROPORTIONS)
For Werkema (2006), the p chart is used when the characteristic of the quality of interest is represented by the proportion of defective items produced by the analyzed process.
Control chart P:

2.2.6 NP CHART (NON-COMPLIANT UNITS)
The letter does not indicate the number of defects per sample and is used to control the number of defective products in each batch and ensure that the process is under control (RODRIGUES, 1998).
The centerline and the upper and lower control limits for the np chart are:

2.2.7 GRAPH C NUMBER OF (NON-COMPLIANT PER UNIT)
Chart c is used to determine whether the defect number on a single item is within the defined control limits. It can be considered as final inspection (RODRIGUES, 1998). Chart c is most appropriate when defects are dispersed in a continuous medium, such as: number of faults per fabric area, number of imperfections per floor length; and when a product may have more than one type of defect (RIBEIRO and CATEN, 2012).
Therefore, the control limits of graph C will be calculated using the equations:
2.2.8 GRAPHIC U NON-COMPLIANCE RATE PER UNIT
The u chart is used to monitor defects in a production unit (MONTGOMERY, 1997). The u chart is recommended when the product is composed of various parts and many quality characteristics that must be inspected and also when the size of the product unit is variable (CORTIVO, 2005).
The centerline and the upper and lower control limits for the U chart are:
2.2.9 MULTIPLE LINEAR REGRESSION
Multiple regression analysis is a technique used to investigate the relationship between a dependent variable and a set of independent variables (MONTGOMERY and RUNGER, 2009). The technique allows the estimation of future values for the dependent variable, given a set of input data for the independent variables (PEDRINI and CATEN, 2009; DOWNING and CLARK, 2002)
The base model of multiple linear regression where ![]() for j=0,1,2…..k are regression coefficients, Y is the dependent variable of the regressors
for j=0,1,2…..k are regression coefficients, Y is the dependent variable of the regressors ![]() and the value and is the random error of the equation. (MONTGOMERY, 2015).
and the value and is the random error of the equation. (MONTGOMERY, 2015).

The process is studied to understand the needs of analyzing the applications of educational sciences and their process steps. Sources of analysis are raised, the applications that are analyzed in it, are the variability the main factors that influence it. Identifying the most appropriate type of control chart to analyze the data by minitab software. With the method stochastic process control sought the structuring of the research in order to help the progress of the same.
3. RESULTS AND DISCUSSION
3.1 THE USE OF MINITAB CONTROL CHARTS IN REDUCING VARIABILITY
After collecting and plotting the data in engineering applications, some graphs were constructed for variables and graphs for attributes in the control charts of the Minitab software to monitor losses due to variations in production. For analysis of the results, the tolerance range composed of the components was determined by the following components: Upper Limit of Control LSC, LC Midline and LIC Control Lower Limit.
It was observed that after identifying, eliminating and reducing causes of variability brought the possibility of improvement in the quality of products. Through the analysis of the results obtained in the statistical applications will be presented the control of stability in the causes of defects in sample points in the graphs, and the control of process in sample was performed in order to control the variability. The control charts presented the following results among the statistical parameters: Calculation of the process mean, Calculation of the standard deviation, Calculation of control limits LSC, LIC and amplitude in the applications below:
3.2 PROBABILITY AND STATISTICAL APPLICATIONS IN ENGINEERING BY CONTROL CHART IN MINITAB SOFTWARE IN VARIABILITY REDUCTION
Graphics constructions in descriptive statistics applications executed by the control chart in Minitab Software.
01) The data refer to a pin machining process, in which the diameters are measured by sampling 5 pieces in 25 lots. Review the process with Minitab Software.
Table 1: Pin diameter measurements
| Lot | Measurements | ||||||
| 1 | 2,08495 | 2,09203 | 1,01425 | 0,47627 | 1,75308 | ||
| 2 | 2,44288 | 1,84913 | 1,02012 | 1,5103 | 0,5167 | ||
| 3 | 2,08819 | 0,34567 | 0,67246 | 2,14641 | 0,51528 | ||
| 4 | 1,42411 | 1,04348 | 1,15683 | 0,9108 | 1,23562 | ||
| 5 | 1,43307 | 0,22926 | 1,51612 | 0,82627 | 1,29935 | ||
| 6 | 1,2113 | 0,63715 | 0,97815 | 2,30782 | 1,0003 | ||
| 7 | 2,14731 | 1,95837 | 0,95294 | 1,35384 | 0,73037 | ||
| 8 | 2,02444 | 1,60384 | 1,64667 | 1,66449 | 0,92746 | ||
| 9 | 1,4743 | 1,93916 | 1,06107 | 1,55396 | 0,8049 | ||
| 10 | 1,09096 | 2,09033 | 0,62161 | 1,45256 | 1,77208 | ||
| 11 | 1,90879 | 1,274 | 1,46827 | 1,36343 | 1,06161 | ||
| 12 | 0,81791 | 1,89952 | 1,24044 | 0,72729 | 1,44959 | ||
| 13 | 0,58784 | 1,57195 | 0,73316 | 1,05367 | 3,29273 | ||
| 14 | 2,12184 | 0,90374 | 0,59773 | 1,63101 | 0,82706 | ||
| 15 | 1,2819 | 0,89479 | 1,05394 | 1,25779 | 0,99451 | ||
| 16 | 0,82836 | 0,16347 | 2,12864 | 1,69732 | 0,90752 | ||
| 17 | 0,14026 | 1,0432 | 0,76948 | 1,72083 | 3,95445 | ||
| 18 | 2,19158 | 0,87777 | 0,955 | 1,50304 | 1,1604 | ||
| 19 | 0,93195 | 1,82231 | 1,2179 | 1,72608 | 1,45375 | ||
| 20 | 0,84523 | 2,79753 | 2,30041 | 0,47693 | 0,58081 | ||
| 21 | 1,84098 | 2,37729 | 1,89976 | 1,2079 | 3,2343 | ||
| 22 | 1,15648 | 2,5689 | 0,90064 | 3,7548 | 1,24616 | ||
| 23 | 2,21913 | 0,91997 | 2,15777 | 1,48548 | 0,25288 | ||
| 24 | 1,41393 | 0,71069 | 0,63707 | 1,71835 | 1,52855 | ||
| 25 | 1,5938 | 1,19839 | 0,88228 | 1,23019 | 0,41643 | ||
Source: Action (2019)
Figure 01: Faulty pin control chart out of control
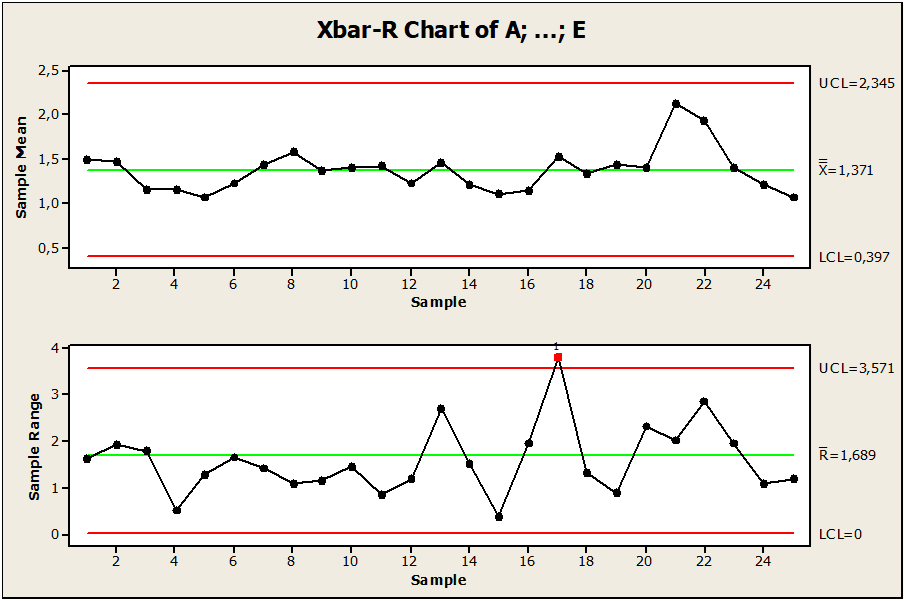
The sample data present a pin machining process observed in 25 lots of pins. As shown in Figure 01. We observed that there is variation between point 17 above the upper limit of LSC control, where the point is outside the control limit. Its central limit is equal to 1.68, upper control limit with the value 3.57 and lower limit equal to 0.0, this implies that point 17 in the value pin 3.95445 is influenced by variability. So to keep the process under control it was recommended to remove, change values or build a new chart.
Figure 02: Control chart with the limits adjusted
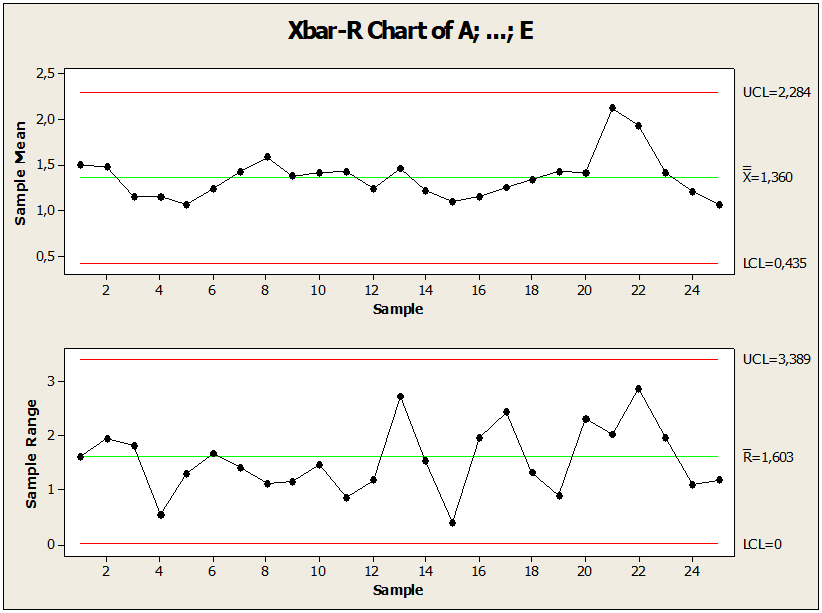
After checking the abnormality, Figure 02. The graph shows the point under control in relation to the mean, where there was modification in order to keep the process under control. In the sample of point 17 of non-conformity value 3.95445, it changed to 2.55445. This change performed by the control chart followed by statistical rules reduced variability and the point outside the control limit was adjusted. We conclude that all these statistical measures kept the process stable. After identifying, analyzing, corrected, reduced and controlled the process of non-conformity samples, it was possible to compare the results obtained with the previous results between the process: Out-of-control process, LC equal to 1.68, standard deviation equal to 0.69 and amplitude of the limit value 3.81 one point above the limit. LSC. Process under control LC equal to 1.60, standard deviation equal to and 0.66 Amplitude of the limit value 3.61. After comparison with the values calculated in the 1st and 2nd test, there was an improvement in the statistical parameters.
Figure 03: Shows pin diameters
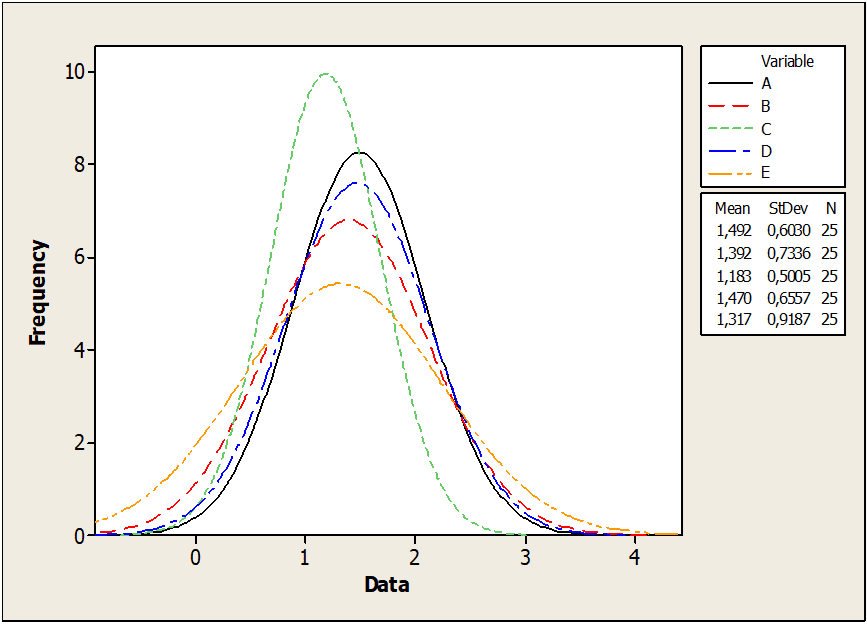
Figure 03 shows a dispersion curve of pin diameters in subgroups of E with greater precision than the dispersion curve of subgroups D. The standard deviation for samples of subgroup E (0.91) is much larger than the samples of subgroup D. (0.50). Therefore, the adjusted distribution for subgroup E is flattened and more accurate.
02) A study was carried out to determine the increase in defects in stainless steel doors of kitchen equipment produced in a metalworking company. During the study, the defects below appeared with their occurrences and associated costs. Build the respective Pareto diagrams.
Table 2: defective parts
| Type of defects | Nº. of defective parts | Unit cost repair/scrap | |
| Poorly executed welding | 55 | 50 | |
| Poor drilling | 9 | 50 | |
| Bending defects | 274 | 5 | |
| Packaging | 15 | 50 | |
| Poor plate quality | 16 | 50 | |
| Cuts | 126 | 30 | |
| other | 12 | 50 |
Source: Core Formation -Nufec (2006)
Figure 04: Defective parts numbers
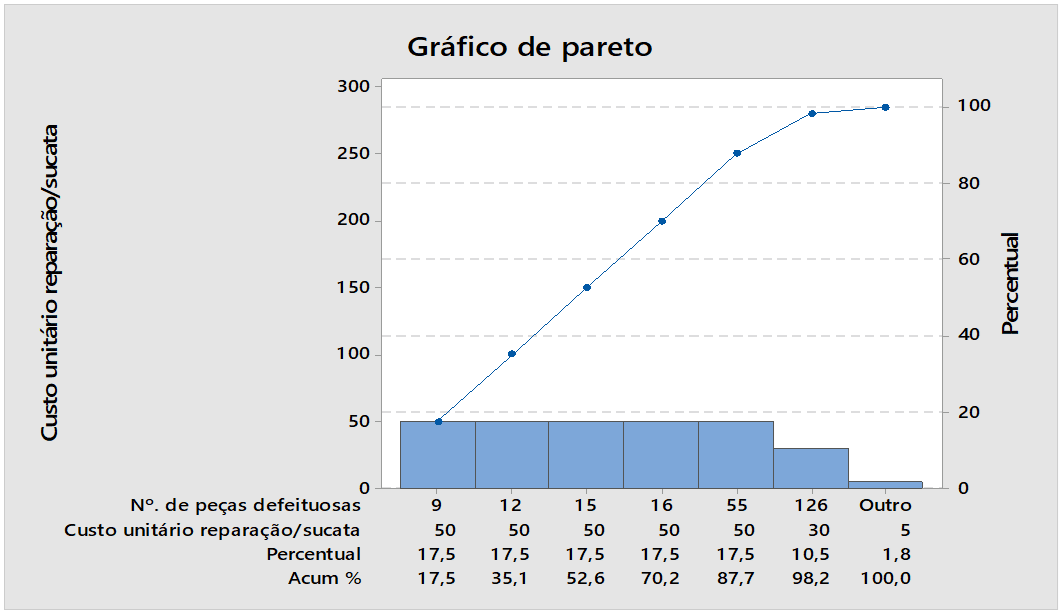
Figure 04 shows the results of defective parts numbers, percentage, the largest source 9 defective parts that corresponds to a percentage of 17.5 %. When analyzing the figure, it is perceived the presence of concentration of causes of special variability requiring correction by the control chart of the Minitab software.
Figure 05: Defective parts numbers process out of control
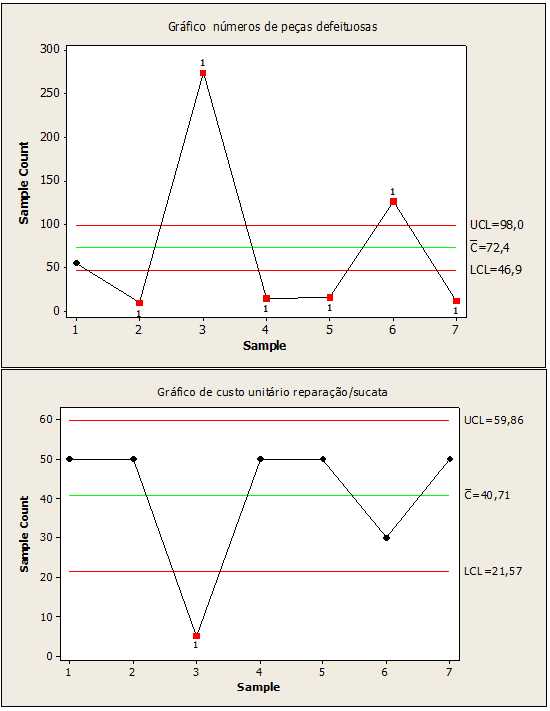
It was verified that figure 05, referring to defective parts, showed variability in points 2,3,4,5,6,7 with values (9,274,15,16,126,12). On the other, unit cost in the repair of the point scrap with variability 3 with a value equal to 5. It is concluded that there are special causes in these points, and there is a need for correction.
Figure 06: Defective parts numbers process under control
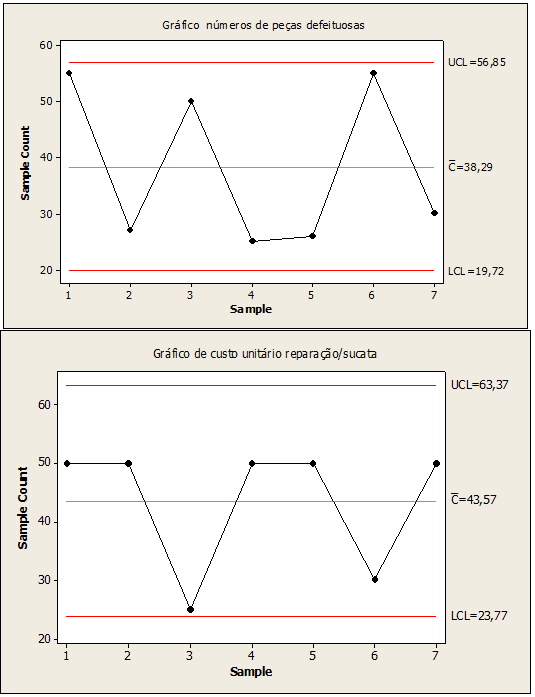
In Figure 06, the values used in place of the values of the out-of-control points 2,3,4,5,6,7, followed are 27,50,25,26,55,30 for defective parts and 25 for unit cost scrap repair in point 3. This replacement data generated by the control chart improved the stochastic process keeping under control, reducing variability in the manufacture of stainless steel portals, keeping the quality of the product stable.
03) An extrusion mold is used to produce aluminum rods. The diameter of the canes is a critical feature of quality. The following table shows the x and r values for 20 samples of five canes each. Specifications on the canes are 0.5035 +/- 0.0010 inch. The data values are the last three digits of the measure, that is, 34.2 is read as 0.50342.
a) Using all the data, find the control limits for the X and R charts, construct the chart, and plot the data.
b) Use the limits of item control attempts (a) to identify out-of-control points. If necessary, review your control limits, considering that any sample outside the control limits can be eliminated.
Table 3: Nail samples
| sample | R | sample | R | ||
| 1 | 34,2 | 3 | 11 | 35,4 | 8 |
| 2 | 31,6 | 4 | 12 | 34,0 | 6 |
| 3 | 31,8 | 4 | 13 | 36,0 | 4 |
| 4 | 33,4 | 5 | 14 | 37,2 | 7 |
| 5 | 35,0 | 4 | 15 | 35,2 | 3 |
| 6 | 32,1 | 2 | 16 | 33,4 | 10 |
| 7 | 32,6 | 7 | 17 | 35,0 | 4 |
| 8 | 33,8 | 9 | 18 | 34,4 | 7 |
| 9 | 34,8 | 10 | 19 | 33,9 | 8 |
| 10 | 38,6 | 4 | 20 | 34,0 | 4 |
Source: Montgomery (2013)
Figure 07: Out-of-Control Rod Samples
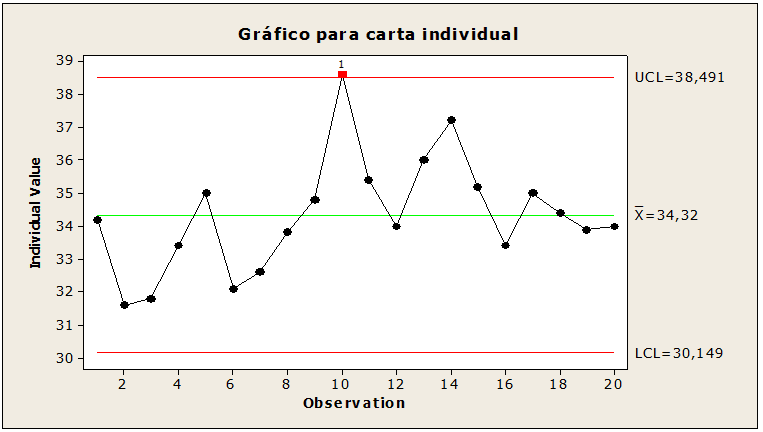
Statistical control for 20 sample of five rods each. When interpreting figure 07, the values of the upper limit were 38.49, the mean 34.32, the standard deviation 1.72, the lower limit 30.14 with point 10 of value 38, 6 above the upper limit giving indications of special causes that can be correct. Correction at this point is suggested so that the limits are adjusted.
Figure 08: Nail samples under control
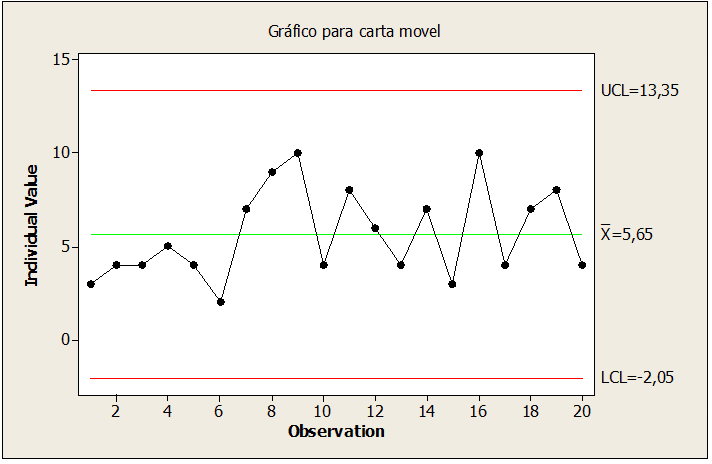
By correcting the point in figure 08, point 10 was adjusted, reducing the sample value to 36,6, keeping the process stable and under control in the manufacture of the diameter of aluminum rods.
Figure 09: Process capacity stem samples
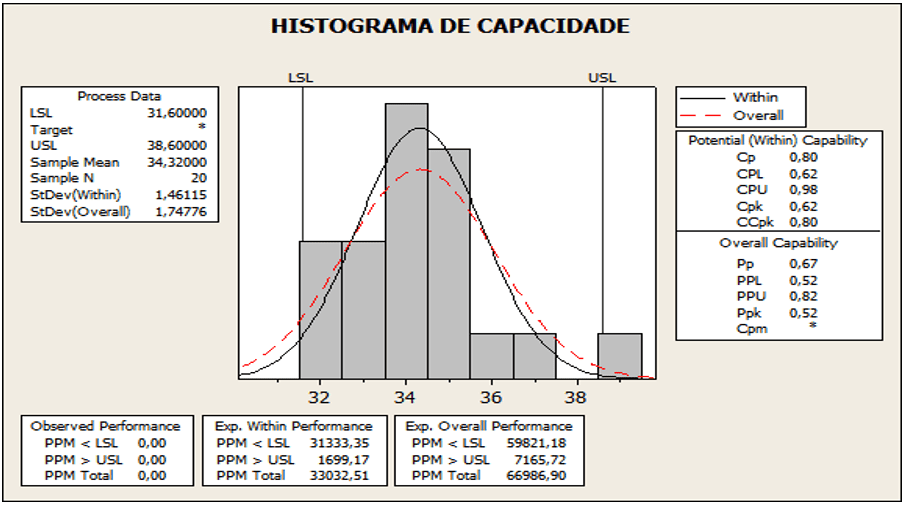
According to the analysis of Figure 09, it presents the value for Cpk equal to 0.49, mean 5.65, standard deviation 2.434 and p-value 0.025. CPk result out of bounds, if Ppk < CPk. The mean obtained was 5.65, with displacement to the LSE. The CPk 0.49 lower than the established values that is implying 1.33 is outside the stable limit.
Figure 10: Defect percentage
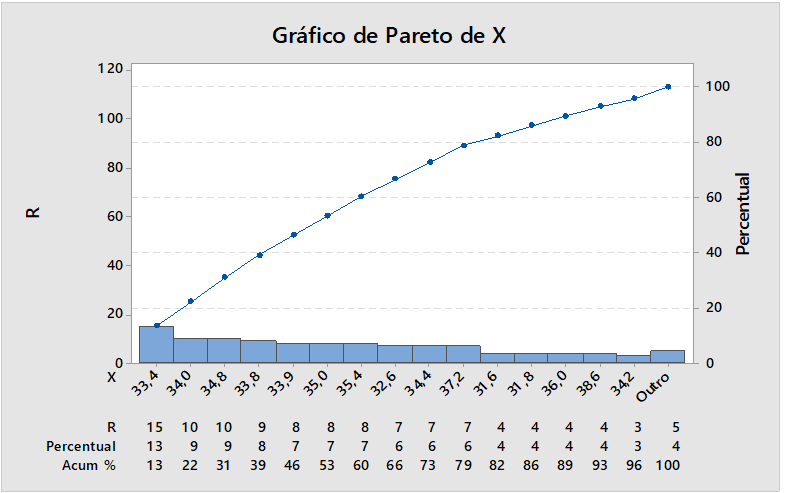
Figure 10. The pareto chart provides the percentage of the analyzed samples of defectives produced in this process, percentage, the largest source 15 defective parts that corresponds to a percentage 13%. There is a need to eliminate variation.
Observing the figures, it was verified that in Figure 07, point 10 is outside the control limit, presenting abnormality in the diameter of the rods that can be correct. Already in figure 09, the cpk is out of bounds. However figure 10, has a defect in the rods. Next figure 08. After interpreted, analyzed and eliminated the special causes at the point of the diameter remained stable.
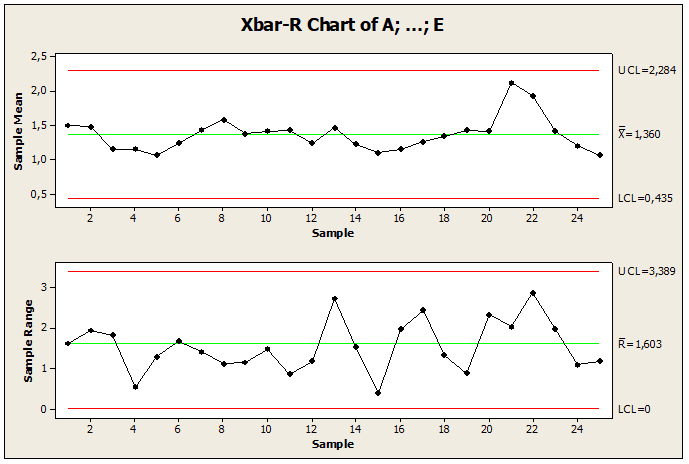
Figure 11 shows the control charts for the means, standard deviation, and the number of nonconformities measured by sampling 5 pieces in 25 lots. Through the graphs presented we can observe that there is a point outside the limit of control and is distributed around the mean, as well as it allowed us to observe the order of the magnitude of the process deviations and finally made it possible to find the points of special causes, where it presents a point outside the limit. Through these analyses, we found that there is variability of special cause in point 17 LSC, where the point is outside the control limit, requiring corrections and reduction of variability. This abnormality was detected by the Minitab Software control chart in the 1st test where the process was necessary to stabilize. So to keep the process under control, the 2nd test was applied to supplement the 1st test in order to create a new control chart that has the process under control.
Three situations were recommended when constructing the limit chart under control: removing the 3.95445 value observation, changing nonconformance values, or constructing a new chart. The 2nd test in Figure 12. Show the correction, comparison and reduction of variations in the construction of a new graph with the point under control in relation to the mean, with modification in the sampling point in order to keep the process under control. The sample value 3.95445 changed value 2.55445. After controlling the process, it was possible to compare the results obtained with the previous results between the processes. Compared to the values of the sample calculation in the process under control, the mean presented the value equal to 1.60, standard deviation 0.66 and Amplitude of the limit value 3.66. While the out-of-control process means equal to 1.68, standard deviation 0.69 and limit amplitude with value 3.81.
Figure 11: Out of Control Letter
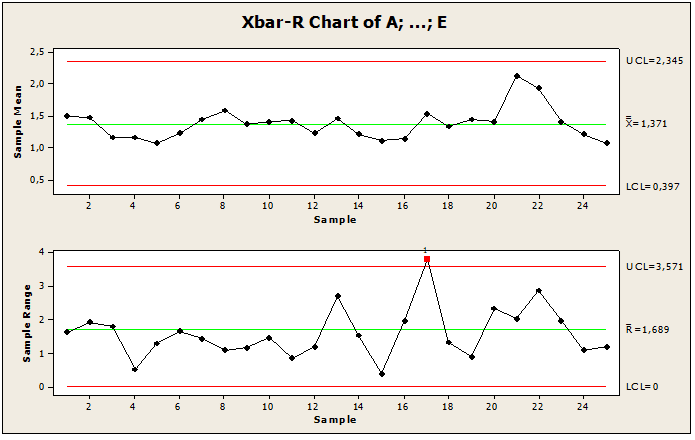
Figure 12: Letter under control
The results obtained in this study show the control charts as an effective tool in reducing variability in the applications of educational sciences by finding the stability of the process and improving quality.
4. CONCLUSION
Through the control charts of the Minitab software, it was possible to plot and analyze changes in the sample distribution in the statistical process informing critical points with variability in applications of the educational sciences. Through the analysis of the control charts we can perceive that the statistical applications presented variability.
The chart is a tool used to control abnormality by statistical tests and variability was found in some sample points of statistical applications. Therefore, there was a need to make inferences in the control of variables with out-of-control points. It was verified by the 1st test that the subgroups that are unusual compared to other subgroups presented abnormalities, and there was a need to apply the 2nd test to correct and keep the process under control.
The charts made it possible to verify variations and stabilize variables between mean parameters, standard deviations and amplitude. The graphs allowed to approximate the sampling points outside the limits and adjust defects between limits, assisting in the continuous improvement of the process, allowing to perceive defects and control causes of abnormal variation between the limited parameters of the chart under comparison of the samples in the verification tests.
Analyzing the charts in order to set limits for future inspections it would be necessary to eliminate spatial variability and after changing samples build a new graphs in minitab becomes feasible in eliminating these points for calculating the revised limits
The objectives set out in this research were successfully achieved by enabling the use of statistical techniques to identify and eliminate abnormalities that do not conform to statistical problems. Such techniques allowed inference in engineering applications through samples. Actions reduced the occurrence of variability in Minitab Software and thereby kept the stochastic process stable and under control. This theme exposed that it is possible to collect, analyze and interpret data through control charts, because through this tool it is possible to verify abnormality in statistical problems.
It is found that the statistical software is able to meet the specifications in process control. It was verified the need to use Minitab to prevent possible causes of variability. Finally, with the present study of variability, it was possible to perceive and understand the contribution of the resources of the control charts by applying the software in the reduction of abnormality in statistical science applications.
REFERENCES
BORTOLOTTI, S. L. V. et al. Análise da qualidade do produto final no processo de envase de azeitonas verdes. Tecnol. & Hum., Curitiba, ano 23, n. 36, jan/jun. 2009. Disponível em: https://revistas.utfpr.edu.br/rth/article/viewFile/6238/3889
CARPINETTI, L. C. R. Gestão da Qualidade, Conceitos e Técnicas. São Paulo: Atlas S.A., 2010.
CARPINETTI, L. C. R. Gestão da Qualidade: Conceitos e Técnicas. São Paulo: Atlas, 2010.
CARPINETTI, L. C. R. Gestão da Qualidade: Conceitos e Técnicas. São Paulo: Atlas, 2010.
CASTRO, D. R. C. et al. A aplicabilidade dos gráficos de controle nas empresas como modelo de inspeção para a avaliação da qualidade. In: XXXII Encontro Nacional de Engenharia de Produção. Bento Gonçalves, RS, 2012. Disponível em: http://www.abepro.org.br/biblioteca/enegep2012_tn_stp_158_921_20804.pdf
CHAVES, J. B. P. Controle de Qualidade na Indústria de Alimentos. Viçosa,
MG, (s.n.), 1997.
CHAVES, J. B. P.; TEIXEIRA, M. A. Controle Estatístico de Qualidade:
inspeção por amostragem/ mapas de controle. DTA/UFV. Viçosa, MG: (s.n.), p. 162,
1997.
CORTIVO, Z. D. Aplicação do Controle Estatístico de Processo em sequências curtas de produção e análise estatística de processo através do planejamento econômico. Curitiba: Universidade Federal do Paraná, 2005.
FERREIRA, J. M.; OLIVEIRA, M. S. de. Controle estatístico da qualidade. Lavras: UFLA/FAEPE, p.87, 2008.
GADELHA, G. R. de O.; MORAIS, G. H. N. Análise do Processo de Desperdício de Embalagens em uma Indústria Alimentícia: Aplicação das Quatro Primeiras Etapas do MASP. Fortaleza-SC: XXXV ENEGEP, 2015.
GADELHA, G. R. de O.; MORAIS, G. H. N. Análise do Processo de Desperdício de Embalagens em uma Indústria Alimentícia: Aplicação das Quatro Primeiras Etapas do MASP. Fortaleza-SC: XXXV ENEGEP, 2015.
HORA, H. R. M., COSTA, H. G. Tomada de decisão no MASP: uma contribuição para decisões utilizando a matriz AHP. XXIX Encontro Nacional de Engenharia de Produção. Salvador. ENEGEP, 2009.
IPEK, H. et al. The application of statistical process control. Minerals Engineering, Vol. 12, Issue 7, p. 827-835, 1999. ISSN 0892-6875. Disponível em: https://doi.org/10.1016/S0892-6875(99)00067-9.
JURAN, J. M.; GRYNA, F. M. Controle da Qualidade: Métodos Estatísticos Clássicos Aplicados à Qualidade. São Paulo, Ed. Makron, 1992.
LAGO NETO, J. C. do. O efeito da autocorrelação em gráficos de controle para variável contínua: Um estudo de caso. Florianópolis, 1999.
MAGALHÃES, M. S. de; MOURA NETO, F. D. Economic-statistical design of variable parameters non-central chi-square control chart. Production, v. 21, n. 2, p. 259–270, 2011.
MICHEL, M. H. Metodologia e Pesquisa Científica em Ciências Sociais: Um Guia Prático para Acompanhamento da Disciplina e Elaboração de Trabalhos Monográficos. São Paulo: Atlas, 2005.
MINITAB. Conheça o Minitab para Windows. 1º. ed. São Paulo: Editora Minitab
Inc., 2010.
MONTGOMERY, D. C. Estatística Aplicada e Probabilidade para Engenheiros. Tradução e revisão técnica Verônica Calado. Rio de Janeiro, LTC, 2015.
MONTGOMERY, D. C. Introdução Ao Controle Estatístico Da Qualidade. 4. ed. Rio de Janeiro: LTC, 2009.
MONTGOMERY, D. C. Introdução ao Controle Estatístico de Qualidade. 3. ed. Rio de Janeiro: LTC, 1997.
MONTGOMERY, D. C. Introdução ao Controle Estatístico de Qualidade. 4. ed. Rio de Janeiro: LTC, 2004.
MONTGOMERY, D. C. Introdução ao Controle Estatístico de Qualidade. 3. ed. Rio de Janeiro: LTC, 2013.
MONTGOMERY, D. C. Introdução ao controle estatístico de qualidade. Rio de Janeiro: LTC, 2016.
OLIVEIRA, T. S.; LIMA, R. H. P. Aplicação do controle estatístico de processo na mensuração da variabilidade em uma usina de etanol. Anais. INGEPRO Inovação, Gestão e Produção, v. 3, n. 6, p. 022-033, 2015.
OLIVEIRA, V. F. de. Mobilidade e acessibilidade urbana: uma análise socioespacial a partir dos bairros Jardim Morada do Sol e Conjunto Habitacional Ana Jacinta, em Presidente Prudente. Faculdade de Ciências e Tecnologia – FCT, Unesp, 2011.
PALLADINI, E. P. et al. Gestão da Qualidade: Teoria e Casos. 2. Ed. São Paulo: Atlas, 2010.
PEDRINI, D. C. Proposta de um método para aplicação de gráficos de controle de regressão no monitoramento de processos. Universidade Federal do Rio Grande do Sul: UFRGS, 2009.
PEREIRA, A.; PATRÍCIO, T. Guia prático de utilização: análise de dados para Ciências Sociais e Psicologia. 8.ª ed. Lisboa : Sílabo, 2013.
REBELATO, M. G. et al. Estudo sobre a aplicação de gráficos de controle em processos de saturação de papel. XIII SIMPEP. Bauru, SP: 2006.
RIBEIRO, J. L.; CATEN, C. T. Controle estatístico de processos: Apostila de Curso. Porto Alegre: UFRGS, 2012.
RICHARDSON, R. J. Pesquisa social: métodos e técnicas. 3 ed. São Paulo: Atlas, 1999.
RICHARDSON, R. J. Pesquisa social: métodos e técnicas. São Paulo: Atlas, 1999.
RODRIGUES, G. P. Controle Estatístico de Qualidade e de Processo na Indústria de Alimentos. Universidade Federal de Viçosa, MG, p. 152,1998.
ROSA, L. C. Introdução ao Controle Estatístico de Processos. Santa Maria, Ed. Da UFSM, 2009.
SIQUEIRA, L. G. P. Controle Estatístico de Processos – Equipe Grifo – Série Qualidade Brasil. São Paulo: Pioneira, 1997.
SOUZA, A. M., RIGÃO, M. H. Identificação de variáveis fora de controle em processos produtivos multivariados. Revista Produção, São Paulo, V.15 no.1, p.74-86, abr. 2005.
SOUZA, R. Case Research in Operations Management. EDEN Doctoral Seminar on Research Methodology in Operations Management, Brussels, Belgium, 2005.
SPIEGEL, M. R.; STEPHENS, L. J. Schaum’s esboço de teoria e problemas de estatística: Aprenda a si mesmo. 4ª ed., Rio de Janeiro: LTC, 2007.
TRIVELLATO, A. A. Aplicação das sete ferramentas básicas da qualidade no ciclo PDCA para melhoria contínua: estudo de caso numa empresa de autopeças. Trabalho de conclusão de curso, Universidade de São Paulo, 2010.
VIEIRA, S. Estatística para a qualidade: como avaliar com precisão a qualidade em produtos e serviços. Rio de Janeiro: Elsevier, 1999.
VILAÇA, A. C.; OLIVEIRA, R. C. B. Utilização do Controle Estatístico de Processo para Avaliação de Peso de Massas para Pastel. FAZU em Revista, Uberaba, n. 8, p. 137-146. 2011.
WERKEMA, M. C. C. Avaliação de sistemas de medição. 2.ed. Belo Horizonte: Werkema. 2012.
WERKEMA, M. C. C. Ferramentas estatísticas básicas para o gerenciamento de processos. Belo Horizonte: Werkema, 2006.
YIN, R. K. Estudo de caso: planejamento e métodos. 2. Ed. Porto Alegre: Bookman, 2001.
[1] Master in Process Engineering – PPGEP/ITEC-UFPA.
[2] Doctor in Natural Resources Engineering from the Federal University of Pará.
Submitted: April, 2021.
Approved: June, 2021.