ORIGINAL ARTICLE
LACERDA, Fábio Henrique de Souza [1]
LACERDA, Fábio Henrique de Souza. The importance of descriptive statistics in the COVID-19 pandemic. Revista Científica Multidisciplinar Núcleo do Conhecimento. Year 05, Ed. 08, Vol. 02, p. 05-14. August 2020. ISSN: 2448-0959, Access link: https://www.nucleodoconhecimento.com.br/mathematical-olympiads/descriptive-statistics
ABSTRACT
With the advancement of the COVID-19 pandemic in the world, several countries had to adopt strict restrictive measures to try to stop the spread of this virus. Therefore, the objective of this work is to show the importance of descriptive statistics and how they have helped these countries to make decisions. The development of this bibliographic research will be based on national and international authors, using research in books and articles in the period between 1980 and 2020. Statistics has always been fundamental in all areas of knowledge and today we are seeing how much it has contributed to the fight of COVID-19.
Keywords: Descriptive statistics, COVID-19, importance of statistics.
1. INTRODUCTION
Since the new coronavirus outbreak (SARS-CoV-2), which originated in China, the cause of COVID-19, has brought great concern to the population, which has paralyzed large nations and spread rapidly in several places in the world, with different impacts (FREITAS; NAPIMOGA; DONALISIO, 2020)
And to help fight this virus, math has been one of the main areas of help. For Chaoubah (2020), mathematical models are important to be able to estimate the number of cases in various scenarios, thus helping many decision makers to reach an objective solution, for example, being able to help determine the number of beds available in hospitals in certain regions.
Therefore, one of the specific areas of mathematics that helps in the process of combating COVID-19 is statistics, which is an essential tool in all sciences, whether exact, health or human.
According to Crespo (2002), statistics is one of the very important areas of applied mathematics, having as specific objectives to provide methods for collection, description, organization, and those mentioned above are part of descriptive statistics. And the analysis and interpretation of data is part of inferential statistics.
The objective of this work is to emphasize the importance of descriptive statistics in the face of COVID-19 and also, of how they have helped these countries to make decisions. For this, we will use bibliographic research in books and mainly scientific articles.
2. DESCRIPTIVE STATISTICS
According to Costa (2011, p. 19), defines descriptive statistics as:
É aquela que possui um conjunto de técnicas para planejar, organizar, coletar, resumir, classificar, apurar, descrever, comunicar e analisar os dados em tabelas, gráficos ou em outros recursos visuais, além do cálculo de estimativas de parâmetros representativos desses dados, interpretação de coeficientes e exposição que permitam descrever o fenômeno
At first, descriptive statistics has as its main characteristic the organization of data, but sometimes we end up facing a large mass of data and the organization does not become a simple task as we can imagine.
This area of statistics is known for being used in situations where a large amount of information is found, and it is necessary to make it compact to be able to work with the data. (PEREIRA, 2019).
3. THE IMPORTANCE OF STATISTICS
According to David Coggon (2015), statistical procedures have contributed to many of the successes of modern medicine, saving many lives. Therefore, the maximum number of health professionals should know, at least, the relevant basic mechanisms.
And so, statistics have helped health professionals to face decision-making in this pandemic, for Chaoubah (2020), statistical analyzes showed that some measures used to reduce the number of contagion of the coronavirus resulted in the reduction of cases , which, for example, were the most appropriate policies for social distancing. They were the ones who made governments adopt this restriction measure, which in turn, showed a better diagnosis and some of the countries that adopted this measure were Italy and the United Kingdom.
It is based on statistical data that governments have formed discussions in search of efficient strategies to combat the spread of the virus.
4. THE MOST USED RESOURCES OF DESCRIPTIVE STATISTICS
From the point of view of Guedes et al (2005, p. 1):
A estatística descritiva, cujo objetivo básico é o de sintetizar uma série de valores de mesma natureza, permitindo dessa forma que se tenha uma visão global da variação desses valores, organiza e descreve os dados de três maneiras: por meio de tabelas, de gráficos e de medidas descritivas.
4.1 TABLES
The table is one of the easiest ways to show and summarize the data, making it better to observe and interpret the values. Its purpose is to present data with clarity and quick understanding (CALVO, 2004).
4.1.1 PRIMITIVE TABLE
The tables, known as primitive and role, are used in data views that do not show an organization of numbers, which is also known as raw data.
Table 4.1- The number of deaths from COVID-19 in Brazil daily in 30 days, from 04/17/20 to 05/16/20.
| Date | The amount | Date | The amount | Date | The amount |
| 17/04 | 210 | 27/04 | 310 | 07/05 | 610 |
| 18/04 | 216 | 28/04 | 496 | 08/05 | 751 |
| 19/04 | 109 | 29/04 | 434 | 09/05 | 730 |
| 20/04 | 116 | 30/04 | 428 | 10/05 | 496 |
| 21/04 | 167 | 01/05 | 442 | 11/05 | 396 |
| 22/04 | 166 | 02/05 | 396 | 12/05 | 881 |
| 23/04 | 403 | 03/05 | 294 | 13/05 | 749 |
| 24/04 | 368 | 04/05 | 277 | 14/05 | 844 |
| 25/04 | 359 | 05/05 | 600 | 15/05 | 824 |
| 26/04 | 197 | 06/05 | 615 | 16/05 | 816 |
Source: State Health Departments. Brazil, 2020
Thus, in this primitive table we can see that it has no order, and it is difficult for those who are viewing it to find out which day there was a greater or lesser number of deaths. It contains the raw data without any organization.
4.1.2 ROLL
According to Waldir Medri (2011), through the list, we can more clearly and quickly compose the set, quickly verifying the highest and lowest value of the numbers, in addition to some data that can be repeated many times. In this way, you can obtain the behavior of the data more quickly.
Table 4.2 – The number of deaths from COVID-19 in Brazil daily in 30 days, from 04/17/20 to 05/16/20.
| Date | The amount | Date | The amount | Date | The amount |
| 19/04 | 109 | 25/04 | 359 | 05/05 | 600 |
| 20/04 | 116 | 24/04 | 368 | 07/05 | 610 |
| 22/04 | 166 | 02/05 | 396 | 06/05 | 615 |
| 21/04 | 167 | 11/05 | 396 | 09/05 | 730 |
| 26/04 | 197 | 23/04 | 403 | 13/05 | 749 |
| 17/04 | 210 | 30/04 | 428 | 08/05 | 751 |
| 18/04 | 216 | 29/04 | 434 | 16/05 | 816 |
| 04/05 | 277 | 01/05 | 442 | 15/05 | 824 |
| 03/05 | 294 | 28/04 | 496 | 14/05 | 844 |
| 27/04 | 310 | 10/05 | 496 | 12/05 | 881 |
Source: State Health Departments. Brazil, 2020
Now, with relative ease, we can know the minimum and maximum number of deaths in this period of time and determine the date of occurrence.
4.2 GRAPHICS
According to Crespo, (2002, p.21) defines a graph as:
O gráfico estatístico é uma forma de apresentação dos dados estatísticos, cujo objetivo é o de produzir, no investigador ou no público em geral, uma impressão mais rápida e viva do fenômeno em estudo, já que os gráficos falam mais rápido.
Graphs are one of the most used tools by the media to show the dispersion of values. It facilitates the understanding of the public, as it achieves the fastest printing of the data being exposed.
There are several types of graphs, such as line graph, bar graph, sector graph, among others. But, the graph to be presented here is that of sectors.
4.2.1 SECTOR GRAPHIC
Sônia Vieira (1980, p. 20), explains some details of this graph;
Para fazer um gráfico de setores, primeiro se traça uma circunferência que, como se sabe, tem 360°. Essa circunferência representa o total, ou seja 100%. Dentro dessa circunferência devem ser representadas as categorias da variável em estudo.
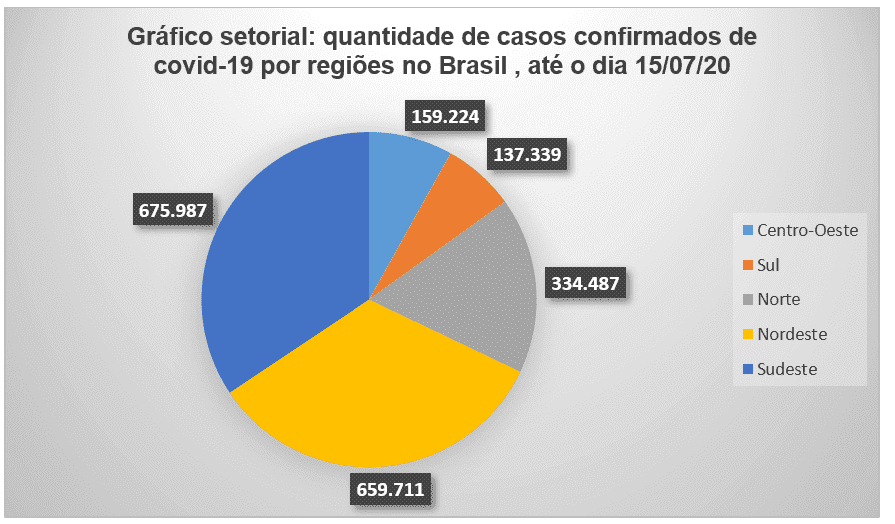
Example: Number of confirmed cases of COVID-19 by regions of Brazil, until 07/15/20.
Table 4.3 – Number of confirmed cases of COVID-19 by regions of Brazil, until 07/15/20.
| Regions | Quantidade de casos |
| Midwest | 159.224 |
| South | 137.339 |
| North | 334.487 |
| North East | 659.711 |
| Southeast | 675.987 |
| Total | 1.966.748 |
Source: State Health Departments. Brazil, 2020
In this way, we have to:
Figure 4.1
4.3 CENTRAL TREND MEASURES
For Azevedo (2016, p. 142), he defines this measure as:
As medidas de tendência central ou promédios são valores que servem para representar a distribuição como um todo, além de possibilitarem o confronto entre distribuições. Das principais medidas de tendência central destacamos aqui a média aritmética e a mediana.
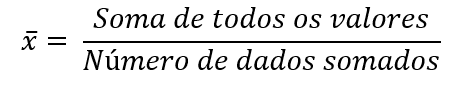
4.3.1 ARITHMETIC AVERAGE
The simple arithmetic mean or known just mean, is obtained through a set of data, it is enough to divide the total of the sum of values of the set by the amount of elements that it has (FALCO and JUNIOR, 2012)
4.3.2 MEDIAN
Maytê Pereira (2019) emphasizes that the median is the measure of central positioning, in a simple way it is the value that is in the middle of a set of data that are placed in ascending or descending order.
If the amount of data is odd, it is much easier to find the median, as it will be the number that is in the center of the set. If the amount of data is even, it will be necessary to find the average of the two values that are in the center and thus, the value found is the median.
4.3.3 FASHION
The mode of a dataset is the value that occurs most frequently. A dataset can have one mode, more than one mode, or no mode (LARSON; FARBER, 2015).
5. CONCLUSION
Statistics have been making a difference in the middle of this pandemic, contributing significantly. It has helped health professionals and other areas to face decision-making
With the tools of descriptive statistics, we saw how much it is present in the fight against COVID-19. It was shown through examples that it has been fundamental in planning strategies, decision making and data organization.
Therefore, it is necessary to be aware of the importance of this area of statistics, as it has been shown in the media daily, through tables, graphs and descriptive measures. Therefore, she deserves all the attention in this difficult time that the country has been suffering with the number of deaths.
REFERENCES
AZEVEDO, Paulo Roberto Medeiros de. Introdução à estatística [recurso eletrônico] / Paulo Roberto Medeiros de Azevedo. – 3. ed. – Natal, RN : EDUFRN, 2016.
CALVO, M. C. M. Estatística descritiva. Florianópolis: UFSC, 2004.
COGGON, David – a importância da estatística na pesquisa em saúde, 2015.
COSTA, Paulo Roberto da. Estatística. Santa Maria: Universidade Federal de Santa Maria, Colégio Técnico Industrial de Santa Maria, Curso Técnico em Automação Industrial, 3. ed., 2011.
CRESPO, Antônio Arnot. Estatística fácil – 17. ed – São Paulo. Saraiva, 2002
DIEHL, C. A.; SOUZA, M. A.; DOMINGOS, L. E. C. O uso da estatística descritiva na pesquisa em custos: análise do XIV congresso brasileiro de custos, Porto Alegre, v. 7, n. 12, 2º semestre de 2007.
FALCO, Javert; JUNIOR, Roberto. Estatística. Curitiba – PR, 2012
FREITAS, ARF; NAPIMOGA, MH; DONALISIO, MR. Análise da gravidade da pandemia de Covid-19; Universidade Estadual de Campinas, Departamento de Saúde Coletiva, Campinas, SP, Brasil.
LARSON, Ron. Estatística aplicada / Ron Larson, Betsy; Farber ; tradução José Fernando Pereira Gonçalves; revisão técnica Manoel Henrique Salgado. — São Paulo : Pearson Education do Brasil, 2015.
MEDRI, Waldir. Análise exploratória de dados. Londrina/PR, 2011.
Painel de casos de doença pelo coronavírus 2019 (COVID-19) no Brasil pelo Ministério da Saúde: disponível em <https://covid.saude.gov.br/>
PEREIRA, Maytê – Estatística Descritiva Básica: o que é e para que serve,2019.
UFJF NOTÍCIAS. Pesquisador explica como a estatística ajuda no combate à Covid-19. 2020. Disponível em: <https://www2.ufjf.br/noticias/2020/04/22/pesquisador-explica-como-a-estatistica-ajuda-no-combate-a-covid-19/>.
VIEIRA, Sonia. Introdução à Bioestatística – 3 ed. Revista e 3 ed. Ampliada, – Rio de Janeiro: Elsevier, 1980 – 16° reimpressão.
[1] Graduating in Full Degree in Mathematics and Graduating in the Higher Technologist Course in Financial Management.
Sent: July, 2020.
Approved: August, 2020.