ORIGINAL ARTICLE
FERREIRA, Hugo Silva [1], MELO, Ronnan Hudson Jardim de [2], OLIVEIRA, Anderson Augusto [3]
FERREIRA, Hugo Silva. MELO, Ronnan Hudson Jardim de. OLIVEIRA, Anderson Augusto. Organizational Charts – The Importance of Sectorization and Definition of Positions and Functions in Companies. Revista Científica Multidisciplinar Núcleo do Conhecimento. Year 06, Ed. 03, Vol. 07, pp. 124-138. March 2021. ISSN: 2448-0959, Access link: https://www.nucleodoconhecimento.com.br/business-administration/importance-of-sectorization
SUMMARY
Based on the need of companies to define a modern organizational structure well accepted by employees, the option for sectorization with the use of organization charts is positive and functional. In this article, different configurations of existing organization charts are described, and you can evaluate which option is ideal for applying in a given company. By putting into practice the chosen organization chart, the productive flow and provision of services tends to become efficient with regard to the flow of command information and tasks, totally consistent with the definitions of function of each professional. It was used as a scientific method for the composition of this article exploratory bibliographic research in other scientific journals, which are a reference for qualitative construction of the theme on display. However, this work hopes to instigate new research on the subject and expose the importance of sectorization and definition of positions within companies.
Keywords: Organization charts, Competency management, Efficient management, Process management, Planning and production.
1. INTRODUCTION
As part of the strategy of good organizational management, an alternative to be explored is the graphic representation called organization chart, which serves to illustrate the detailed organizational structure of a company, in order to define the responsibilities of the teams or sectors, as well as their functional limits, transacting the entire structure of the company and optimizing the systemic vision of the employees involved.
When a company chooses to use an organization chart, the need to develop a better understanding of the responsibilities of the sectors, its leaders and its operational employees, their potential growth and the collaborative vision of promotional growth stands out. In relation to operational, tactical and strategic decisions, the organization chart defines and graphically represents the methodical and organized vision to have the most coherent decisions. Therefore, the use of an organization chart generates an optimized view of the disposition of departmental positions and functions in a clear and objective way.
In addition to defining hierarchical levels of employees, this type of graphic representation brings agility in the perception of the areas of a company. As stated by Marcela Peradelles (2016), there are 3 types of planning (strategic, tactical and operational), all of which are essential to define the company’s success by achieving its predefined objectives. In order for a planning to reach its proposed objective, it is strictly necessary that all employees get involved, regardless of the hierarchical level, and communicate transparently.
To exemplify, we will then talk about the three types of planning.
Strategic Planning refers to the organization’s vision of the future, which is usually one of the factors that influences, externally and internally, the values, mission and vision of the organization. The decisions made at the strategic level are the responsibility of the company’s executive positions, being, for the most part, CEO, chairman, board of directors or board of directors, varying according to the hierarchical structure of the organization.
Strategic actions are usually long-term and defined according to the size of the company, as they seek a future and broad vision that does not characterize operational details and specific goals for its fulfillment. This planning should be continuously updated, because the other levels responsible for setting goals can influence the reality of the facts and data of medium and short-term decisions, in order to ensure that the planning is executed.
Tactical Planning, in turn, is responsible for creating goals and decisions of employees who occupy senior management and operational positions, in a more specific planning compared to the strategic one. Its execution time also varies according to the size of the company, but, in any case, actions are measured in the medium term, ensuring that strategic planning is fulfilled. Your decisions may be limited at the departmental level according to the organization chart of the company. In terms of detail, unlike strategic actions, there is a higher level of detail and is a tool that translates the strategic study into concrete plans.
Operational Planning is a short-term planning in which all levels of the organization are involved. From this planning, the actions and goals come out, often daily, to ensure the tactical and, in turn, strategic plan of the organization. At this hierarchical level, there are workers and employees who are directly linked to the execution of planned tasks at the tactical level.
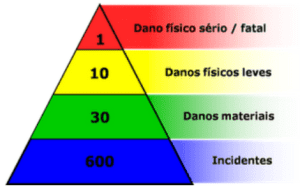
Figure 1 represents the differentiation of the hierarchical levels of an organization:
Figure 1: Pyramid of hierarchical levels.
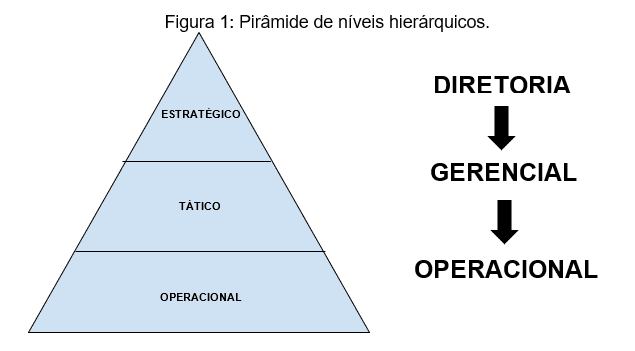
The organization chart is the graphic representation of these hierarchical levels, sectorizing the functions and representing the positions of each area of the company.
According to Lawrence A. Appley (1970) apud Yolanda F. Balcão (2019), people produce more when they know what they do, know what their hierarchical positions are and their interpersonal relationships in the organization.
2. CHARTS
When it comes to the history of the creation of the graphic representation called the organization chart, there are several divergences of its emergence. According to Org Charts (2014), there are reports pointing to the Egyptians as creators and the first to use graphs to illustrate division of tasks and hierarchy of power for the construction of pyramids, but this emergence is unknown. It is also given that Daniel C. McCallum (1815-1878), American railway engineer and pioneer of the Administration, with Scottish origins, who held a position as general manager of the New York and Erie Railroad and Union Brevest Major General, was appointed as responsible for the introduction of organograms in the railway industry in 1855.
At this time, the railway industry was under financial strain caused by the lack of efficient management of its production chain, and the main factors of this management deficiency were the lack of division of responsibility and authority that the superintendents had with the managers of each department. McCallum developed a chart approved by the superior management in which he connected the superintendents to the subordinates, generating an organized structure for each division/department. McCallum developed structured org charts similar to family trees.
Because the Erie Railroad Company became one of the most successful railroads in the United States, McCallum’s techniques were copied and replicated within the organizational structures of several other companies.
To detail the concept of organization charts and understand its importance for the management of the organization of a company, it is necessary to know that, regardless of which model is adopted, some standard procedures should be followed for its elaboration. These are:
- Every organization chart should represent positions, not people;
- Most of them are represented by lines that refer to interpersonal communication of positions, pointing out the hierarchical unity attributed to them.
The walkthrough for creating an organization chart can be defined as follows:
- Evaluate the organizational structure of the company by separating the functions of each employee and each sector according to the production process or provision of services. For employees with various functions, it is necessary to verify if there is a need to organize their tasks and activities to better use their time, ensuring greater quality by focus;
- Seek to hold accountable and identify the leaders of each sector, thus defining the managers who will be responsible for the tactical planning of the company;
- Analyze the structure of the organization and what types of strategic leadership such as: board, board, chairman. With this analysis, it is defined which positions will be represented by the level of strategic planning of the corporation;
- Finally, the organization chart must be made official in document and pass on to all employees of the company, so that everyone can have better communication with their coworkers.
As noted by Marques (2018), it is extremely important that the organization chart be developed by a professional with systemic vision of the company, taking care not to generate conflicts between areas and activities of employees, besides developing the graphic scheme prioritizing simplicity for better understanding of everyone in relation to the objectives of this tool.
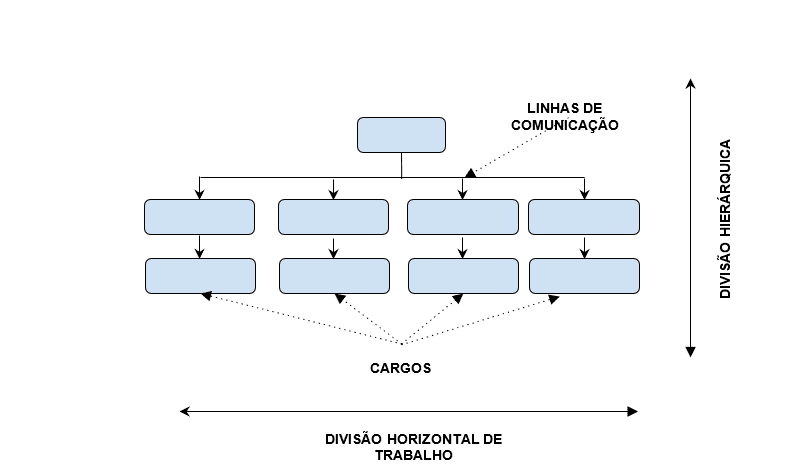
According to Kenoby (2019), the tools used for the development of an organization chart are the lines of communication that connect the work units, which are represented by the positions of the organization, as shown in Figure 2:
Figure 2: Tools used to elaborate the organization chart.
As mentioned by Masci (2017), the existing organizational chart models are vast, and can be chosen by the management according to the strategic vision that it wishes to adopt for its organization. We have listed some types of organization charts in the following topics:
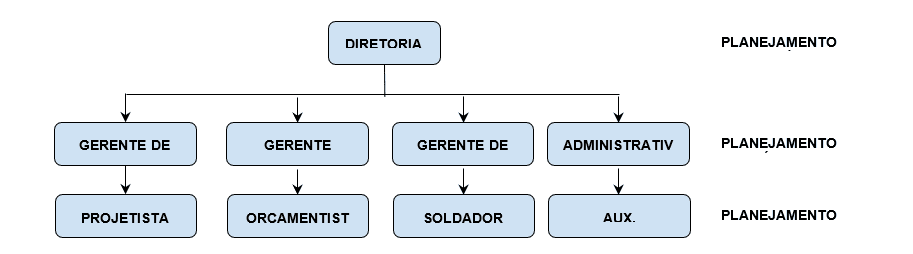
2.1 VERTICAL ORGANIZATION CHART
Also called the classic model, it is the most widely used organization chart in companies. As noted by Kenoby (2019), this type of organization chart represents the company’s board at its highest level of responsibility, while the representative blocks of the operational level are shown at the lower end of the chart. This type of organization chart follows a rigid hierarchical position, in which the hierarchical connection is made from top to bottom by the lines of communication, which are continuous lines that connect communication between positions. This is a simplified type of organization chart and makes it clear what the hierarchical levels of the company are. For the use of this organization chart, clear and objective vision should be a predominant factor. Figure 3 presents a vertical organization chart model:
Figure 3: Example of vertical organization chart.
2.2 RADIAL ORGANIZATION CHART
According to Org Charts (2019), the radial or circular organization chart is, in general, little used, but in modern companies – such as hospitals and universities, for example –, which prefer teamwork, it is usually adopted, because the objective of these companies is to soften the representation of the organizational structure, saving space and generating greater communication between the departments of the company, because its authority is developed from the center to the peripheral areas.
In this type of organization chart, the lines of authority, which are important elements for the conception of this type of representation, are distorted and difficult to identify, reducing conflicts between smaller and larger hierarchical positions.
To develop this organization chart, we need to understand that the company’s board, management or presidency begins at the center and spreads alongside the positions directly linked to it. Figure 4 presents a radial organization chart model applied in an industrial project company:
Figure 4: Example of Radial or Circular Organization Chart.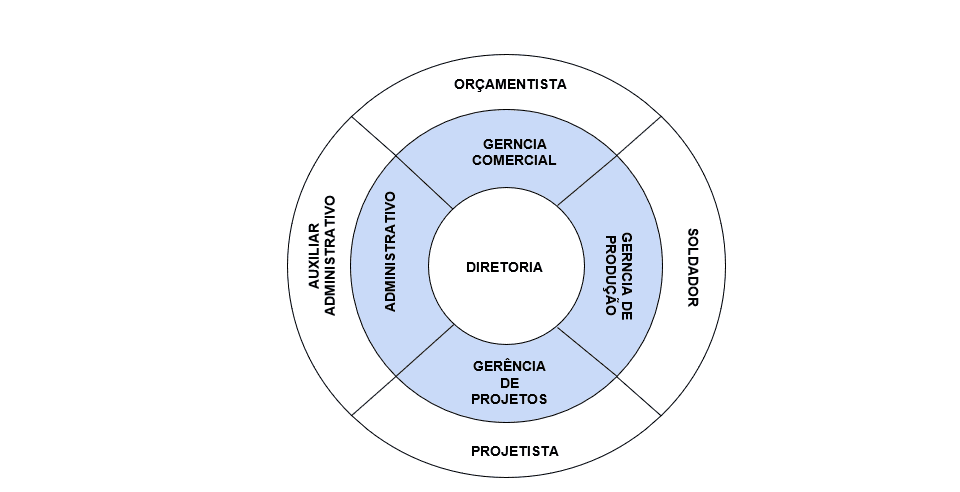
Source: Developed by the author (2019). For the representation of complex structures, this type of organization chart becomes difficult to apply, and is often even unfeasible.
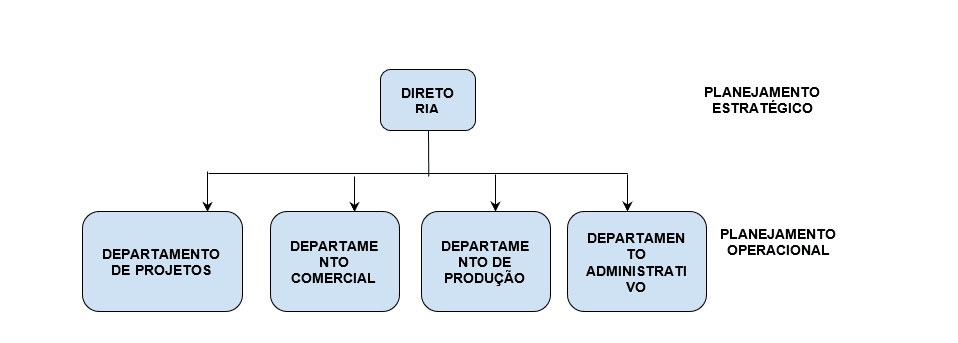
2.3 HORIZONTAL ORGANIZATION CHART
According to Diana (2019), it is the organization chart that eliminates the complexity between the distancing of the operational and strategic positions of the company, that is, it leans the hierarchical level generating a shorter distance between the operator and the board.
In this type of organization chart, the number of leaders per units of operational positions, such as managers and/or coordinators, is small; in this case, a pyramidal structure is mounted from left to right, defining the horizontal function of the organization chart, expressing this organization chart in Figure 5:
Figure 5: Horizontal Organization Chart example.
2.4 FUNCTIONAL ORGANIZATION CHART
This type of organization chart has a great similarity with the vertical organization chart, highlighting the difference by not representing the positions in a hierarchical way and, yes, by the relationship of functions within the organization. According to Renato Bezerra (2018), this type of organization chart can be separated into two submodels: Functional Type 01 and Functional Type 02:
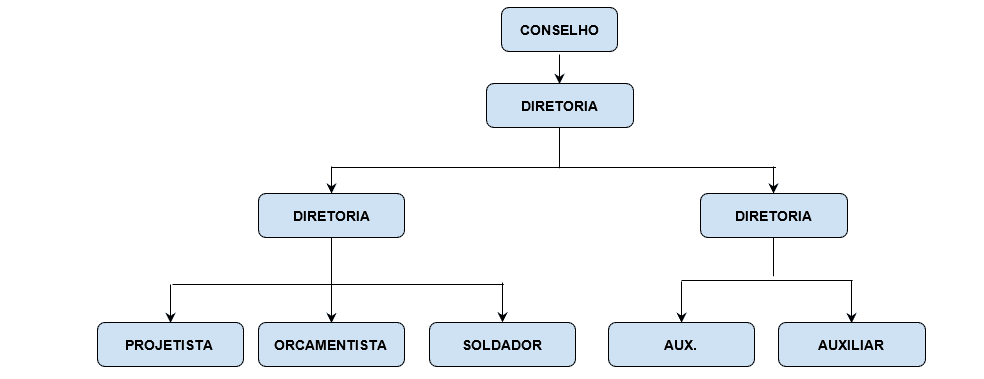
- For Functional Type 01, subordination to the hierarchical board is possible, but through boards with directors destined for each function of the organization. The links indicate a temporary subordination and the attention involving the updating of this organization chart is necessary, because as soon as the employee finishes his task or activity, the subordination changes to the new coordinator or supervisor in charge of the new activity to be performed, highlighting this type of structure as being an organization without immediate hierarchical head. Figure 6 represents a Type 1 Functional Organization Chart model:
Figure 6: Example of Functional Organization Chart of Type 01.
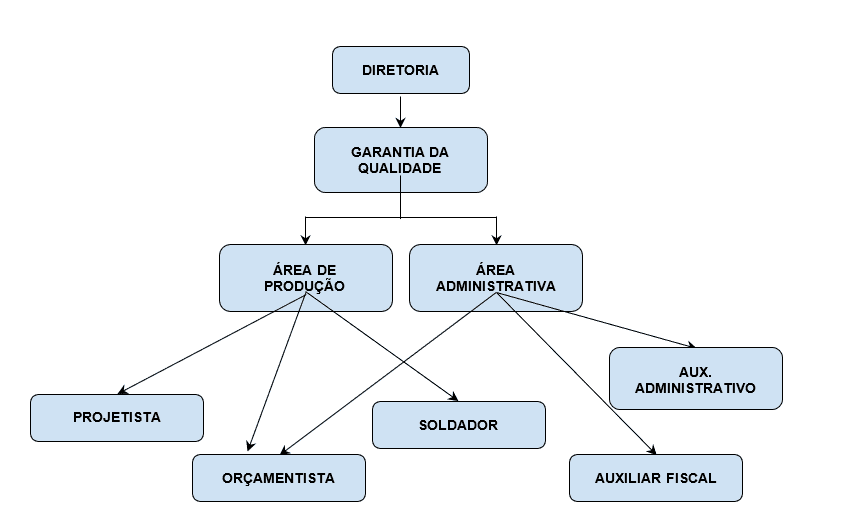
Source: Developed by the authors (2019).
- The Functional Organization Chart of Type 02 is applied in small organizations, with little verticalization of the command hierarchy and with few heads for various activities. Figure 7 presents a Type 2 Functional Organization Chart model:
Figure 7: Example of Functional Organization Chart type 02.
Source: Developed by the authors (2019).
2.5 MATRIX ORGANIZATION CHART
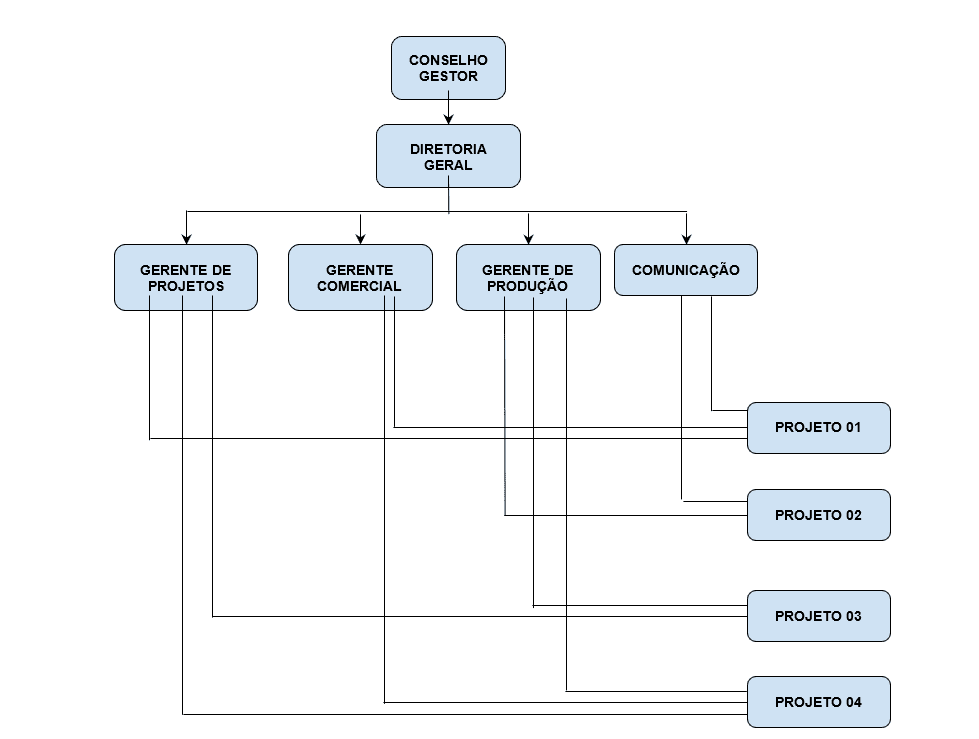
Similar in structure to the vertical model, the matrix organization chart does not have a clear unit of function, as it presents the working group, which can often be temporary and be changed with total flexibility according to new strategic or tactical definitions of the companies. The process of building a matrix organization chart composes the union of the traditional structure and the structure by projects of the organization, that is, the responsibility of the assembly of the organization chart is divided between the board, which is the political or administrative authority, and the project leader, which is the technical authority.
According to Renato Bezerra (2018), the feeling of being commanded by two “leaders” is always present and, despite being a difficult task to implement, because of the difficulty in reconciling the two structures of power by friction in matters of authority, this organization chart presents greater mobility and flexibility compared to other organizational structures. An example of a matrix organization chart is presented in Figure 8:
Figure 8: Matrix Organization Chart example.
Source: Developed by the authors (2019).
2.6 LINEAR ORGANIZATION CHART
The linear organization chart of responsibilities is a type of organization chart that escapes the rule of similarity of the other, by its disposition and form of graphic representation. According to Renato Bezerra (2018), this type of organization chart is not related to the hierarchical structure of the company existing between the positions, but focuses on the exposure of those responsible for each activity within the organization. In this sense, its characteristic can be loosely compared to the matrix organization chart.
In summary, the linear organization chart presents the activity of each sector of the company, identifying the person responsible for that activity. Remembering that this model of organization chart in companies with complexity of positions and functions becomes unfeasible for its graphic simplicity, as shown in Table 1:
Table 1: Linear Organization Chart example.
| Activity/Function | Project Manager | Production Manager | General Manager |
| Draw up proposals | |||
| Weld structure | |||
| Release Payment | |||
| Issue Invoice | |||
| O – Decides X – Executes # – Participates Δ – Controls | |||
Source: Developed by the authors (2019).
2.7 ORGANOGRAM IN BARS
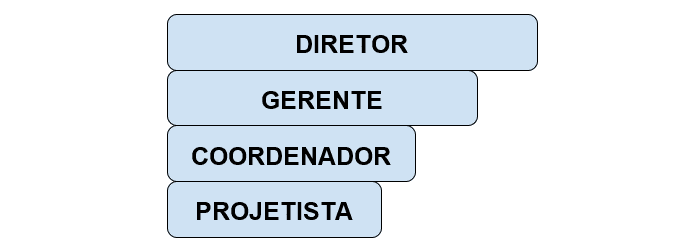
It is another type of organization chart that escapes the general rule of representation, because as Renato Bezerra (2018) observes, this model presents a graphic form that exposes only the proportion of responsibility (authority) of each position, as shown in Figure 9. The bar organization chart excludes the interaction/relationship between company positions.
Figure 9: Example of Organization Chart in Bars.
3. METHODOLOGY
The study of organization charts and hierarchical structure of companies was developed in this article in a single step. The exploratory and explanatory methodology was defined as a way to identify, analyze and conclude on the subject in question, based on the literature available in specific articles and literature. The exploratory research allowed a greater familiarity with the subject, and the process of probing the theme at didactic criteria converges to a greater simplification of the theme, generating new forms of interpretation of the subject, developing a critical view to the points exposed. Thus, it was possible to assume a posture of case study exposure, generating consonance with sources that corroborate the subject addressed.
4. FINAL CONSIDERATIONS
After studying on the subject, it can be considered that the organization chart is a graphic form and also an extremely important administrative tool for a good organization of the organizational structure of companies. With the use of the organization chart, it is possible to simplify the structure of a company and make it more transparent for the critical analysis of positions and functions at the managerial level in the pointing of tasks and activities according to the strategic, tactical and operational plan. Without the organization chart, other activities and representations such as the flow of production process, routine decision making, focus of the short, medium and long term, definitions of specific objectives and results can be clearly affected due to the hierarchical disorder of the company.
REFERENCES
BALCÃO, Yolanda Ferreira. Organograma: representação gráfica da estrutura. Scielo, São Paulo, SP. Disponível em: http://www.scielo.br/scielo.php?script=sci_arttext&pid=S0034-75901965000400003. Acesso em: fev. 2019.
BEZERRA, Renato. Organograma. Slide Player. Disponível em: https://slideplayer.com.br/slide/13999247/. Acesso em: fev. 2019.
DIANA, Daniela. Organograma. Toda Matéria. Disponível em: https://www.todamateria.com.br/organograma/. Acesso em: abr. 2019.
KENOBY. Tipos de organograma. Kenoby. Disponível em: http://www.kenoby.com/blog/tipos-de-organograma/. Acesso em: mar. 2019.
MARQUES, José Roberto. 7 tipos de organograma para utilizar em sua gestão. JRM Coaching, São Paulo, SP, 19 dez. 2018. Disponível em: https://www.jrmcoaching.com.br/blog/7-tipos-de-organograma-que-voce-deve-utilizar-em-sua-gestao/. Acesso em: fev. 2019.
MASCI. Organograma de empresa: qual a importância e como elaborar? Masci Consultoria, Juiz de Fora, MG, 20 abr. 2017. Disponível em: https://www.masciconsultoria.com.br/organograma-de-empresa/. Acesso em: fev. 2019.
ORGANOGRAMAS. História do Organograma. Organogramas, 19 jun. 2014. Disponível em: http://organogramas.blogspot.com/2014/06/historia-do-organograma.html. Acesso em: maio 2019.
ORGANOGRAMAS, Organograma Radial ou Circular. Organogramas 1 tc, Pombal, Portugal. Disponível em: https://organogramas1tc.webnode.pt/tipos-de-organigramas/o-organograma-radial-ou-circular/. Acesso em: maio 2019.
PERADELLES, Marcella. A diferença entre o planejamento estratégico, tático e operacional. Blog da Qualidade, Cornélio Procópio, Paraná, 19 abr. 2016. Disponível em: https://blogdaqualidade.com.br/a-diferenca-entre-o-planejamento-estrategico-tatico-e-operacional/. Acesso em: abr. 2019.
[1] Postgraduate in Higher Education Teaching, MBA in People Management and Corporate Education, Bachelor of Administration, Technologist in Management Processes.
[2] Bachelor’s degree in Mechanical Engineering from the Pontifical Catholic University of Minas Gerais.
[3] Master of Business Administration
Submitted: November, 2020.
Approved: March, 2021.