SILVA, José de Paula [1]
SILVA, José de Paula. Exploratory spatial data analysis of Dengue fever in the State of São Paulo in Brazil. Multidisciplinary Core scientific journal of knowledge. 03 year, Ed. 06, vol. 01, pp. 136-144, June 2018. ISSN:2448-0959
Summary
Objective: to evaluate the space groups in the incidence of Dengue fever in the State of São Paulo between the months of January to may 2015.
Methods: this study with population of cases of dengue fever confirmed notifications, autochthonous, municipality of the State of São Paulo, between the months of January to may 2015 2015. The spatial correlation and its groups were evaluated by the indexes of Moran globality and locality.
Results and discussion: the distribution of the incidence rate of Dengue fever in the first months of 2015 presented spatial distribution pattern, i.e. the presence of groups or clusters, in specific regions of the State of São Paulo in Brazil. Groups with high incidence rates were observed in the meso-regions of Assisi, Araçatuba, São José do Rio Preto, Bauru, Araraquara and Campinas in Presidente Prudente.
Conclusions: the incidence rate and their respective groups have shown that there is a pattern of Dengue group. So the exploratory analysis of spatial data can be a crucial tool in interventions aimed at the prevention and control of the disease.
Keywords: Dengue, GIS, Spatial Exploratory Data Analysis.
Introduction
Dengue is an acute febrile, which affects the man, being considered a public health problem in the world. The Arbovirus is genus Flavivirus with four serotypes are known: DENV1, DENV3, and DENV2 DENV4.
He is currently widespread in tropical and subtropical countries, whose environmental conditions favour the development and proliferation of Aedes aegypti and Aedes albopictus (PENNA, 2010).
Dengue fever in Brazil has presented temporal patterns with respect to your transmission and consequent manifestation, leading to the appearance of epidemic peaks in some months of the year.
So weather variables including temperature and rainfall influence the dynamics of vector and therefore the incidence of the disease (VIANA and IGNOTTI, 2013).
Various Dengue prevention strategies have been adopted and recommended, these include the provision of epidemiological indicators that can support the definition of groups and priority areas for the control (BRAZIL, 2014C).
Data from the epidemiological surveillance Center of Sao Paulo shows that in recent years (2013 and 2014) were held more than 200,000 notifications of Dengue in the State (2014).
Materials and methods
This ecological Study analyzed the spatial distribution of the incidence rates of dengue fever. The rates were determined according to the criteria of the Ministry of health, determining the number of confirmed cases of dengue (dengue hemorrhagic fever and classical), for 100,000 inhabitants at any given geographical space, in the specific case each municipality in the State of São Paulo (PAHO, 2012)
The data relating to confirmed cases of Dengue fever were obtained from the epidemiological monitoring centre Prof. Alexander Vrandjac "maintained by the State Government of São Paulo (CVE/SES-SP, 2015).
The query was performed from the distribution of dengue fever cases reported and confirmed (local and imported) in the State of São Paulo, according to the municipality of residence, by month of onset of symptoms-year 2015. For the analysis of clusters, we selected the data concerning notifications confirmed by indigenous municipality in the State of São Paulo, between the months of January to may 2015 2015.
Regarding the rate adopted as estimate of the population IBGE data regarding population estimates for the Brazilian municipalities in June 2014, available on the website of the Institute (BRAZIL, 2014b).
On spatial analysis initially adopted the distribution by classes in multiples of 100 cases/100 000 inhabitants being the last class comprised of 300 or more cases/100 000 inhabitants due the definition adopted of epidemic on dengue fever (greater than 300 cases/100 000) .
With respect to the spatial correlation, it was evaluated by index of Moran. The hypothesis of invalidity in this case should be equal to zero. Positive values (between 0 and +1) indicate direct and negative correlation (between 0 and-1) inverse correlation. The statistical validity was determined by the estimated significance through the pseudo-significância tests for 99 permutations that allows the determination of a p-value.
It was determined also the spreading of Moran diagram for each month indicating also the index of Moran. The diagram is constructed based on normalized values (attribute values subtracted from your average and divided by the standard deviation) being a two-dimensional graph of z (standard values) by wz (average of the neighbors), and divided into quadrants.
Groups (clusters), were assessed by the index I of Moran (Local Indicators of Spatial Location Association – LISA. The index of Moran can find the Location spatial correlation between the areas and be local allows identification of groups (clusters) of both areas as outliers.
To identify the spatial dependence was given the Moran Map for each month whose Global Index indicated Spatial autocorrelation. The values determined are as follows: 0 (not significant), 1-Q1 (high-high), 2-Q2 (bass-bass), 3-Q3 (high-low) and 4-Q4 (low-high).
For identification of regions of the State, the Division of the State of São Paulo, according to the Brazilian Institute of geography and statistics (IBGE) in 15 meso-regions (BRAZIL, 2014a).
Spatial analysis programs used were the Terraview ®, version 4.22 and GeoDa ®, version 1.67 and cartographic bases used were obtained on the website of IBGE.
Results and discussion
From the notifications confirmed Dengue fever in the period from January to may 2015, the coropléticos maps of the month January 2015 feature two meso-regions of the State, with confirmation of cases of Dengue fever, the mesoregion of Assisi and the meso-region of Campinas. (Figure 1). Gradually the regions in a possible default show expansion whose apparent climax occurs in March 2015. Then begins a process of degradation of notifications through the month of May.
This feature can be observed with the data contained in table 1, through the sheer numbers of notifications of Dengue reaching the maximum value your in March with reduction in two months.
Another note are the regions with low rate of Dengue, especially the regions of Itapetininga and Ribeirão Preto.
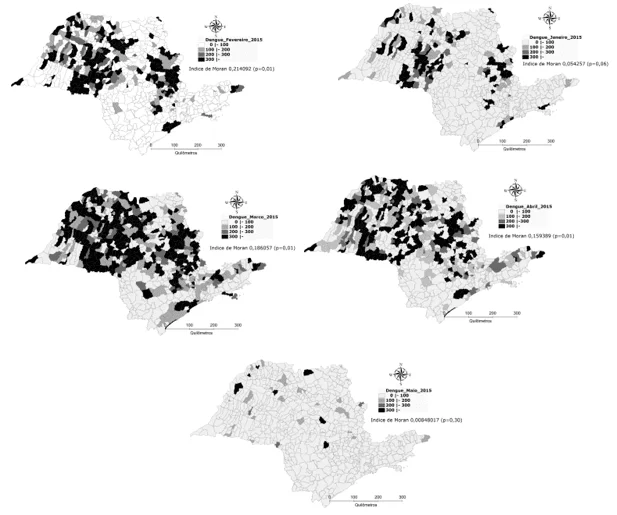
Table 1-number of notifications and confirmations of Dengue fever cases in the State of São Paulo during the months of January to may 2015 according to the surveillance Center Epidemiologica (CVE-SP).
| Confirmed | |||
| Month (2015) | Notified | Autochthonous | Imported |
| January | 55036 | 36659 | 2059 |
| February | 132075 | 85478 | 3473 |
| March | 244864 | 149042 | 4808 |
| April | 139810 | 79900 | 2902 |
| May | 35466 | 16807 | 600 |
| Total | 607251 | 367886 | 13842 |
The existence of Spatial autocorrelation of the variable rate confirmed cases of Dengue fever per 100,000 inhabitant was determined by positive and significant values of indexes of Moran in the months of February to Global March 2015. Moran rates during this period varied between 0.214092 (February) and 0.156389 (April) being significant with values of p = 0.01. The months of January and may not provide Spatial autocorrelation (Figure 2).
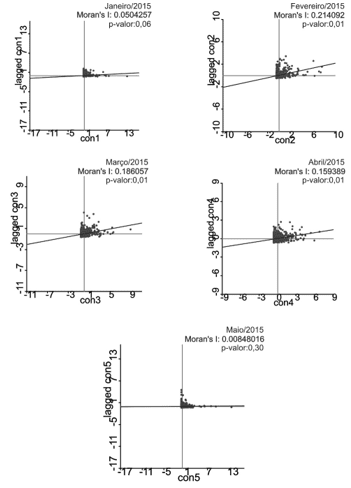
From the Moran index Global, whose values showed significance sought to identify local groups of the months of February, March and April through Local indicators of Spatial Association (LISA) for the construction of maps of Moran.
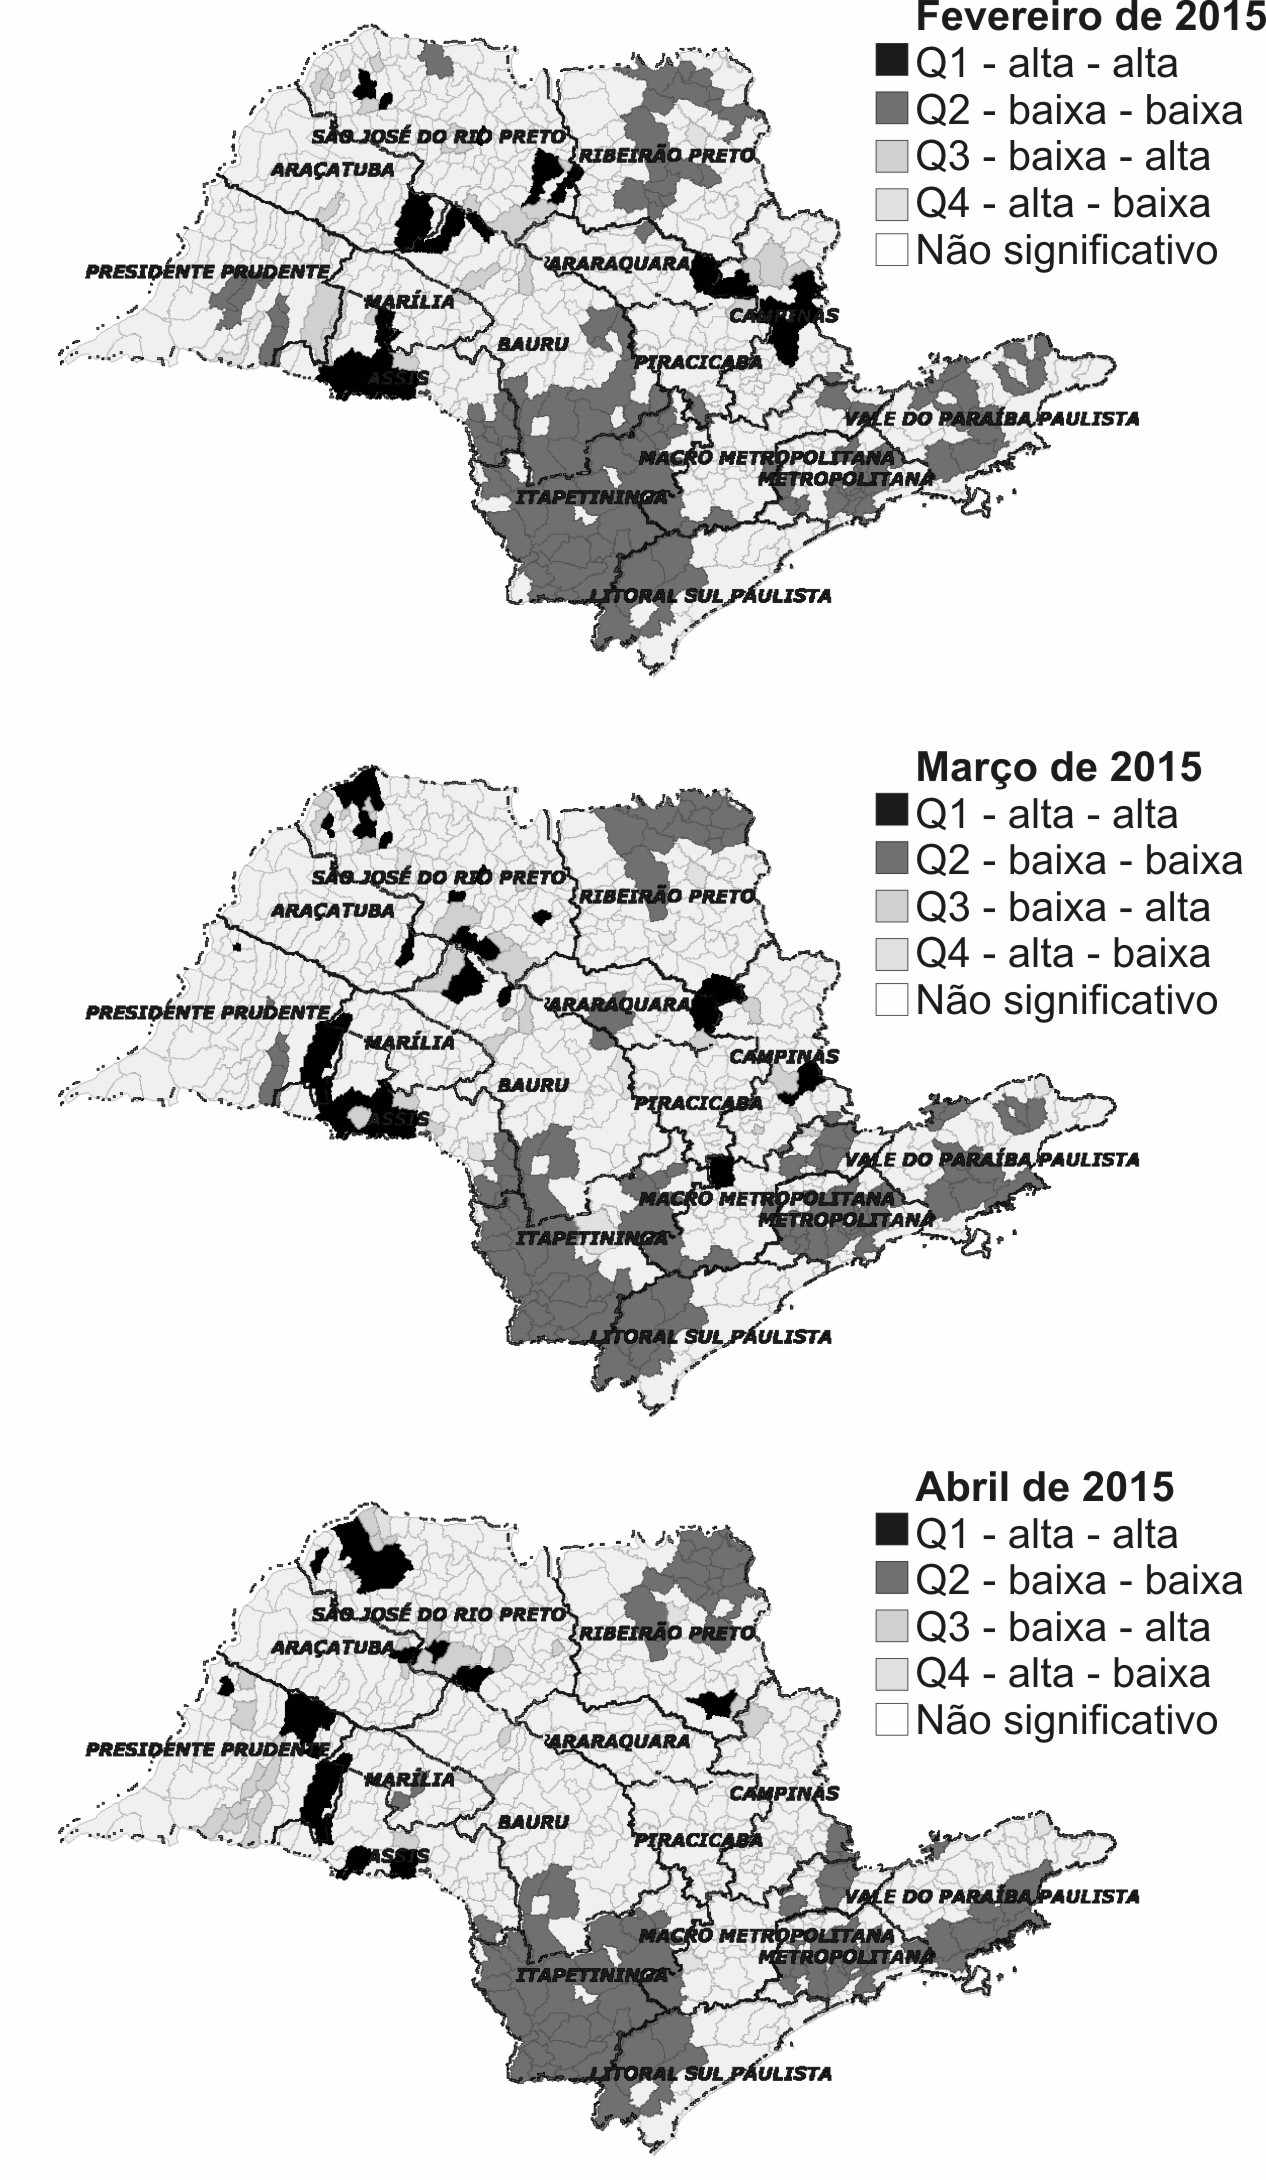
In these months was possible to identify local groupings presented in Q1 (high-high), that is, high and medium high values. The groupings were located in the meso-regions of Assisi, Marilia, Araçatuba, San Jose do Rio Preto, Campinas and Araraquara in February.
Other important and significant groupings are observed in Q2 (low-low), that is, low and medium low values. These clusters were located in the region of Itapetininga, and part of the South Coast regions, Bauru and metropolitan, Macro as well as of groups located in the region of Ribeirão Preto, the Paraíba Valley, metropolitan and Presidente Prudente.
During the months of March and April occur changes in groupings presented in Q1. You can see the Group located in the region of Campinas does not occur in the month of April, the group already located in the region of São José do Rio Preto becomes more evident in the month of April.
Thus it was possible to say with 95% confidence that there is positive spatial Association, i.e. existed municipalities with high rates of confirmation of Dengue surrounded by municipalities with the same trait, just as there were municipalities with low rates of confirmation of Dengue surrounded by municipalities with the same feature. The municipalities in the quadrants (low-high) Q3 and Q4 (high-low) appear, but were not considered important due to the low number of municipalities.
Conclusions
This article demonstrates that the Dengue fever in the State of São Paulo, during the year of 2015 presented a characteristic period between the months of February to April. Reinforces the concept of Spatial autocorrelation, demonstrating that the chaos of Dengue fever do not occur at random, but yes, there is a spatial dependence verified by Moran and General Local indexes.
The meso-regions of Assisi, Marilia, Araçatuba, salmia, Araraquara and Meadows were the most significant, whose municipalities with high values in incidence of dengue had their neighbors with high averages. This conclusion must be considered in the process of preventing and combating the virus. From the beginning of the events there is a big chance that the neighboring municipalities to submit also the disease in a process of expansion.
Combat Dengue should consider that, once started the outbreak in a location, other municipalities in the region tend to be affected.
Brazil. Brazilian Territorial Division. Brasilia, 2014a. Available at: <http://www.ibge.gov.br/home/geociencias/cartografia/default_dtb_int.shtm>. Access in: 02/02/2015.
______. Population estimates for the Brazilian municipalities. 2014b. Available at: <http://www.ibge.gov.br/home/estatistica/populacao/estimativa2014/default.shtm>. Access in: 02/02/2015.
______. Guide to health surveillance. Brasilia: health surveillance Secretariat, 2014c. 812.
CVE/SES-SP. Distribution of dengue fever cases reported and confirmed (autochthonous and imported) in the State of São Paulo. 2015. Available at: <http://www.cve.saude.sp.gov.br/htm/zoo/dengue_dados.html>. Access in: 05/06/2015.
PAHO. Basic indicators for health in Brazil: concepts and applications. Pan American Health Organization, 2012. ISBN 9788587943651. Available at: <https://books.google.com.br/books?id=p9eiQwAACAAJ>.
PENNA, g.. Infectious and parasitic diseases: Pocket Guide. Ministry of health, health surveillance Secretariat, 2010. ISBN 9788533416574. Available at: <https://books.google.com.br/books?id=OLLAkQEACAAJ>.
SÃO PAULO. Plan of surveillance, prevention and control of dengue fever in the State of São Paulo 2014-2015. São Paulo: Board of health, 2014. 24.
VIANA, D. V.; IGNOTTI, E. The occurrence of dengue and weather variations in Brazil: systematic review. Brazilian Journal of epidemiology, v. 16, p. 240-256, 2013. ISSN 1415-790 x.
[1] Prof. Dr. Universidade do Estado de Minas Gerais – Steps