ORIGINAL ARTICLE
OLIVEIRA, David Victor Barros de [1], VOLFF, Ademir [2], CAVALCANTE, Maria Patricia Oliveira [3]
OLIVEIRA, David Victor Barros De. VOLFF, Ademir. CAVALCANTE, Maria Patricia Oliveira. Comparison of costs of a low standard residence using values established by SINAPI with values obtained in the municipality of Garanhuns/PE. Revista Científica Multidisciplinar Núcleo do Conhecimento. Year. 06, Ed. 12, Vol. 07, pp. 05-33. December 2021. ISSN: 2448-0959, Access link: https://www.nucleodoconhecimento.com.br/civil-engineering/standard-residence-using-values
ABSTRACT
Budgeting is an essential process in an enterprise. With concentration and responsibility in this procedure, it is possible to identify the costs and services of each stage of the work, avoiding unnecessary costs during the execution. From the budgeting, the profit and expenses associated with the budgeted object are also obtained. In this way, the question arises: To carry out a budget in the city of Garanhuns, in the interior of the state of Pernambuco, is it efficient to elaborate with data from the National System of Research of Costs and Indexes of Civil Construction (SINAPI)[4]? As a support for using this system, there are tools that enable competent access to input costs. The general objective of this work is to analyze the price variation of inputs for popular single-family housing, by comparing SINAPI and the local market. For its realization, SINAPI was used as a tool to access the costs of inputs, however, the reference base of the System comes from the price survey carried out in the capital of Pernambuco, Recife. For this reason, for works outside the metropolitan region, it is necessary to study budgets with local costs of where the project will be carried out. In this way, the comparison was made between a SINAPI budget, with values obtained in May 2020, and a market quotation carried out in the municipality of Garanhuns. For the quotation, the project of a single-family residence was used, quantifying most of the materials needed for its construction. After the conclusion of the local quotation and the successive comparison, the result of the research showed that SINAPI practices some higher values than the city of Garanhuns, in the comparison of a work of low standard.
Keywords: Inputs, Budget, Garanhuns.
1. INTRODUCTION
Civil construction is of great magnitude in the Brazilian economy, as it is noteworthy that a large part of the Gross Domestic Product (GDP) is the result of construction development, according to the study by the Brazilian Chamber of Construction Industry – CBIC[5] (2020) , thus being an important sector in the creation of jobs for the Brazilian population.
To carry out a work successfully, it is necessary to have a well-elaborated and exquisite planning and budget. With this focus, budgeting is responsible for detailing the due costs for the completion of the project. In budgeting, there are some steps like cost estimate, preliminary budget and analytical budget.
Public and private budgets are represented by proprietary composition tables made available by the best-known tool on the market, with easy access to the public. SINAPI budget worksheets are published monthly updates on the Caixa Econômica Federal (CEF) website, which provide compositions of services and inputs. The spreadsheets made available by SINAPI are updated with data from Brazilian capitals and do not take into account data from cities in the interior. Thus, it is of paramount importance to study these data in the interior of the state.
Budgets were carried out in the Garanhuns region, in the interior of Pernambuco, and then compared with the values provided by the state’s SINAPI, to identify whether the data for the respective month are plausible with the survey of the same date. This work presents information collected in the month of May 2021, comparing the costs of materials of projects that are carried out in the region.
The research is based on the analysis of budgets, in order to better understand the behavior of input prices. Therefore, it has as its guiding question: To make a budget in the city of Garanhuns, in the state of Pernambuco, is it efficient to elaborate with data from the National System of Research of Costs and Civil Construction Indexes (SINAPI)? The general objective of this work is to analyze the price variation of inputs for popular single-family housing, by comparing SINAPI and the local market.
2. DEVELOPMENT
2.1 ASPECTOS DO ORÇAMENTO
The budget is a tool that aims to compose all materials and labor in the form of quantities and values. It is obtained through budgeting, whose document makes it possible to show from the design of the project to the final cost of construction.
2.1.1 BASIC UNIT COST (BUC)
The Basic Unitary Cost (BUC) began with Federal Law 4,591 of December 16, 1964, establishing an obligation to order civil construction industry unions to disclose monthly, by the fifth day of the following month, the unit costs of construction. This available table is calculated using the methodology of NBR 12,721 of 2006 (SINDUSCON-PE, 2020).
The BUC is supported by the median that the construction companies pass on in their measurements, these costs are divided into each unit that the Civil Construction Industry Union (SINDUSCON)[6] distributes. The BUC is an important basis for estimators, even knowing that it is a numerical parameter provided, being an estimate of the construction. It should be noted that this parameter is not the total value of the work, for Mattos (2006), the Basic Unit Cost is characterized as the cost of civil construction, per m², for each of the standards of established properties.
According to SINDUSCON-PE (2020), NBR 12.721 (ABNT, 2006) regulates that twenty price data are collected for each input. These data must be statistically analyzed to arrive at an average value that represents the input. Being all labor charges, social security, social rights and obligations coming from the union levied on wages.
2.2 NATIONAL SYSTEM FOR RESEARCH OF COST AND CIVIL CONSTRUCTION INDEX – SINAPI
The National System of Research of Civil Construction Costs and Indexes – SINAPI, is a table of absolute importance in the budget of private or public works. Published by Caixa Econômica Federal (CEF) and by the Brazilian Institute of Geography and Statistics – IBGE[7], CEF informs the cost and index of civil construction for each month, on its website, through documents and budget spreadsheets.
2.2.1 HISTORIC
According to the Federal Audit Court – TCU[8] (2014), SINAPI was created in 1969, implemented by the National Housing Bank (BNH)[9], with IBGE responsible for producing and disclosing prices for inputs such as: labor and materials of civil construction. With the extinction of BNH, in 1986, Caixa Econômica Federal was responsible for disclosing these data. The surveys for data collection are carried out in the 26 Brazilian capitals and the Federal District, exclusively, with the obtaining of the average prices of the materials.
According to CEF (2020), following years, in 1994, the Board of Trustees of the Length of Service Guarantee Fund (FGTS)[10] publishes Resolution 161, which requires the placement of a unified engineering system for cost monitoring. Being a published system to cover buildings, considered for works such as sanitation and urban infrastructure.
In 2003, the Budgetary Guidelines Law determines SINAPI as a price limit for works contracted with federal funds. Later, through Presidential Decree 7983/2013, which establishes rules and criteria for the elaboration of a reference budget with Union resources, SINAPI is added with the inclusion of cost reference banks from other public institutions, and started to be used as a beacon not only for housing developments, but also for other developments financed with resources from the fund. Presidential Decree 7983/2013, which establishes rules and criteria for preparing reference budgets with Union resources.
The Federal Court of Auditors (2014) reinforces that, from that year onwards, Law 12,919 (LDO 2014) no longer participates in the establishment of values. The definition was in charge of Decree 7.983, which presented in its 3rd and 4th articles that the values of the unit costs must be obtained from the System of Reference Work Costs (SICRO)[11] or from SINAPI.
2.2.2 RESULTS OF SPREADSHEETS
According to IBGE (2017), SINAPI results are made available on the web, monthly, through the CEF website for the 27 states of the federation. These results include the prices of construction materials, salaries of the main categories of professionals who work in the field of engineering and costs of residential and/or commercial projects with different architectural typologies in various aspects (number of rooms, number of bedrooms, bathrooms, floors and type of finish).
For TCU (2014), the results released by SINAPI serve as a basis for both the public and private sectors, leaving budgetists with a strong parameter in their quotations. In works by public bodies, among those who use SINAPI are the CEF itself, the National Health Foundation – FUNASA[12], the Institute of Historic and Artistic Heritage – IPHAN[13], the Institute of Colonization and Agrarian Reform – INCRA[14], the Ministry of Defense and the TCU.
Mattos (2010) cites some items and services that are not considered in the budgeting for the Caixa Econômica Federal spreadsheet. Thus, it is necessary to observe the specification characteristics described in each project.
In order not to have complications at the time of execution, it is up to the technical manager to know how to identify and align such items, making it clear that those not included are not measurable, so there is no average value to be disclosed.
3. METHODOLOGY
Six stages were developed for the design of this work: bibliographical research, elaboration of the budget worksheet, quantitative survey, budgeting of SINAPI and local market prices, comparative analysis of costs and final considerations.
The first stage, bibliographical research, has as main objective to describe the subjects of the work, based on named references. Next, the budget spreadsheet was built, a single-family residence of 45.85 m² was analyzed in May 2020, containing the inputs of the proposed project, being prepared manually using Microsoft Office Excel software. Its description demonstrates what is found in the worked spreadsheet, classified as an analytical budget spreadsheet, whose survey of quantitative data was obtained through the analysis of architectural, hydrosanitary and electrical projects.
With the third stage completed, after all the materials and their quantities were entered into the analytical worksheet, a second worksheet was developed, duplicating the previous one, to insert the values obtained from suppliers in the city of Garanhuns and the values extracted from the SINAPI reference table.
In order to fill in the spreadsheet with the values of the suppliers, it was necessary to create a separate spreadsheet, using a system to recognize the median of the three inputs surveyed for each item, just as the SINAPI spreadsheet is prepared. Suppliers with the same characteristics, small, supplying materials to the tangent neighborhoods of the city of Garanhuns.
As the penultimate stage, comparisons of the general price of the researched inputs of that work were carried out, seeking to understand the relevance and their differences in values between them.
Finally, in the last step, the analysis and all the diagnoses of the data that were researched are presented, to understand the whole process and success of the proposed course conclusion work.
4. RESULTS AND DISCUSSION
In possession of the quantities of materials extracted from the projects based on the compositions, the entire quotation of the inputs was carried out from the SINAPI table and, shortly thereafter, the quotation with suppliers in the municipality of Garanhuns, in May 2020.
Thus, it was possible to compare the costs for carrying out the work with the values taken from SINAPI, referring to the month of May 2020. This is how the results are explained, describing the comparison of the costs of inputs and obtaining the total cost of the budget.
4.1 COMPOSITIONS AND INPUTS
With the finalization of the budget spreadsheet, it was necessary to form the compositions, finding their own compositions or compositions extracted from the SINAPI table, in order to formalize the input surveys.
4.1.1 INITIAL SERVICES
In the calculation of the materials for the location of the work shown in the table below, 1.00 m is distanced on each side of the residence for the execution of the work template. The house is 7.00 m long by 6.55 m wide, so the template was executed with 8.00 m long by 7.55 m wide, totaling 60.40 m². Table 1 shows data on the composition of the location of the work.
Table 1 – Analytical composition of the location of the work
| WORK LEASING | |||
| CÓDIGO | INSUMOS | UNIT | CONSUMPTION |
| 4509 | UNPLAINED WOODEN BOARD *2.5 X 10 CM (1 X 4 “) PINUS, MIXED OR REGIONAL EQUIVALENT | M | 0,55 |
| 5069 | POLISHED STEEL NAIL WITH HEAD 17 X 27 (2 1/2 X 11) | KG | 0,111 |
| 4433 | UNFITTED WOOD PIECE *7.5 X 7.5* CM (3 X 3 “) MAÇARANDUBA, ANGELIM OR REGIONAL EQUIVALENT | M | 0,4125 |
| 43132 | ANNEATED WIRE 16 BWG, D = 1.60 MM (0.016 KG/M) OR 18 BWG, D = 1.25 MM (0.01 KG/M) | KG | 0,02 |
Source: Own authorship (2020).
To calculate the amount of lean concrete, as shown in Table 2, 5.00 cm of layer was used. Calculating all the lean concrete in the work, an exact 1.2 m³ was obtained.
4.1.2 INFRASTRUCTURE
Table 2 – Analytical composition of lean concrete
| LEAN CONCRETE | |||
| CODE | INPUTS | UNIT | CONSUMPTION |
| 370 | MEDIUM SAND – QUARTER/SUPPLIER STATION (REMOVED AT THE QUARTER, WITHOUT TRANSPORT) | M³ | 0,853 |
| 1379 | COMPOSITE PORTLAND CEMENT CP II-32 | KG | 218,65 |
| 4721 | CRUSHED STONE N.1 (9.5 to 19 MM) QUARRY STATION/SUPPLIER, WITHOUT FREIGHT | M³ | 0,596 |
Source: Adapted from SINAPI (2020).
The amount of inputs for the foundation masonry was calculated using 30.00 cm in height, 47.10 m in linear length and 22.00 cm in width, generating 3.108 m³. Its composition is shown in Table 3:
Table 3 – Analytical composition of the foundation masonry
| FRAMING MASONRY | |||
| CODE | INPUTS | UNIT | CONSUMPTION |
| 7258 | SOLID CERAMIC BRICK *5 X 10 X 20* CM | UN | 795 |
| 370 | MEDIUM SAND – QUARTER/SUPPLIER STATION (REMOVED AT THE SITE, WITHOUT TRANSPORT) |
M³ | 1,15 |
| 1106 | HYDRATED CH-I LIME FOR MORTARS | KG | 137,61 |
| 1379 | COMPOSITE PORTLAND CEMENT CP II-32 | KG | 206,42 |
Source: Adapted from SINAPI (2020).
To calculate the inputs for the baldrame beam, whose composition is shown in tables 4 and 5, 20 cm in height was used, containing 47.10 m in linear length and 15.00 cm in width, generating 1.413 m³. In calculating the shape, the base masonry was used on both sides as a base, then multiply the linear meter of the beam by 2, reaching 94.20 m of shape.
Table 4 – Analytical composition of the baldrame beam
| BALDRAME BEAM | |||
| CODE | INPUTS | UNIT | CONSUMPTION |
| 370 | MEDIUM SAND – QUARTER/SUPPLIER STATION (REMOVED FROM THE QUARTER, WITHOUT TRANSPORTATION) | M³ | 0,723 |
| 1379 | COMPOSITE PORTLAND CEMENT CP II-32 | KG | 362,66 |
| 4718 | CRUSHED STONE No. (19 H 38 MM) STATION QUARRY/SUPPLIER, WITHOUT FREIGHT |
M³ | 0,593 |
| 6189 | UNPAPPED WOODEN BOARD *2.5 X 30* CM, CEDRINHO OR REGIONAL EQUIVALENT | M | 0,79 |
Source: Adapted from SINAPI (2020).
Table 5 – Analytical composition of the baldrame beam (continued)
| BALDRAME BEAM | |||
| CODE | INPUTS | UNIT | CONSUMPTION |
| 43059 | CA-60 STEEL, 4.2 MM OR 5.0 MM OR 6.0 MM OR 7.0 MM REBAD | KG | 50 |
| 43132 | ANNEATED WIRE 16 BWG, D = 1.60 MM (0.016 KG/M) OR 18 BWG, D = 1.25 MM (0.01 KG/M) | KG | 0,03 |
| 33 | CA-50 STEEL, 8.0 MM, REBAD | KG | 90 |
Source: Adapted from SINAPI (2020).
To calculate the amount of waterproofing agent for the baldrame beam described in Table 6, it is necessary to find the three exposed areas of the beam. 25,905 m² and 3.8 m² for the bathroom shower area were found, adding 3 coats for a total of 89.10 m² of surface area to receive the paint.
Table 6 – Analytical composition of waterproofing
| WATERPROOFING | |||
| CODE | INPUTS | UNIT | CONSUMPTION |
| 7319 | WATERPROOFING ASPHALT PAINT DISPERSED IN
WATER, FOR CEMENTICIOUS MATERIALS |
0,4 | |
Source: Own authorship (2020).
4.1.3 SUPERSTRUCTURE
For the inputs of the strapping beam, a height of 15 cm was used, containing 82.04 m of linear length and 10.00 cm of width, reaching 1.23 m³.
In the calculation of the shape, it was used on both sides for the lower strapping beam, and using the masonry as a base, then the linear meter of the beam is multiplied by 2, reaching 94.20 m of shape, as shown in figure 7.
Table 7 – Analytical composition of the strapping beam
| BASTING BEAM | |||
| CODE | INPUTS | UNIT | CONSUMPTION |
| 370 | MEDIUM SAND – QUARTER/SUPPLIER STATION (REMOVED AT THE QUARTER, WITHOUT TRANSPORT) | M³ | 0,723 |
| 1379 | COMPOSITE PORTLAND CEMENT CP II-32 | KG | 362,66 |
| 4718 | STONE CRUSHED N. 2 (19 A 38 MM) QUARRY STATION/SUPPLIER, WITHOUT SHIPPING | M³ | 0,593 |
| 6189 | UNPAPPED WOODEN BOARD *2.5 X 30* CM, CEDRINHO OR REGIONAL EQUIVALENT | M | 1,05 |
| 43132 | BREAKED WIRE 16 BWG, D = 1.60 MM (0.016 KG/M) OR
18 BWG, D = 1.25 MM (0.01 KG/M) |
KG | 0,03 |
| 43059 | CA-60 STEEL, 4.2 MM OR 5.0 MM OR 6.0 MM OR 7.0 MM REBAD | KG | 50 |
| 33 | CA-50 STEEL, 8.0 MM, REBAD | KG | 90 |
Source: Adapted from SINAPI (2020).
The calculation of inputs for the slab (table 8) considered the area of the bathroom and its external walls, with areas of 4.60 m² and/or 0.55 m³, and for the shape the sides of the shape were considered, generating 8, 60 m linear.
Table 8 – Analytical composition of the precast slab
| PRECAST SLAB | |||
| CODE | INPUTS | UNIDADE | CONSUMO |
| 1379 | COMPOSITE PORTLAND CEMENT CP II-32 | KG | 362,66 |
| 5061 | POLISHED STEEL HEADED NAIL 18 X 27 (2 1/2 X 10 | KG | 0,03 |
| 370 | MEDIUM SAND – QUARTER/SUPPLIER STATION (REMOVED AT THE QUARTER, WITHOUT TRANSPORT) | M³ | 0,723 |
| 4718 | STONE CRUSHED N. 2 (19 A 38 MM) QUARRY STATION/SUPPLIER, WITHOUT SHIPPING | M³ | 0,593 |
|
3738 |
PRECAST SLAB CONVENTIONAL (SLABS + BEAMS) FOR CEILING, UNIDIRECTIONAL, OVERLOAD
OF 350 KG/M2, UP TO 5.0 M (WITHOUT PLACEMENT) |
M² |
1 |
| 6189 | UNPAPPED WOODEN BOARD *2.5 X 30* CM, CEDRINHO OR REGIONAL EQUIVALENT | M | 0,17 |
| 10917 | WELDED RIBBED STEEL SCREEN CA-60, Q-61, (0.97 KG/M2), WIRE DIAMETER = 3.4 MM, WIDTH = 2.45 M,
MESH SPACING = 15 X 15 CM |
M² |
0,2 |
Source: Own authorship (2020).
The amounts of lintel inputs described in table 9 considered the length of the windows and their overlap, obtaining a length of 7.20 m of lintel, 7.2 m of window lintel and 6.3 m of door lintel.
Table 9 – Analytical composition of the lintel and counter lintel
WORD AND BACKWARD
|
|||||||
| 93194 | PRECAST FRAME FOR SPANS OF UP TO 1.5 M LENGTH. AF_03/2016 | M | 1 | ||||
| 93182 | PRE-MOLDED LINT FOR WINDOWS WITH UP TO 1.5 M SPANS. AF_03/2016 | M | 1 | ||||
| 93184 | PRECAST STRING FOR DOORS WITH UP TO 1.5 M SPANS. AF_03/2016 | M | 1 | ||||
Source: Adapted from SINAPI (2020).
4.1.4 WALL
In table 10, to calculate the masonry inputs for all the walls, the architectural project was considered, analyzing its cuts, including the masonry of the oitão, minus the openings that do not have masonry, obtaining 19.04 m³ and/or 126, 90 m².
Table 10 – Analytical composition of masonry
MASONRY
|
|||||||
| 7271 | CERAMIC BLOCK (MASONRY SEALING), 8 HOLES, 9 X 19 X 19 CM | UN | 37,74 | ||||
| 370 | MEDIUM SAND – QUARTER/SUPPLIER STATION (REMOVED AT THE QUARTER, WITHOUT TRANSPORT) | M³ | 0,016 | ||||
| 1106 | CAL HIDRATADA CH-I PARA ARGAMASSAS | KG | 2,421 | ||||
| 1379 | COMPOSITE PORTLAND CEMENT CP II-32 | KG | 9,60 | ||||
Source: Own authorship (2020).
4.1.5 FLOOR
For the subfloor inputs, the areas of all environments and the areas of the doors were calculated, obtaining 40.375 m² and 2.01 m³, using 2.01 m³ for the composition of table 11.
Table 11 – Analytical composition of the subfloor
SUBFLOOR
|
||||||||
| 370 | MEDIUM SAND – QUARTER/SUPPLIER STATION (REMOVED AT THE QUARTER, WITHOUT TRANSPORT) | M³ | 0,49 | |||||
| 1379 | COMPOSITE PORTLAND CEMENT CP II-32 | KG | 150,00 | |||||
| 4718 | STONE CRUSHED N. 2 (19 A 38 MM) QUARRY STATION/SUPPLIER, WITHOUT FREIGHT | M³ | 0,98 | |||||
Source: Adapted from SINAPI (2020).
4.1.6 ROOF
In the composition of the roof structure (table 12), the following inputs were removed from the roofing project: wooden rafter 7.50 cm x 10 cm, wooden rafter 5 cm x 6 cm and wooden slats 1.5 cm x 5 cm . Two types of rafters were used as they did not contain the third wood input in the quotation month. 34.50 m of 7.50 cm rafters, 158.80 m of 5.00 cm rafters and 193.20 m of rafters were calculated.
Table 12 – Analytical composition of the roof structure
ROOF STRUCTURE
|
|||||||
| 4500 | UNFITTED WOOD RAFTS *7.5 X 10 CM (3 X 4 “) PINUS, MIXED OR REGIONAL EQUIVALENT | M | 1 | ||||
| 4430 | UNFITTED WOOD RAPTER *5 X 6* CM, MAÇARANDUBA, ANGELIM OR | M | 1 | ||||
| 20205 | WOODEN CLEANING FITTED *1.5 X 5* CM, MAÇARANDUBA, ANGELIM OR EQUIVALENT | M | 1 | ||||
Source: Own authorship (2020).
For the amount of colonial tiles, the sloped area of the roof was calculated, reaching a total of 55.18 m², as shown in Table 13.
Table 13 – Analytical composition of the tile
ROOF TILES
|
|||||||
|
7173 |
CLAY / CERAMIC TILE, UNENAMELED, COLONIAL TYPE, CHANNEL, PLAN, PAULISTA, LENGTH OF
*44 TO 50* CM, COVERAGE YIELD OF *26* TILES/M |
MIL |
0,0275 |
||||
Source: Own authorship (2020).
4.1.6 COATING
The calculation of roughcast inputs on all walls considered the internal and external area, minus the openings, obtaining 253.80 m², as shown in table 14.
Table 14 – Analytical composition of roughcast
CHAPISCO
|
|||||||
| 367 | SAND COARSE – STATION QUARK/SUPPLIER (REMOVED FROM THE QUARTER, WITHOUT TRANSPORTATION) | M³ | 0,0044 | ||||
| 1379 | COMPOSITE PORTLAND CEMENT CP II-32 | KG | 1,685 | ||||
Source: Own authorship (2020).
For the plaster, all the walls were calculated, both the internal and external areas, minus the openings, obtaining 253.80 m² or 5.08 m³, shown in table 15.
Table 15 – Analytical composition of plaster
PLASTER
|
|||||||
| 370 | MEDIUM SAND – QUARTER/SUPPLIER STATION (REMOVED AT THE QUARTER, WITHOUT TRANSPORT) | M³ | 1,17 | ||||
| 1106 | HYDRATED CH-I LIME FOR MORTARS | KG | 117,22 | ||||
| 1379 | COMPOSITE PORTLAND CEMENT CP II-32 | KG | 263,74 | ||||
Source: Adapted from SINAPI (2020).
4.1.7 CERAMIC COATING
Table 16 exemplifies the composition of the coating for the walls and floor, the calculation considered all areas, both floor and wall, reaching exactly 61.57 m².
Table 16 – Analytical composition of walls and floor
WALLS AND FLOOR
|
|||||||
|
536 |
EXTRA ENAMELLED CERAMIC COATING, PEI SMALLER OR EQUAL TO 3, FORMAT SMALLER OR EQUAL TO 2025
CM2 |
M² |
1,05 |
||||
| 1381 | ADHETING MORTAR AC I FOR CERAMICS | KG | 3,14 | ||||
| 34357 | COLORFUL GROUP, CEMENTIUM | KG | 0,42 | ||||
Source: Adapted from SINAPI (2020).
4.1.8 INSTALLATIONS
In the composition of the sanitary installations according to the table below, the calculation of the pipes considered the linear length of each pipe diameter, obtaining the quantities of 6.40 m of the 100 mm pipe, 8.10 m of the 75 mm pipe, 15.20 m for the 50 mm tube and 2.80 m for the 40 mm tube, as shown in table 17.
Table 17 – Analytical composition of sanitary facilities
SANITARY FACILITIES
|
|||||||
| 9836 | NORMAL SERIES PVC PIPE, DN 100 MM, FOR BUILDING SEWAGE (NBR 5688) | M | 1,05 | ||||
| 9837 | NORMAL SERIES PVC PIPE, DN 75 MM, FOR BUILDING SEWAGE (NBR 5688) | M | 1,05 | ||||
| 9838 | NORMAL SERIES PVC TUBE, DN 50 MM, FOR SEWAGE
BUILDING (NBR 5688) |
M | 1,05 | ||||
| 9835 | NORMAL SERIES PVC TUBE, DN 40 MM, FOR SEWAGE
BUILDING (NBR 5688) |
M | 1,05 | ||||
Source: Adapted from SINAPI (2020).
For the calculation of the hydraulic pipes in the composition of table 18, using the linear length, the quantities of 45.50 m of the 25 mm pipe and 5.00 m of the 32 mm pipe were obtained.
Table 18 – Analytical composition of hydraulic installations
HIDRAULIC INSTALATIONS
|
|||||||
| 9868 | PVC PIPE, WELDABLE, DN 25 MM, COLD WATER (NBR- 5648) | M | 1,05 | ||||
| 9869 | PVC PIPE, WELDABLE, DN 32 MM, COLD WATER (NBR-
5648) |
M | 1,05 | ||||
| 11764 | BALL REGISTRATION, PVC, WELDABLE, DN 25 MM | UN | 1 | ||||
| 34636 | 1000 LITER POLYETHYLENE WATER TANK WITH COVER | UN | 1 | ||||
Source: Adapted from SINAPI (2020).
The composition of inputs for electrical installations, taken from the electrical project, was the basis for calculating the amount of cables and parts. Table 19 shows 60.40 m of 1.5 mm² cable, 261.30 m of 2.5 mm cable, 15.80 m of 4 mm cable, 17.80 m of 10 mm cable and 10.00 m of cable 16 mm. For the passage boxes there are 19 units and for the conduit there are 97.70 meters.
Table 19 – Analytical composition of electrical installations
ELECTRICAL INSTALLATIONS
|
|||||||
|
1013 |
COPPER CABLE, FLEXIBLE, CLASS 4 OR 5, INSULATION
IN PVC/A, FLAME-PROOF BWF-B, 1 CONDUCTOR, 450/750 V, NOMINAL SECTION 1.5 MM2 |
M |
1,19 |
||||
|
1014 |
COPPER CABLE, FLEXIBLE, CLASS 4 OR 5, PVC/A INSULATION, FLAME-PROOF BWF-B, 1 CONDUCTOR, 450/750 V, NOMINAL SECTION 2.5 MM2 |
M |
1,19 |
||||
|
981 |
COPPER CABLE, FLEXIBLE, CLASS 4 OR 5, INSULATION
IN PVC/A, FLAME-PROOF BWF-B, 1 CONDUCTOR, 450/750 V, NOMINAL SECTION 4.0 MM2 |
M |
1,19 |
||||
|
980 |
COPPER CABLE, FLEXIBLE, CLASS 4 OR 5, PVC/A INSULATION, FLAME-PROOF BWF-B, 1 CONDUCTOR, 450/750 V, NOMINAL SECTION 10 MM2 |
M |
1,19 |
||||
|
979 |
COPPER CABLE, FLEXIBLE, CLASS 4 OR 5, PVC/A INSULATION, NON-FLAME BWF-B, 1 CONDUCTOR, 450/750 V,
NOMINAL SECTION 16 MM2 |
M |
1,19 |
||||
| 1872 | PASSAGE BOX, IN PVC, 4″ X 2″, FOR CORRUGATED FLEXIBLE CONDUCT | UN | 1 | ||||
| 2689 | CONDUIT PVC FLEXIBLE CORRUGATED, YELLOW COLOR, 20 MM | M | 1,1 | ||||
Source: Adapted from SINAPI (2020).
4.1.9 FRAME
The inputs for the doors described in Table 20, foreseen in the architectural project, served as the basis for calculating the quantities, which are 4 doors of 80 cm, 1 door of 70 cm, 5 jambs and 15 hinges.
Table 20 – Analytical composition of ports
DOORS
|
|||||||
|
11365 |
WOODEN DOOR, LIGHT SHEET (NBR 15930) OF 70 X 210 CM, E = *35* MM, BEEHIVE CORE, SMOOTH COVER IN HDF, FINISHING IN PRIMER FOR PAINTING |
UN |
1 |
||||
|
11366 |
WOODEN DOOR, LIGHT LEAF (NBR 15930) OF 80 X 210
CM, E = *35* MM, BEEHIVE CORE, SMOOTH COVER IN HDF, PRIMER FINISH FOR PAINTING |
UN |
1 | ||||
| 11447 | BRASS HINGE, 3 ” X 2 1/2 “, E= 1.9 TO 2 MM, WITH RING, CHROME, BALL COVER, WITH SCREWS | UN | 1 | ||||
|
20001 |
JACKET/ DOORWAY/ STAVE/SOLID FRAME, E= *3* CM, L=
*15* CM, *60 CM TO 120* CM X *210* CM, IN PINUS/TAUARI/FERROL OR REGIONAL EQUIVALENT |
JG |
1 | ||||
Source: Own authorship (2020).
Regarding the windows, also foreseen in the architectural project, the calculated inputs were 3 windows of 100 x 120 cm and 2 of 80 x 60 cm, as shown in table 21.
Table 21 – Analytical composition of windows
WINDOWS
|
|||||||
|
36896 |
ALUMINUM SLIDING WINDOW, 100 X 120 CM (H X W), 2 FLS, WITHOUT FLAG, FINISH ACET OR BRILLIANT FINISH,
FRAME/FRAME FROM 6 TO 14 CM, WITH GLASS, WITHOUT GASKETS |
UN |
1 |
||||
|
34377 |
ALUMINUM HINGING WINDOW, 80 X 60 CM (H X W), ACET OR GLOSS FINISH, FRAME/FRAME FROM 3 TO 14 CM, WITH GLASS, WITHOUT GASKETS/SMOOTHING | UN |
1 |
||||
Source: Own authorship (2020).
4.1.10 FINISHING ON THE BASE
Table 22 presents the amount of sealing background, the areas of all walls, both internal and external, except the bathroom, were calculated, obtaining 241.10 m².
Table 22 – Analytical composition of the sealing base
SEALER BACKGROUND
|
|||||||
| 6085 | ACRYLIC SEALER FOR INTERNAL/EXTERNAL WALLS | L | 0,16 | ||||
Source: Own authorship (2020).
The calculation of the amount of acrylic mass used the same criteria as for the sealing base, obtaining the same result of 241.10 m², shown in table 23.
Table 23 – Analytical composition of acrylic mass
ACRYLIC PLASTER
|
|||||||
| 4056 | ACRYLIC PLASTER FOR INTERIOR/EXTERIOR WALLS | GL | 0,244 | ||||
Source: Own authorship (2020).
The area of 241.10 m² was also considered for the calculation of acrylic painting inputs in table 24.
Table 24 – Analytical composition of acrylic paint
ACRYLIC PAINTING
|
|||||||
| 7356 | PREMIUM ACRYLIC PAINT, MATTE WHITE COLOR | L | 0,37 | ||||
| 3767 | PAPER SHEET FOR WALL OR WOOD, NUMBER 120 (RED COLOR) | UN | 0,25 | ||||
Source: Own authorship (2020).
To calculate the amount of wood painting, all doors were considered, both internal and external areas, obtaining 8.40 m², exemplified in table 25.
Table 25 – Analytical composition of wood paint
WOOD PAINTING
|
|||||||
| 3767 | PAPER SHEET FOR WALL OR WOOD, NUMBER 120 (RED COLOR) | UN | 0,4 | ||||
| 5318 | THINNER WATER BASED SOLVENT | L | 0,04 | ||||
| 6086 | MATTE WHITE LEVELER SYNTHETIC BACKGROUND FOR WOOD | GL | 0,056 | ||||
| 7292 | GLOSSY PREMIUM SYNTHETIC ENAMEL PAINT | L | 0,16 | ||||
Source: Adapted from SINAPI (2020).
4.1.11 EXTERNAL COATING
Table 26 shows the calculation of the external area where the grass will be applied, resulting in 135.89 m².
Table 26 – Analytical composition of grass
GRAM
|
|||||||
| 3322 | EMERALD GRASS OR SÃO CARLOS OR CURITIBANA, IN PLATES, WITHOUT PLANTING | M² | 1 | ||||
Source: Own authorship (2020).
As for the area that will be covered with interlocking stone, after the calculation, an exact 20.00 m² was obtained, shown in Table 27.
Table 27 – Analytical composition of interlocking stone
INTERLOCKED STONE
|
|||||||
|
36170 |
BLOCK / INTERLOCKED CONCRETE FLOOR – MODEL ONDA / 16 FACES / RECTANGULAR / BRICK / PAVER / DUTCH / PARALLECIPED, *22 CM X 11* CM, E = 8 CM, RESISTANCE OF 35 MPA (NBR 9781),
NATURAL COLOR |
M² |
1,003 |
||||
Source: Adapted from SINAPI (2020).
4.1.12 DECORATIVE FINISHING
Table 28 shows the amount of granite coating, which the area was calculated to reach exactly 1.50 m².
Table 28 – Analytical composition of granite
GRANITE
|
|||||||
|
11795 |
GRANITE FOR COUNTERTOP, POLISHED, SWALLOW TYPE/ QUARTZ/ CASTELO/ CORUMBÁ OR OTHER REGIONAL EQUIVALENTS, E= *2.5* CM |
M² |
1,005 |
||||
Source: Adapted from SINAPI (2020).
4.1.13 TABLEWARE AND METALS
Table 29 shows the utility equipment, the quantities that were foreseen in the architectural project were calculated, one unit of each equipment.
Table 29 – Analytical composition of utility equipment
UTILITY EQUIPMENT
|
|||||||
| 10422 | TOILET BASIN (VAS) WITH COUPLED BOX, WHITE CRAFTSMANSHIP | UN | 1 | ||||
| 1368 | COMMON SHOWER IN WHITE PLASTIC, WITH PIPE, 3 TEMPERATURES, 5500 W (110/220 | UN | 1 | ||||
| 10426 | WHITE DISHWASHER WITH COLUMN *54 X 44*CM | UN | 1 | ||||
Source: Adapted from SINAPI (2020).
4.1.14 BUNDLE WALL
The amount of inputs for the masonry of the wall was calculated from the measurements of all the walls. With a 2.50 m high wall, minus the openings, 122.81 m² and/or 18.42 m³ of masonry was obtained. For plaster and roughcast, 257.90 m² of plaster and roughcast were calculated, and/or 5.16 m³ of plaster, as described in table 30.
Table 30 – Analytical composition of boundary sealing masonry
SEALING MASONRY
|
|||||||
| 7271 | CERAMIC BLOCK (MASONRY SEALING), 8 HOLES, 9 X 19 X 19 CM | UN | 37,74 | ||||
| 370 | MEDIUM SAND – QUARTER/SUPPLIER STATION (REMOVED FROM THE QUARTER, WITHOUT TRANSPORTATION) | M³ | 0,016 | ||||
| 1106 | HYDRATED CH-I LIME FOR MORTARS | KG | 2,421 | ||||
| 1379 | COMPOSITE PORTLAND CEMENT CP II-32 | KG | 9,60 | ||||
| 370 | MEDIUM SAND – QUARTER/SUPPLIER STATION (REMOVED
IN THE QUARTER, WITHOUT TRANSPORT) |
M³ | 1,17 | ||||
| 1106 | HYDRATED CH-I LIME FOR MORTARS | KG | 117,22 | ||||
| 1379 | COMPOSITE PORTLAND CEMENT CP II-32 | KG | 263,74 | ||||
| 367 | AREIA GROSSA – POSTO JAZIDA/FORNECEDOR (RETIRADO NA JAZIDA, SEM TRANSPORTE) | M³ | 0,0044 | ||||
| 1379 | COMPOSITE PORTLAND CEMENT CP II-32 | KG | 1,685 | ||||
Source: Own authorship (2020).
4.1.15 FINAL SEWAGE SYSTEM
Table 31 presents the areas of the septic tank that were calculated to know the amount of masonry required. A total of 7.6 m² was obtained, 1.14 m³ of masonry and 2.42 m² of floor area.
Table 31 – Analytical composition of the septic tank
SEPTIC TANK
|
|||||||
| 7271 | CERAMIC BLOCK (MASONRY SEALING), 8 HOLES, 9 X 19 X 19 CM | UN | 37,74 | ||||
| 370 | MEDIUM SAND – QUARTER/SUPPLIER STATION (REMOVED FROM THE QUARTER, WITHOUT TRANSPORTATION) | M² | 0,016 | ||||
| 1106 | HYDRATED CH-I LIME FOR MORTARS | KG | 2,421 | ||||
| 1379 | COMPOSITE PORTLAND CEMENT CP II-32 | KG | 9,60 | ||||
| 367 | SAND COARSE – STATION QUARK/SUPPLIER (REMOVED FROM THE QUARTER, WITHOUT TRANSPORTATION) | M³ | 0,0044 | ||||
| 1379 | COMPOSITE PORTLAND CEMENT CP II-32 | KG | 1,685 | ||||
| 370 | MEDIUM SAND – QUARTER/SUPPLIER STATION (REMOVED IN THE QUARTER, WITHOUT TRANSPORT) | M³ | 1,17 | ||||
| 1106 | HYDRATED CH-I LIME FOR MORTARS | KG | 117,22 | ||||
| 1379 | COMPOSITE PORTLAND CEMENT CP II-32 | KG | 263,74 | ||||
| 370 | MEDIUM SAND – QUARTER/SUPPLIER STATION (REMOVED AT THE QUARTER, WITHOUT TRANSPORT) | KG | 1,35 | ||||
| 1379 | COMPOSITE PORTLAND CEMENT CP II-32 | M³ | 454,58 | ||||
| 4718 | STONE CRUSHED N. 2 (19 A 38 MM) QUARRY/SUPPLIER STATION, WITHOUT FREIGHT | M³ | 0,98 | ||||
Source: Own authorship (2020).
For the amount of masonry in the sink, it was necessary to calculate the areas, reaching exactly 12.00 m², with 1.8 m³ of masonry and 1.52 m² of floor area, according to table 32.
Table 32 – Analytical composition of the sink
SINK
|
|||||||
| 7258 | SOLID CERAMIC BRICK *5 X 10 X 20* CM | UN | 795 | ||||
| 370 | MEDIUM SAND – QUARTER/SUPPLIER STATION (REMOVED AT THE QUARTER, WITHOUT TRANSPORT) | M² | 1,15 | ||||
| 1106 | HYDRATED CH-I LIME FOR MORTARS | KG | 137,61 | ||||
| 1379 | COMPOSITE PORTLAND CEMENT CP II-32 | KG | 206,42 | ||||
Source: Own authorship (2020).
4.1.16 PVC LINING
Table 33 shows the amount of PVC lining to be applied considering the entire area of the residence, except the bathroom, obtaining 36.37 m².
Table 33 – Analytical composition of the pvc lining
PVC LINER
|
|||||||
| 36225 | FLAT PVC LINING, WHITE, 20 CM RULER, 8 MM TO 10 MM THICKNESS, | M² | 1,03 | ||||
Source: Adapted from SINAPI (2020).
The compositions created and presented so far, with their references, input to be researched, measurement unit and consumption coefficient for all materials to be executed in the work, after due calculations, were passed on to fill in the quantitative table.
4.2 MATERIAL QUANTITATIVE TABLE
After preparing the compositions and calculating the amount of materials needed to build the residence, Table 34 shows how the quantity of materials was listed. In this example, the inputs for the lease of the work.
Table 34 – Table with quantitative survey
| WORK LEASING | |||
| CODE | INPUTS | UNIT | AMOUNT |
| 4509 | UNPLAINED WOODEN BOARD *2.5 X 10 CM (1 X 4 “) PINUS, MIXED OR REGIONAL EQUIVALENT | M | 33,22 |
| 5069 | POLISHED STEEL NAIL WITH HEAD 17 X 27 (2 1/2 X 11) | KG | 6,7044 |
| 4433 | UNFITTED WOOD PIECE *7.5 X 7.5* CM (3 X 3 “) MAÇARANDUBA, ANGELIM OR REGIONAL EQUIVALENT | M | 24,915 |
| 43132 | ANNEATED WIRE 16 BWG, D = 1.60 MM (0.016 KG/M) OR 18 BWG, D = 1.25 MM (0.01 KG/M) | KG | 1,20 |
Source: Own authorship (2020).
With the survey of all materials, it was possible to carry out research and budgets to compare values.
4.3 BUDGET ACCORDING TO SINAPI TABLE
The budget from the SINAPI table is, necessarily, the main part of the work. The analyzed data refer to the month of May 2020. Adopting a single criterion based on SINAPI, all survey items were left in a single unit of measurement between the tables, modifying only the values for the survey in the city. Table 35 shows how the data was distributed, this being a part of the beginning of the budget.
Table 35 – Budget according to SINAPI table
| SINAPI-PE TABLE BUDGET | ||||||
| CODE | INPUTS | UNIT | AMOUNT | UNIT COST | TOTAL COST | |
| WORK LEASING | R$ 347,03 | |||||
|
4509 |
UNPLAINED WOODEN BOARD *2.5 X 10 CM (1 X 4 “) PINUS, MIXED OR REGIONAL EQUIVALENT |
M |
33,22 |
R$ |
3,24 |
R$ 107,63 |
| 5069 | POLISHED STEEL NAIL WITH HEAD 17 X 27 (2 1/2 X 11) | KG | 6,7044 | R$ | 12,08 | R$ 80,99 |
|
4433 |
UNFITTED WOOD PIECE *7.5 X 7.5* CM (3 X 3 “) MAÇARANDUBA, ANGELIM OR REGIONAL EQUIVALENT |
M |
24,915 |
R$ |
5,81 |
R$ 144,76 |
|
43132 |
ANNEATED WIRE 16 BWG, D = 1.60 MM (0.016 KG/M) OR 18 BWG, D = 1.25 MM (0.01 KG/M) |
KG |
1,20 |
R$ |
11,38 |
R$ 13,66 |
Source: Own authorship (2020).
The inputs for the lease of the work according to the SINAPI table cost a total of R$ 347.03, in May 2020. For all compositions, the total cost of the work ended up according to table 36.
Table 36 – Total cost budget according to SINAPI table
| SINAPI-PE TABLE BUDGET | |
| TOTAL COST | R$ 35.149,26 |
Source: Own authorship (2020).
4.4 MARKET RESEARCH IN GARANHUNS
The market research in Garanhuns was carried out with three different suppliers, to then calculate the median, whose value would be included in the budget. To survey the cost of the input, the unit of measurement considered was that of the SINAPI table. The data were organized according to table 37.
Table 37 – Garanhuns/PE market research
| ITEM | INPUT | UN | SUPPLIER 1 | SUPPLIER 2 | SUPPLIER 3 | MEDIAN |
| 1 | STEEL CA 50, 8.0 MM, REBAD | KG | R$ 4,10 | R$ 4,19 | R$ 5,20 | R$ 4,19 |
Source: Own authorship (2020).
4.5 BUDGET ACCORDING TO RESEARCH TABLE IN GARANHUNS
With the survey of the materials carried out, the values of the inputs researched in three suppliers and the calculation of the medians concluded, the budget table referring to the city of Garanhuns was assembled, in order to find the final cost of the work and carry out the comparison with the table based on SINAPI. In Table 38, as previously presented, an excerpt from the budget is shown, showing the inputs for the lease of the work.
Table 38 – Work lease budget according to research table in Garanhuns
| BUDGET TABLE GARANHUNS | |||||
| SINAPI- PE CODE |
INPUTS |
UNIT |
AMOUNT |
UNIT COST | TOTAL COST |
| WORK LEASING | R$ 511,99 | ||||
|
4509 |
UNFITTED WOODEN BOARD
*2.5 X 10 CM (1 X 4″) PINUS, MIXED OR REGIONAL EQUIVALENT |
M |
33,22 |
R$ 4,09 |
R$ 135,87 |
| 5069 | POLISHED STEEL NAIL WITH HEAD 17 X 27 (2 1/2 X 11) | KG | 6,7044 | R$ 13,50 | R$ 90,51 |
|
4433 |
UNFITTED WOOD PIECE
*7.5 X 7.5* CM (3 X 3 “) MAÇARANDUBA, ANGELIM OR REGIONAL EQUIVALENT |
M |
24,915 |
R$ 10,90 | R$ 271,57 |
|
43132 |
ANNEATED WIRE 16 BWG, D = 1.60 MM (0.016 KG/M) OR 18 BWG, D = 1.25 MM
(0,01 KG/M) |
KG |
1,20 |
R$ 11,70 | R$ 14,04 |
Source: Own authorship (2020).
The costs of renting the work with the values obtained in the city were R$ 511.99. Table 39 shows the total cost of the work.
Table 39 – Total cost budget according to research table in Garanhuns/PE
| BUDGET TABLE GARANHUNS-PE | |
| TOTAL COST | R$ 31.050,54 |
Source: Own authorship (2020).
4.6 COMPARISON OF RESULTS
The results obtained with the two budgets, the SINAPI table and the survey in Garanhuns, were compared from the total point of view, to calculate the difference between them, as described in table 40.
Table 40 – Difference between budgets
| DIFFERENCE BETWEEN BUDGETS | |
| COSTS | TOTAL |
| SINAPI MAY | R$ 35.149,26 |
| GARANHUNS | R$ 31.050,54 |
| DIFFERENCE | R$ 4.098,72 |
Source: Own authorship (2020).
The difference in question between the two budgets was R$ 4,098.72 (Four thousand, ninety-eight reais, and seventy-two cents). The cost in the city of Garanhuns was lower than the SINAPI table, remembering that its research base is in the Metropolitan Region of Recife/PE.
Another way of representing the difference can be seen in Graph 1, whose blue bar indicates the cost referring to the SINAPI table and the orange bar indicates the cost referring to the local search.
Graph 1 – Total graphical difference between budgets
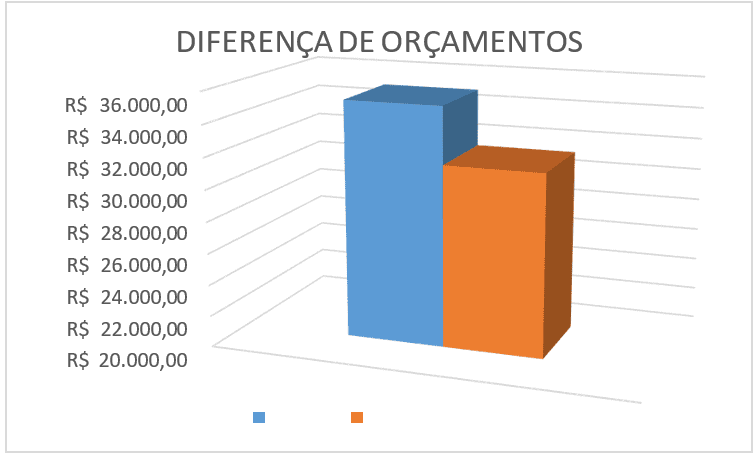
Since the difference between the values is explicit, it is easy to identify the variation that exists to make a quotation with SINAPI. However, with a comparative analysis of the percentage of results, it was noticed that the two budgets do not vary in large proportions, as shown below. It is observed that the cost difference of the two analytical budgets for the proposed standard project was 11.661%. Table 41 also demonstrates the difference in cost per square meter of constructed area between the two quotations. This difference is pretty average.
Table 41 – Difference between budgets and cost per m²
| SINAPI | GARANHUNS/PE | |
| TOTAL COST | R$ 35.149,26 | R$ 31.050,54 |
| DIFFERENCE | R$ 4.098,72 | |
| VARIATION% | 11,661% | |
| COST M² (MATERIAL) | R$ 175,746 | R$ 155,252 |
Source: Own authorship (2020).
To understand how the variations in budget values behaved, Graph 2 shows the difference between each sub-item.
Graph 2 – Graphical total difference between the sub-items of the analytical budget
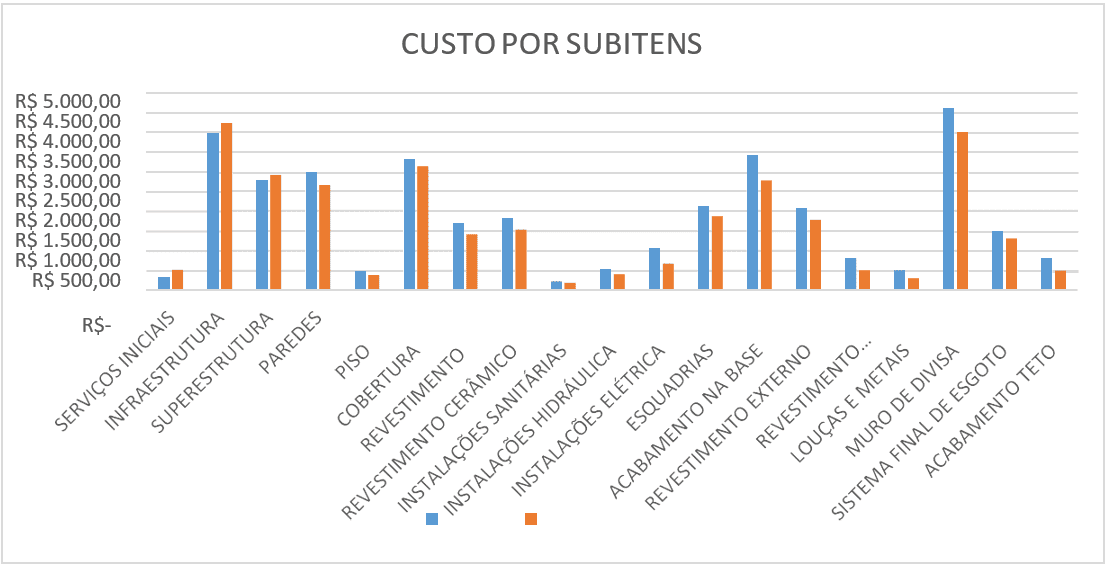
In the distribution below, table 42 displays the values of each quotation, separated by composition, and the calculation of the differences in reais and percentage.
Table 42 – Difference between SINAPI x Garanhuns budgets
| ANALYTICAL BUDGET | |||||||
| SUB-ITEMS | SINAPI | GARANHUNS/PE | DIFFERENCE IN REAIS | % | |||
| Initial Services | R$ | 347,03 | R$ | 511,99 | -R$ | 164,96 | 47,53% |
| Infrastructure | R$ | 3.978,10 | R$ | 4.231,58 | -R$ | 253,48 | 6,37% |
| Superstructure | R$ | 2.782,91 | R$ | 2.917,45 | -R$ | 134,54 | 4,83% |
| Walls | R$ | 2.991,24 | R$ | 2.657,78 | R$ | 333,46 | -11,15% |
| Floor | R$ | 472,82 | R$ | 378,26 | R$ | 94,55 | -20,00% |
| Roof | R$ | 3.320,80 | R$ | 3.135,44 | R$ | 185,36 | -5,58% |
| Coating | R$ | 1.705,22 | R$ | 1.411,69 | R$ | 293,53 | -17,21% |
| Ceramic coating | R$ | 1.824,51 | R$ | 1.525,16 | R$ | 299,35 | -16,41% |
| Sanitary facilities | R$ | 223,91 | R$ | 184,54 | R$ | 39,37 | -17,58% |
| Hydraulic installations | R$ | 526,72 | R$ | 405,29 | R$ | 121,43 | -23,05% |
| Electrical installations | R$ | 1.075,72 | R$ | 665,25 | R$ | 410,48 | -38,16% |
| Window frames | R$ | 2.133,67 | R$ | 1.873,78 | R$ | 259,89 | -12,18% |
| Base finish | R$ | 3.415,05 | R$ | 2.777,88 | R$ | 637,16 | -18,66% |
| External coating | R$ | 2.081,06 | R$ | 1.779,19 | R$ | 301,87 | -14,51% |
| Decorative coating | R$ | 818,87 | R$ | 495,85 | R$ | 323,02 | -39,45% |
| Tableware and metals | R$ | 505,08 | R$ | 297,46 | R$ | 207,62 | -41,11% |
| Boundary wall | R$ | 4.623,98 | R$ | 4.002,95 | R$ | 621,03 | -13,43% |
| Final sewage system | R$ | 1.498,07 | R$ | 1.311,64 | R$ | 186,42 | -12,44% |
| Ceiling finish | R$ | 824,49 | R$ | 487,35 | R$ | 337,14 | -40,89% |
| TOTAL | R$ | 35.149,26 | R$ | 31.050,54 | R$ | 4.098,72 | -11,661% |
Source: Own authorship (2020).
As you can see in Graph 2, with all values and comparisons, it is clear which sub-items had a higher cost in the city of Garanhuns, being initial services, infrastructure and superstructure.
The research carried out between SINAPI in the State of Pernambuco and the City of Garanhuns/PE had an important difference, however, some items had a considerable increase in the table provided by Caixa Econômica Federal, suggesting a complementary research.
With little movement in the country, justified by the SARS-Cov-2 pandemic, some sectors had a drop in production and, consecutively, an increase in the cost of their inputs. For just cause, table 43 represents the difference between the budget prepared with the SINAPI-PE values, in May 2020, and the values withdrawn from SINAPI-PE for the month of January 2020.
Table 43 – Difference between SINAPI May x SINAPI January 2020 budgets
| ANALYTICAL BUDGET | |||||||
| SUB-ITEMS | SINAPI MAY | SINAPI JANUARY | DIFFERENCE IN REAIS | % | |||
| Initial services | R$ | 347,03 | R$ | 330,65 | R$ | 16,38 | 4,72% |
| Infrastructure | R$ | 3.978,10 | R$ | 3.888,72 | R$ | 89,38 | 2,25% |
| Superstructure | R$ | 2.782,91 | R$ | 2.738,45 | R$ | 44,47 | 1,60% |
| Walls | R$ | 2.991,24 | R$ | 2.879,36 | R$ | 111,88 | 3,74% |
| Floor | R$ | 472,82 | R$ | 453,15 | R$ | 19,67 | 4,16% |
| Roof | R$ | 3.320,80 | R$ | 3.291,07 | R$ | 29,73 | 0,90% |
| Coating | R$ | 1.705,22 | R$ | 1.675,84 | R$ | 29,38 | 1,72% |
| Ceramic coating | R$ | 1.824,51 | R$ | 1.820,77 | R$ | 3,74 | 0,21% |
| Sanitary facilities | R$ | 223,91 | R$ | 228,55 | -R$ | 4,64 | -2,07% |
| Hidraulic instalations | R$ | 526,72 | R$ | 524,47 | R$ | 2,25 | 0,43% |
| Electrical installations | R$ | 1.075,72 | R$ | 1.064,80 | R$ | 10,92 | 1,02% |
| Window frames | R$ | 2.133,67 | R$ | 2.085,09 | R$ | 48,58 | 2,28% |
| Base finish | R$ | 3.415,05 | R$ | 3.425,57 | -R$ | 10,52 | -0,31% |
| External coating | R$ | 2.081,06 | R$ | 2.091,09 | -R$ | 10,03 | -0,48% |
| Decorative coating | R$ | 818,87 | R$ | 818,87 | R$ | 0,00 | 0,00% |
| Tableware and metals | R$ | 505,08 | R$ | 497,59 | R$ | 7,49 | 1,48% |
| Boundary wall | R$ | 4.623,98 | R$ | 4.483,10 | R$ | 140,88 | 3,05% |
| Final sewage system | R$ | 1.498,07 | R$ | 1.452,37 | R$ | 45,70 | 3,05% |
| Ceiling finish | R$ | 824,49 | R$ | 828,62 | -R$ | 4,12 | -0,50% |
| TOTAL | R$ | 35.149,26 | R$ | 34.578,14 | R$ | 571,12 | 1,62% |
Source: Own authorship (2020).
Table 43 evaluates the difference between the budgets, analyzing that there was a 1.62% increase in the total between the months of January and May. Representing an increase of R$ 571.12.
For reference of the cost of a residence there is the Basic Unitary Cost (BUC), whose value is defined by the cost/m². Table 44 correlates the values found from the quotations of this work and the reference.
Table 44 – Difference in cost/m²
| SEARCH | TOTAL COST | COST/M² |
| SINAPI | R$ 26.946,15 | R$ 587,70 |
| GARANHUNS/PE | R$ 26.551,57 | R$ 579,09 |
| BUC | R$ 30.908,86 | R$ 674,13 |
| REAL AREA (m²) | 45,85 |
Source: Own authorship (2020).
The value of BUC/m² is R$ 674.13, referring only to the compositions of materials for the type of work chosen for the analysis of this work. Published in January 2020, by the Civil Construction Industry Union of Pernambuco, this is the closest data for the month of May, as there was no previous publication on its website.
Considering that the budget for materials did not include 100% of the household’s internal items, the values found are relevantly close to those of the BUC.
5. FINAL CONSIDERATIONS
The research aimed to investigate the values provided by SINAPI, for the design of a low standard residence, in relation to the values obtained in the municipality of Garanhuns/PE. In preparing the analytical budget, a single-family residence of 45.85 m² was analyzed in May 2020.
Since SINAPI values are a median of three different suppliers, it was necessary to research three values in Garanhuns, to find the median and make the comparison between the budgets.
When starting the conference of the unit costs of materials, it was identified how these can interfere in each service stage of the work. The materials had some services that resulted in higher costs than those presented by SINAPI, however, most of them were lower.
With the accounting of all input costs, the comparison of the total cost of the work between the two analytical budgets was carried out. For SINAPI, the value closed at R$ 35,149.26, and for the municipality of Garanhuns, the value closed at R$ 31,050.54. This represents a difference of 11.66%, considered admissible when evaluated on a scale of total costs of a work, and in the existence of unexpected losses of materials during the execution of the work.
The material for obtaining a budget offered by SINAPI, which sets out its values nationwide, is a good budget tool. Therefore, the objectives of this course completion work were achieved. It is concluded that the SINAPI table can be used for projects in the municipality of Garanhuns, in the interior of Pernambuco, in a safe and reliable way as a whole, as long as it is identified that there is a gap and unexpected waste.
As a suggestion for future work, superimpose in another municipality, in another region, this same methodology for the reference project used in this work, which can be composed with the labor budget. And finally, compare the total costs with which they are stipulated by SINAPI in Pernambuco.
REFERENCES
ASSOCIAÇÃO BRASILEIRA DE NORMAS TÉCNICAS. NBR 12.721. (Avaliação de custos unitários e preparo de orçamento de construção para incorporação de edifício em condomínio). Rio de Janeiro: 2006.
CAIXA ECONÔMICA FEDERAL. Manual de metodologia e conceitos. SINAPI (Sistema Nacional de Pesquisa de Custos e Índices da Construção Civil). Disponível em: <http://www.caixa.gov.br/Downloads/sinapi-manual-de-metodologias-e conceitos/Livro1_SINAPI_Metodologias_e_Conceitos_8_Edicao.pdf>. Acesso em: 29 Jun. 2021.
CAIXA ECONÔMICA FEDERAL. SINAPI (Sistema Nacional de Pesquisa de Custos e Índices da Construção Civil). Disponível em: < http://www.caixa.gov.br/poderpublico/apoiopoderpublico/sinapi/Paginas/default.aspx>. Acesso em: 17 Abr. 2021.
INSTITUTO BRASILEIRO DE GEOGRAFIA E ESTATÍSTICA – IBGE. Sistema nacional de pesquisa de custos e índices da construção civil: métodos de cálculo / IBGE, Coordenação de Índices de Preços. – Rio de Janeiro: IBGE, 2017.
MATTOS, A. D. Planejamento e Controle de Obras. São Paulo: Editora Pini, 2010. Pernambuco: SINDUSCON-PE, 2020. Disponível em: <http://www.sindusconpe.com.br/servicos/cub>. Acesso em: 25 Mar. 2021.
TRIBUNAL DE CONTAS DA UNIÃO (TCU). Acórdão Nº 2622/2013. Disponível em: <https://licitacoes.ufsc.br/files/2014/10/Acórdão-2622-2013-BDI.pdf> Acesso em: 22 Maio 2021.
TRIBUNAL DE CONTAS DA UNIÃO (TCU). Obras públicas – recomendações básicas para a contratação e fiscalização de obras de edificações públicas. Disponível.em:<https://portal.tcu.gov.br/lumis/portal/file/fileDownload.jsp?fileId=8A81 82A15232A37901529D259F061157 >. Acesso em: 28 Mar. 2021
APPENDIX – FOOTNOTE
4. Sistema Nacional de Pesquisa de Custos e Índices da Construção Civil (SINAPI).
5. Câmara Brasileira de Indústria da Construção (CBIC).
6. Sindicato da Indústria da Construção Civil (SINDUSCON).
7. Instituto Brasileiro de Geografia e Estatística (IBGE).
8. Tribunal de Contas da União (TCU).
9. Banco Nacional de Habitação (BNH).
10. Fundo de Garantia do Tempo de Serviço (FGTS).
11. Sistema de Custos Referenciais de Obra (SICRO).
12. Fundação Nacional da Saúde (FUNASA).
13. Patrimônio Histórico e Artístico (IPHAN).
14. Instituto de Colonização e Reforma Agrária (INCRA).
[1] Graduated in Civil Engineering.
[2] Graduated in Civil Engineering.
[3] Graduated in Civil Engineering.
Submitted: July, 2021.
Approved: December, 2021.