BALBINO, Jhonatan Sousa [1]
SOUZA, Vanessa Batista [2]
BALBINO, jhonatan Sousa e SOUZA, Vanessa Batista – Profile of eating habits and BMI of the students of the Physical education courses and information technology. Multidisciplinary Core scientific journal of knowledge. Year 1. Vol. 8-September 2016. ISSN: 2448-0959.
Summary
This project was carried out in order to assess eating habits and body mass index of two distinct groups of 4° semester students of Physical education courses and information technology. Such courses are totally different areas and bearing in mind the activities that develop, we'll cover more precisely the differences and also their habits in relation to the practice of physical exercises. So compare the results and direct them according to the needs of each group.
Keywords: habits, education, technology, obesity.
INTRODUCTION
The emergence of chronic diseases has left the brazilian population on alert over the past few years, due to the adoption of a standard feed. Currently, in Brazil, the diet is characterized by high consumption of foods high in fat, sugar, salt, and low in essential micronutrients for the organism.
In addition, low intake of fruits, vegetables, vegetables, and whole grains is committed so important consumption of vitamins (POF 2008-2009) ¹. Almost half of Brazilians are overweight. According to research published by the Ministry of health, in 2006, 42.7% of the population was overweight, as early as 2011, this percentage has become of 48.5%. The prevalence of obese adults in the period from 2006 to 2012 rose from 15% to 17.4%. This research also reveals that 34.6% of Brazilians consume to excess fat in meat, and more than half drink milk regularly (Ministry of health-2011) ². These factors result in one of the main reasons of overweight and obesity in the country. The sedentary lifestyle also contributes, and for this problem, in addition to the high consumption of soft drinks (5 times a week) by 29.8% of Brazilians (Vigitel – 2011-2012) ³.
Obesity is a medical condition characterized by excessive fat in the body and is associated with various diseases. The bad eating habits increase the incidence of diseases such as diabetes, hypertension and cardiovascular disease, and may lead the individual to death.
MATERIALS AND METHODS
To develop this work we use a closed questionnaire, containing 10 questions relating to gender, age, eating habits and the practice of physical exercises of each student (Annex 1). We did an evaluation for the quality of life and eating habits of each student interviewed. Therefore, interviewed 80 (80) academics; 40 (40) of the Physical education course and 40 (40) of the course of information technology (it).
We address first the students of physical education, being 22 (twenty-two) men and 18 (eighteen) women. The students answered the questionnaire indicating what types of foods consumed on a regular basis, the amount of physical exercises practiced during the week and had habits of smoking, consume alcohol and if were carriers of diabetes, soon after, we blood pressure with a sealer, we decided to use this instrument for the practicality, aiming at the short time we had to accomplish the whole process because we address students before their classes and during range; We measure the abdominal circumferences, height and weight of each University and soon after we calculate the mass physical Indexes (BMI), explaining one by one their parameters and in which the same were within the table of IMC.
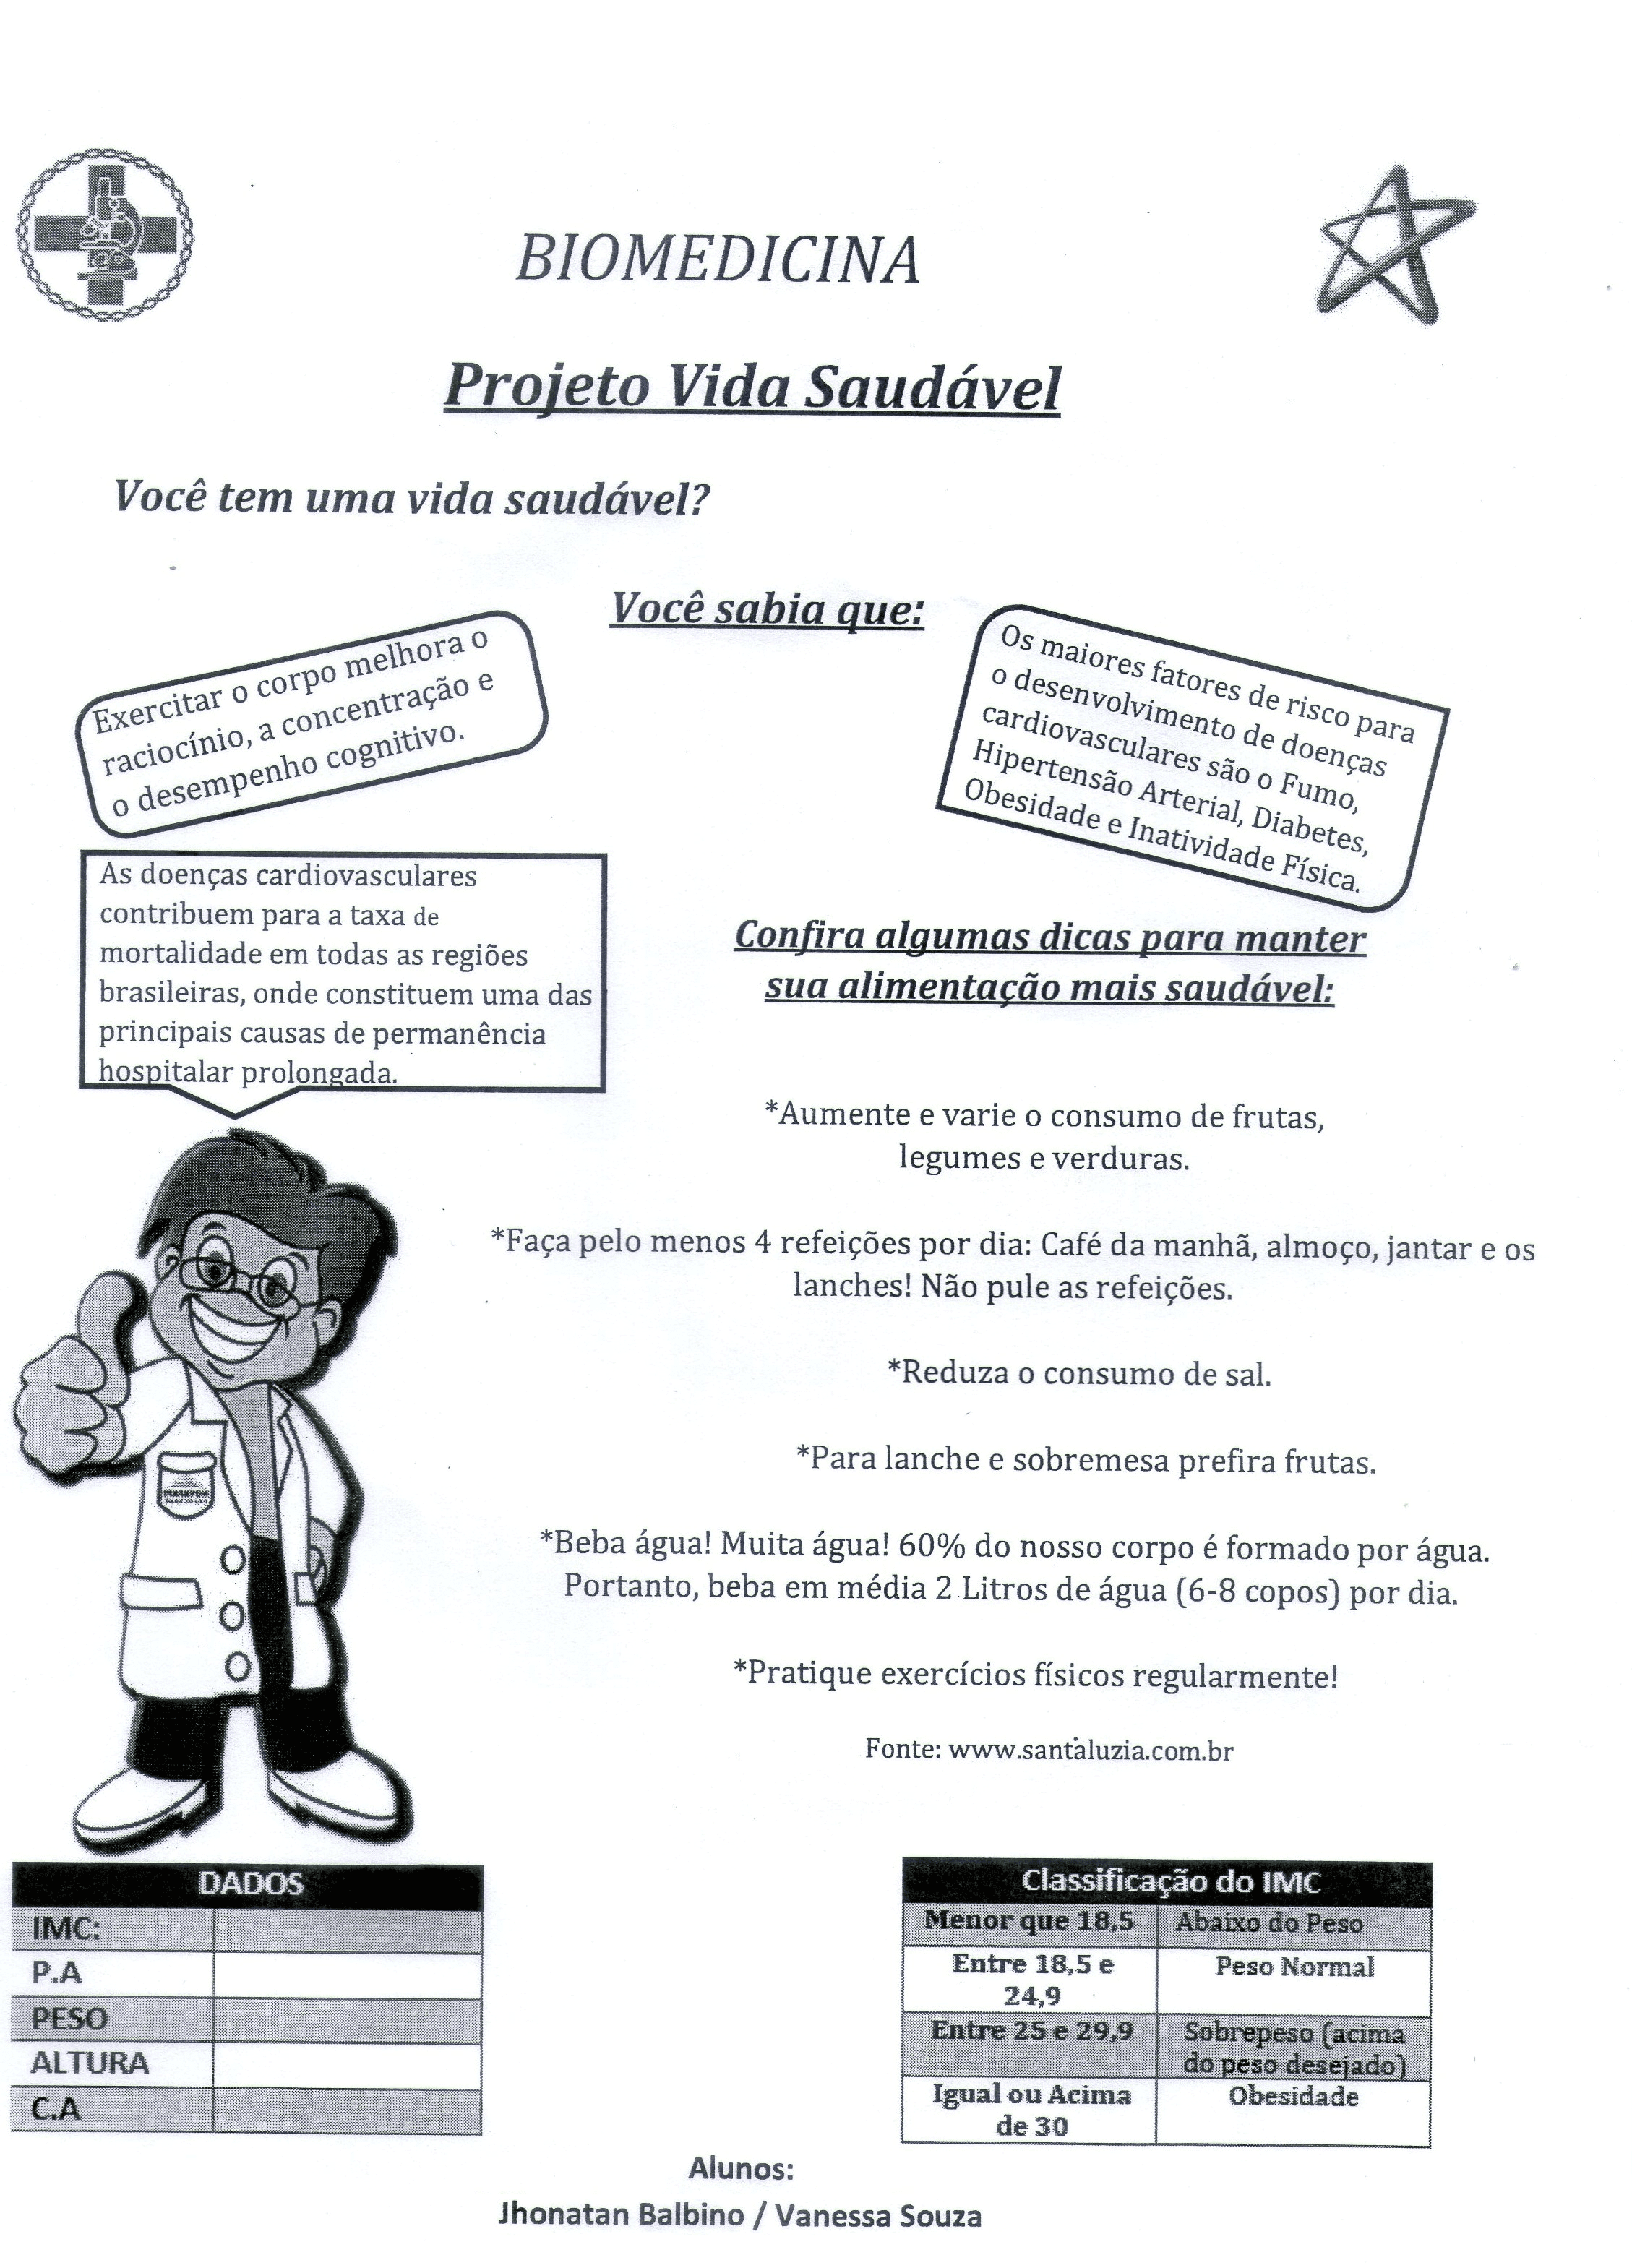
Been the indexes: less than 18.5 (underweight) between 18.5 and 24.9 (normal weight) between 25 and 29.9 (overweight) and equal to or above 30 (obese). At the end of the process were handed pamphlets with tips on healthy habits, with the importance of having a good diet (Annex 2) and a Granola bar for every student interviewed, in order to encourages them to have a better food and a better quality of life.
The same procedures were performed with the pupils of the course of information technology (it). We interviewed 21 (twenty-one) men and 19 (nineteen) women.
Therefore the materials used were questionnaires, brochures, two boxes of cereal bar, measuring tape, double sided adhesive, scale (weight), arterial pressure sealer, pen, calculator, a table and two chairs.
The BMI calculation is performed as follows: the student's weight divided by height squared (weight ÷ Time ²) to obtain the result of the student's body mass.
DISCUSSION AND RESULTS
On completion of this project, we observed that both groups know what they eat and know what is good or not. The fact is that opt for convenience, the option to not take too much of your time.
And in this case, both classes in the show that have a healthier life, depends on the strength of will of each one.
According to the data:
In relation to beverages consumed by physical education classes X information technology we have obtained the following indexes:
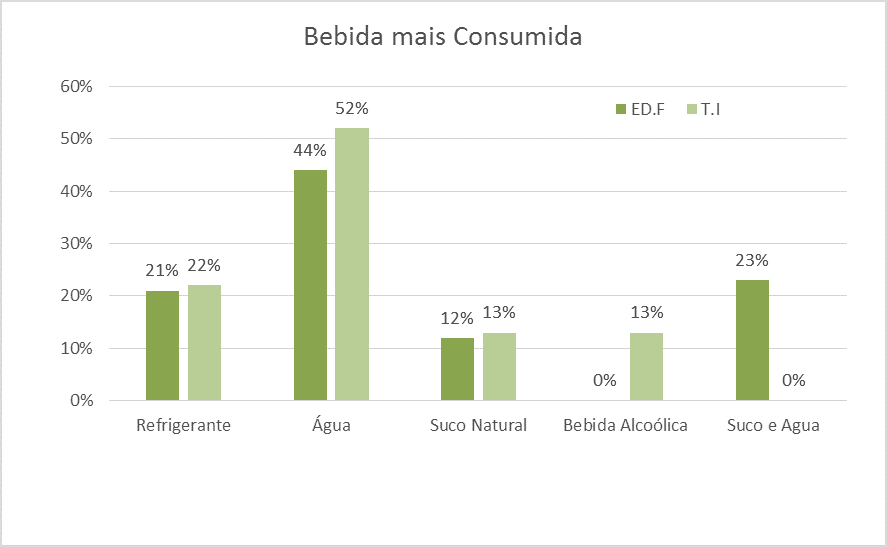
The most consumed beverage, water is preferred by both classes. In the second option we have the juice and Soda with about 23% of the data.
In relation to food consumed by physical education classes.
Information technology we have obtained the following indexes:
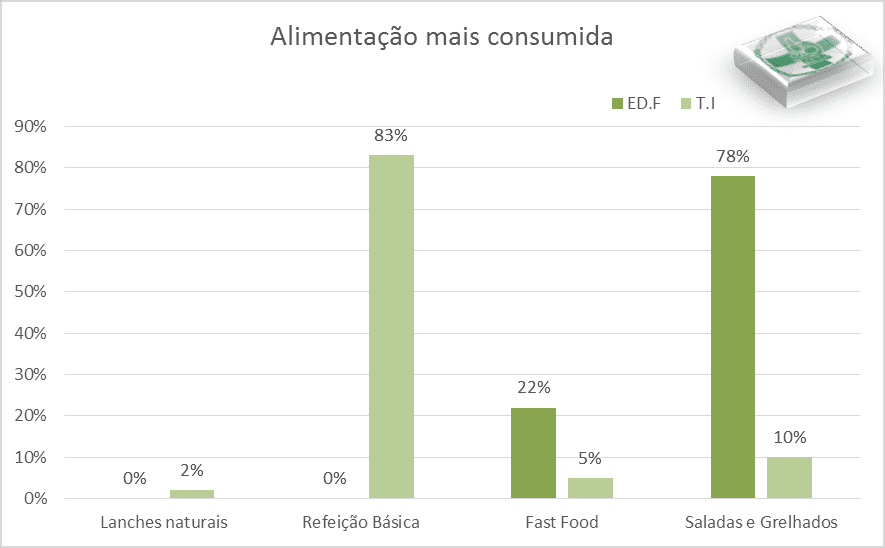
Feeding that part of the Gym are the salads and grills with 78% of the notes, it already gives preference to the dish made with 83%. Fast Food and others are in 3rd option for college students. This shows that the choice of students run from the rush of everyday life.
In relation to students practicing physical exercises we obtained the following data:
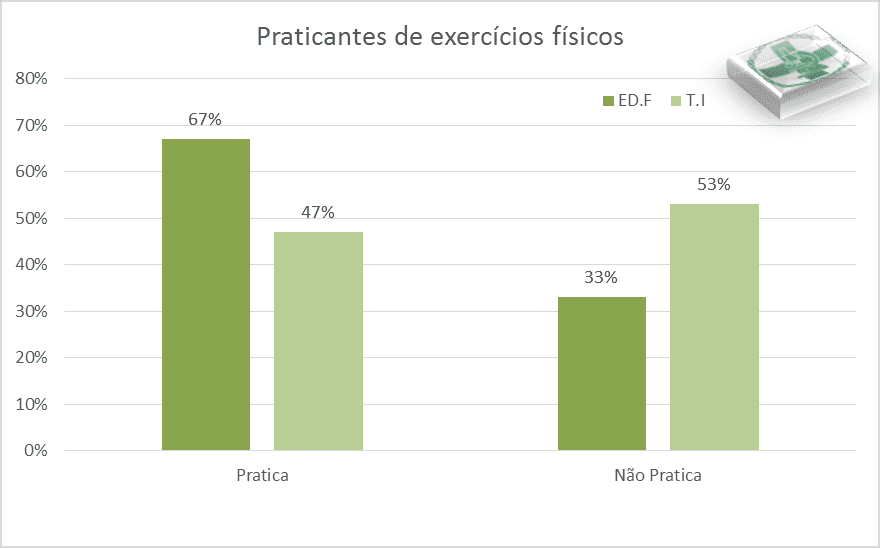
Physical education university students do exercises already in their practical classes, but they fit the exercises on a daily basis with 67%, and already students of t. I like doesn't have much time out of your day to practice the exercises, they reconcile the weekend to practice with 47%. The difference to the students of t. I with the Ed. That do not practice exercises is 20% more.
In relation to students who smoke, we obtained the following results:
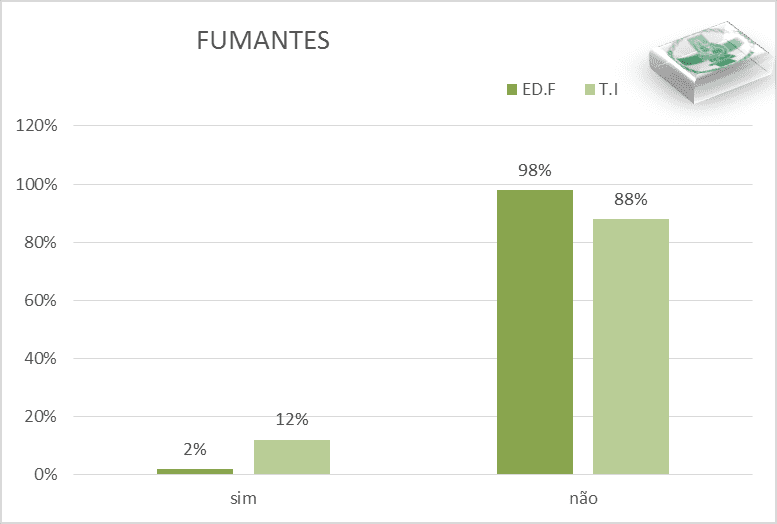
The percentage of students who smoke is superior in both classes, with approximately of 98%. Those who already smoke, 12% are students.
In relation to students who consume more alcohol we obtained the following data:
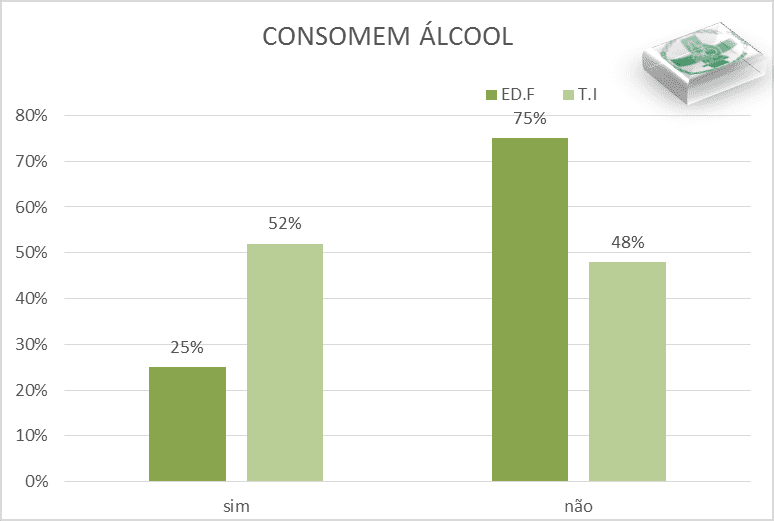
Figure 5-bar chart illustrating the percentage regarding students who consume alcohol.
Figure 5-bar chart illustrating the percentage regarding students who consume alcohol.
The graph shows that the class of physical education does not consume alcohol as i.t. class, but the data call us attention is that no alcohol consumption in both classes is about 75% for Ed. Physics and 48% for T.I.
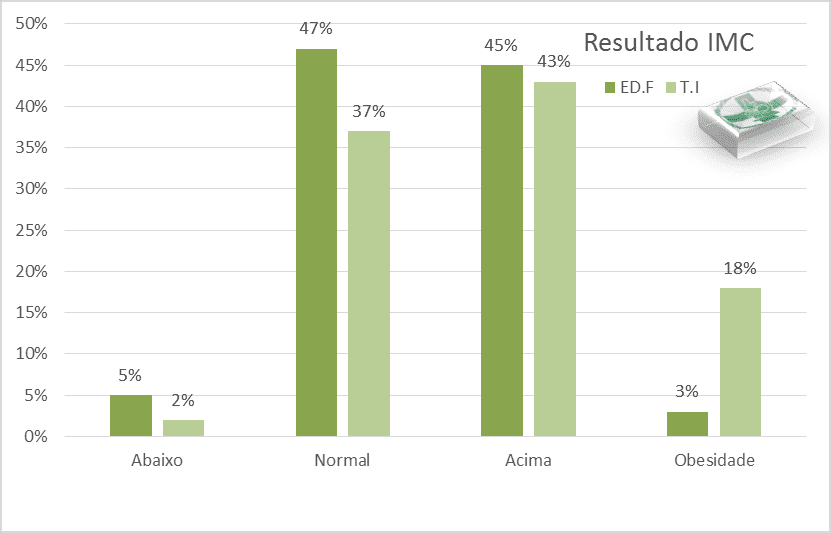
In relation to IMC were obtained the following data:
CONCLUSION
Even though both areas are different, they both know how to have a healthier life, just not follow to the letter. At first we thought it was going to be a physical education class that has more healthy habits, but the data showed that no, it's as much as I don't have time to practice physical activities, makes a reconciliation with his weekend, even 30 minutes on Saturday, and 30 minutes on Sunday.
But always do some kind of exercise. The IMC class shows us that most are between normal weight and overweight, but nothing reaches the total inactivity. Making the thesis that classes that use computers in everyday life are sedentary, to the point that the person didn't even get up from the Chair for lunch, much less to book a time out of your day to do something that you do well.
The consumption of fast food and liquor come rising gradually among college students, but among these groups there was no given that was relevant to their conclusion.
In reality, the habit of healthy living will of each person, no matter what time of week it is carried out, provided that you think really on your health.
Annex 1
Questionnaire-LIFESTYLE
NOME: _______________________________________________________ (Opcional)
Gender: () male () female
Age: _ _ _ _ _ _ years/weight: _ _ _ _ _ _ kg/TIME: _ _ _ _ _ _
PRESSURE (P): _ _ _ _ _ _/IMC: _ _ _ _ _ _/WAIST CIRCUMFERENCE: _ _ _ _ _ _
What drink you consume more frequently?
() Soda Water ()
() Natural Juice () alcoholic beverage
Obs.: ______________________________________________________
What type of food is part of your daily life?
() Natural Snacks () Basic Meal (P F) (rice, beans, meat …)
() Fast Food () and grilled Salad
Practicing physical exercises? (Week)
() up to 2 x () up to 5 x () Daily
() I don't do physical exercises
Smoke? ( ) SIM ( ) NÃO
Consume alcohol? () Yes () no
| Food Frequency-WEEK | |||||
| Never | 1 time | 2 to 3 times | 4 to 6 times | Daily | |
| the) Fruit | |||||
| the) Vegetables | |||||
| b) Meat | |||||
| c) fish | |||||
| d) dairy products
(Cheese, milk, yogurt) |
|||||
| and) Cereals
(Bread, biscuits) |
|||||
Referring to their eating habits, how often consumes the following foods:
References
Brazil. Ministry of health. Health surveillance Secretariat. Department of health situation analysis. – Brasília: Ministry of health, 2011.
Brazil. Vigitel Brazil 2011: surveillance of risk factors and protection for chronic diseases by Telephone Survey. Brasília: Ministry of health, 2012.
Nunes, Maria Angelica. Eating disorders and Obesity. 2. ed. Porto alegre: New Haven, 2008. São Paulo/2014
SURVEY of family budgets, 2008-2009: analysis of food consumption in Brazil/IBGE, coordination of work and income. -Rio de Janeiro: IBGE, 2011.
[1] Degree in Biomedicine at the University of São Paulo. Contact: [email protected]
[2] Student in Biomedicine at the University of São Paulo. Contact: [email protected]