ORIGINAL ARTICLE
ROCHA, Matheus Carneiro [1], ARAÚJO, Jamille Carla Oliveira [2], SANTOS, Neuma Teixeira Dos [3]
ROCHA, Matheus Carneiro. ARAÚJO, Jamille Carla Oliveira. SANTOS, Neuma Teixeira Dos. (IN) contributory justice in the general social security regime: RGPS from the point of view of actuarial science from the point of view of income and the actuarial social security factor. Revista Científica Multidisciplinar Núcleo do Conhecimento. 04 year, Ed. 06, Vol. 03, pp. 135-161. June 2019. ISSN: 2448-0959.
SUMMARY
Issues related to public social security have generated widedebate between society and government. The average citizen cares about the fair measure between what he pays in the present and how much he will receive from retirement in the future. In view of this, this article aims to define according to the foundations of actuarial science, the fair measure between the value of contributions (payments) and the value of benefits (retirement) managed by the General Social Security Regime – RGPS as a tool of social (in)justice. The methodology used to obtain all parameters relevant to the RGPS as well as to the actuarial social security regime was the creation of situations involving men and women under specific conditions of entry into the social security system of initial age, retirement age and contribution salary and from these input data, the values of contribution and benefits were calculated through the Matlab program , where calculations were operationalized as a calculation routine. The results were segmented by gender (male or female) and income range, it was observed that social security contribution rate, the most important parameter to define the value of contributions to the RGPS, from 28% to 31% is very high in comparison with the rate calculated by actuarial science of 16% to 17% for men and 13% to 14% for women. It is concluded that for the ordinary citizen subject to the rules of the RGPS in force, the amounts of the contributions paid that reflect the retirement benefits received differ from the fair measure, calculated by actuarial science, therefore, it was not observed factors that attest that the RGPS is fair to the taxpayer and therefore to society.
Keywords: Social security, RGPS, actuarial science.
1. INTRODUCTION
The public pension system is managed by the National Institute of Social Security (INSS) was implemented through Law No. 8,029 of April 12, 1990 and regulated by Decree No. 99,350 of June 27, 1990. It governs the issue of social security in the country, which is responsible for the INSS to manage and maintain social security services derived from the General Social Security System – RGPS, in accomparato r. 8,213 of April 24, 1999, basically frames the workers of the private sector and the Own Social Security System (RPPS) of public servants.
The fundamental point of any social security system is how it will be financed, that is, to ensure a continuous flow of resources to meet expenses with administrative benefits and expenses. Also, Iyer (2002), it is necessary to equalize the flows of resources proportional to the contribution period and the final salary of the taxpayer.
The terms contributions and contribution rate naturally emerge to the central field of discussions when it comes to social security, since it is society as a whole that finances this system.
The complex dynamics of social security systems is discussed widely by Iyer (2002), who informs that the parameters applied influence the social security system are demographic and economic aspects, the very dynamics of the number of people of the working population, being the one that contributes to the system and the number of people retired or who gain some kind of benefit from that system.
Thus, with the growth in the number of pensions and social assistance benefits, as well as the reduction of the economically active population, that is, the number of social security taxpayers, it is affirmed that it brings a significant change in the demographic profile, which can lead to the increase in social security expenses, from 2050, to ten times the value of gross domestic product (GDP). This fact, elevated for a society to pay so as not to affect other activities, involving important public policies according to Cruz, (2015).
According to Campani and Dias da Costa (2016) spending on public pensions is stratoferically high, according to government officials is in the house of hundreds of billions of reais and in just over 50 years, the expenditure will be greater than 40% of the Budget Revenue of the Union. Despite the size spent on social security, no one has debated whether the value of contributions paid and received as well as the discount rates applied is truly fair.
For the analysis of social security systems. Understanding how complex and stochastic parameters relate over time is a key term for other aspects of actuarial mathematics of social security systems (Afonso and Lima, 2011).
The author’s interest in the study on actuarial justice became even clearer during the reading of the work of Giambiagi and Afonso (2009) that positions the ideal social security system as actuarialally balanced between expected present value discounted an interest rate equal to the flow of benefits received.
The subject has social relevance for trying to verify in justice if there is a need for pension reform, considering the recent changes related to the non-incidence of the social security factor in retirement for contribution time, established by the new law no. 13,183/2015, reflect in the economic and financial sustainability of social security.
The crux of this is the following question: Is there justice in the system of contribution to the RGPS from the point of view of actuarial science? That is, the income and actuarial factor applied can determine the justice of contributory recollection?
2. THEORETICAL FRAMEWORK
2.1 RGPS CONTRIBUTION FLOW – GENERAL SOCIAL SECURITY SCHEME
The INSS (National Institute of Social Security) was implemented through Law No. 8,029 of April 12, 1990 and regulated by Decree No. 99,350 of June 27, 1990. It is up to the INSS to manage and maintain social security services derived from the General Social Security System – RGPS, in accomb sofa of Law No. 8,213 of April 24, 1999.
The RGPS has an important benefit system for the citizen who is Retirement by Contribution Time (ATC). This retirement system has three rules namely, the progressive 85/95, the 30/35 years of contribution and the rule for proportional retirement. As the current rule is progressive 85/95, this is the one that will be worked on.
The contribution to the RGPS is characterized as a simple distribution, where companies contribute around 20% and the remaining rate is benched by the worker. The contribution to the worker is calculated according to the taxpayer’s income (), where it is greatly contributed by the contribution rate (c) according to the income range, according to table 1 available on the INSS website.
Table 1 – Contribution rates according to the 2017 RGPS contribution salary range.
| Contribution Salary (R$) | Rate |
| Up to 1,659.38 | 8% |
| From 1,659.39 to 2,765.66 | 9% |
| From 2,765.67 to 5,531.31 | 11% |
Source – INSS (2019).
Then, the flow of contributions or Present Value of Contributions (VPC) is calculated simply according to equation 1. The accumulation of resources promoted by equation 1 is increasing and progressive.
![]()
2.2 SOCIAL SECURITY FACTOR AND FLOW OF BENEFITS IN RGPS
The social security factor was instituted in the FHC government through Constitutional Amendment 20 in 1998. In the following year, through Law 9,876, the social security factor came into existence with the mission of discouraging early retirements, because the longer the contribution time, the greater the amount of retirement received and vice versa. Equation 2 shows the way of calculating the social security factor (Penafieri and Afonso, 2013).

Where:
Tc: contribution time.
α: contribution rate (0.31).
Es: life expectancy given by the IBGE mortality table for both sexes.
Id: age at the moment of retirement.
Therefore, equation 2 shows the relationship of three important variables, the time of contribution, the age at the time of retirement and the life expectancy. In mathematical terms, the longer the contribution time, the greater the social security factor, the longer the time and age at the moment of retirement, the higher the social security factor and in the opposite direction the higher the life expectancy, the lower the social security factor.
Law 9.876/99 was supplemented by Decree 3265/99 instituted a change in the RGPS in the way of calculating the flow of retirement or benefit salary (Sb), therefore,, the salary will be calculated by multiplying the social security factor (f) by the real arithmetic mean M of the 80% higher contribution salaries, according to equation 3.
![]()
Equation 4 is an integral that represents the basis of calculation for retirement benefits by contribution time. The equation means the average of the 80% higher contribution salaries, Tc: represents the contribution time, 0.2Tc represents 20% of the contribution time as a consequence of the interpretation of the constitutional rule of Amendment Nº. 20.

Where is the value of the individual’s salary in time t, w0 means the initial salary of the taxpayer, h means the growth rate of the economy per year and g is the rate of wage growth per year, the parameters of equation 5 combined explain the progressive and exponential growth of the taxpayer’s income over time.
The parameters important to the RGPS are inserted in the economy as exogenous variables to the social security system of the RGPS. One of the variables is the salary of taxpayers, this follows the mathematical model proposed by Gremaud and Patrick (2004); Penafieri and Afonso (2013) according to equation 5 and previously presented in equation 4.
![]()
2.3 NOTIONS OF ACTUARIAL MATHEMATICS
Filho (2010) presents the important notions of actuarial assumptions, an important parameter to be considered is the survival board. The literature has a series of tables, however the one that the author used in the elaboration of this work was the survival plank elaborated by IBGE. The main importance of the survival board is to obtain life expectancy and the probability of survival in a given cut of the table.
The notions presented by Afonso and Lima (2011) are in accordance with Filho (2010) regarding the notion of the probability of an individual in age x stay alive until age x+t years. This probability is represented by Px acording to equation 6. Ix+t represents on the survival board the number of individuals in the cut that corresponds to age x+t Ix, representing the hypothetical amount of individuals in the cut of the survival table at age x.

Similarly, equation 6 the probability of an individual dying in t years can be calculated, therefore, the difference in each cohort of individuals who died between the x and x+t intervals divided by the number of individuals in cohort x is given by equation 7.

The reading of the article written by Afonso and Lima (2011) was important for this work, because the authors addressed the theme of the social security regime from the actuarial point of view compared to the RGPS on the agenda of the contribution system in question. The theoretical basis of the model of contribution and accumulation of social security benefits were presented widely in the article.
Figure 1 shows two distinct sides, the left side represents the contributory period, that is, they are the monetary values that are paid by the taxpayer regularly to the social security system. The right side represents the period of receipt of retirement being that period where the beneficiary receives his benefit salary until his death in the period w.
Figure 1 – Flows of contributions and benefit flows as a function of time.
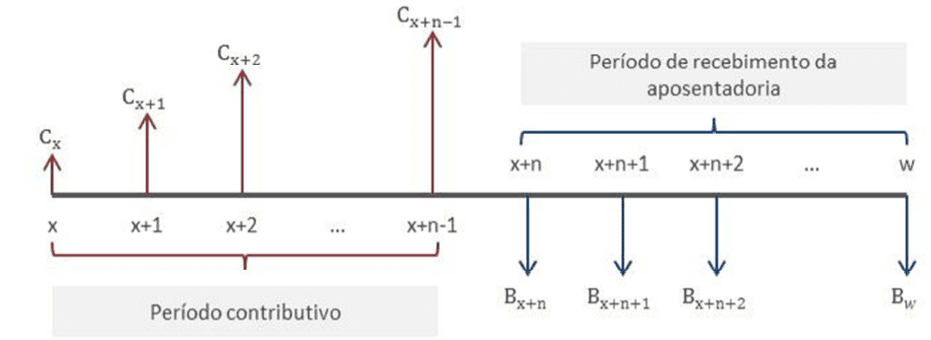
From financial mathematics the contributory flow over time, should be brought to present value for age x multiplying by the discount factor compound vt according to equation 8, where t is the time period and i is the discount rate for calculation effect varies between 1% to 3% as suggested in Afonso and Lima (2011).

2.4 ACTUARIAL SOCIAL SECURITY FACTOR IN RAP – ACTUARIAL SOCIAL SECURITY REGIME
The assertion about actuarial justice aroused the interest of the author, this interest became even clearer during the reading of the work of Giambiagi and Afonso (2009) that positions the ideal social security system as actuarialally balanced between expected present value, discounting an interest rate equal to the flow of benefits received. Thus, for fair actuarial balance, it is essential to calculate the Actuarial Contribution (Cat) rate based on equation 9, where f represents the social security factor, w means the rate of wage progression, i is the discount rate, T is the contribution period and N is the age limit of the survival plank used, in the case of this work, it is the IBGE 2017 plank.

After the previous studies, it became clear the substantial difference between the two approaches for calculating the flow of contributions one based on RGPS and the other based on actuarial science. The RGPS as already presented accumulates the contributions through a percentage, without actuarial criteria, which focuses on income. The other actuarialally fair as has also been presented, the multiplication factor or percentage is obtained through rigorously scientific criteria based on actuarial mathematics.
2.5 FLOW OF CONTRIBUTIONS IN RAP
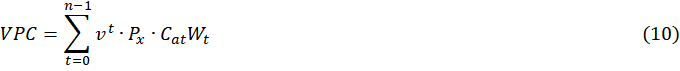
The contributions according to Afonso and Lima (2011) can be described mathematically through the actuarial formulation shown in equation 10. Thus, the VPC means the Present Value of contributions is obtained at present value updated by the compound discount factor given by the vt product by Px and multiplied by the income term given by CatWt, where Cat is given by equation 10 and Wt is given by equation 5. The flow of contributions is described as a finite series of immediate temporary advance variable payments.
Therefore, we thought of a hypothetical situation linked to the retirement situation by contribution time from four input data (gender, age of entry, retirement age and initial income), where the results could be easily replicated, so that it was possible to feed the discussion about the coherence of the RGPS system and, therefore, the justice in paying a certain amount monthly to the INSS to retire with a certain amount.
2.6 PRESENT VALUE OF THE FLOW OF RETIREMENT BENEFITS IN RAP
The calculation of the benefit flow will result in the benefit salary, the same amount calculated by the RGPS in equation 3. The Actuarial Social Security Regime seeks to calculate, as in the article by Afonso and Lima (2011), the present value of the flow of benefits, as it will assist in the interpretation of the degree of distance between contributions to the RGPS in relation to the actuarial social security regime. The calculation of the present value of the benefit flow in RAP is given by equation 11, where Sb is the benefit salary and FA is the actuarial factor.
![]()
The current factor of equation 12 is obtained by the product between the compound discount rate Vt of equation 8 with the probability of survival Px of equation 6. Therefore, the current factor FA is given by equation 11.
![]()
Based on this information from the calculation of the present value of the benefit flow in RAP and the current factor of equation 10, some studies on the theme presented follow.
3. PREVIOUS STUDIES AND RESEARCH HYPOTHESES
In this section of the course completion work is presented according to table 01, the general layout of the works that will contribute to the author’s vision and theoretical support.
Table 1 – Main studies on the theme
| Quotes | GOALS | Results | APPLICATIONS IN THE STUDY |
| Iyer, (2002) | Analyze and develop the mathematics of social security systems with a view to integral and differential formulation. | Actuarial Mathematics of Social Security Systems shows how social security systems are developed in their aspects of actuarial balance. | The social security systems presented in this work include the most adopted in the world, such as the simple distribution system (used in Brazil) and the direct capitalization system. |
| Gilat, (2006) | Matlab with Engineering Applications is one of the standard textbooks used in mechanical engineering, electrical and etc. courses. | The author used this book to assist in the creation of the routine of social security calculations of the General Social Security System and for the Actuarial Social Security Regime, the calculation routine is compiled in the appendix chapter. | Matlab applications as a solution and programming tool. |
| Chapman, (2006) | Textbook for programming structure concept applications in Matlab. | Programming in Matlab for Engineers was another textbook work widely used by the author. Together with Gilat’s book (2006) there was greater training of the author to develop the routines of social security calculations. | The contribution of this author to this work was to elucidate concepts of the decision structure, if – elseif – else –end, to judge the wage values and correctly apply the contribution rates to the RGPS and the actuarial social security regime, diverting the flow of routine between one path and another. As well as collaborating for the entition of style for -end repetition structures, to finitely calculate the value of compound discount rates to bring the contribution values and benefits to the present value. |
| Giambiagi & Afonso, (2009) | Calculate what would be a fair rate from an actuarial point of view. | The main conclusion of the authors was that the social security rate in force applied to the RGPS of 31% is excessive for some income groups. It was through this work that the author elaborated the theme on justice in the RGPS from the point of view of the contributions and benefits received by users. | Calculation of the ActuarialLy Balanced Social Security Contribution Rate: An Application to the Brazilian Case, is a publication article by Professor Giambiagi, is one of the great researchers of social security issues in Brazil. |
| Gonçalves & Letieri, (2010) | Social Security Contributions: An analysis in the Financial Statements of Municipalities of Pernambuco Municipalities with a View to Accountability. | This was a course completion work consulted by the author, whose importance was the description of closed-regime social security systems. | The theoretical foundation and social security laws mentioned in this study were consulted widely, for this reason the author used this publication as a reference. |
| Plamondon, et al., (2011) | Describe and analyze macroeconomic issues that influence the dynamics of the flow of contributions and benefits. | The main conclusion of the authors was the positive relationship between wage progression rate, level of economic development and compound discount rate. | Actuarial Practice in Social Security, this work, had an impact on the study of social security from the actuarial point of view. |
| Afonso & Lima, (2011) | Relate aspects of actuarial mathematics, as it involves biometric risk and compound discount. | It concluded that, maintaining biometric and macroeconomic factors, income strongly influences the contributory profile of the individual linked to the RGPS. | Analysis of the Distributive Aspects of Retirement by Contribution Time of the INSS with the Employment of Actuarial Mathematics, |
| Lima, Wilbert, Pereira, & Paulo, (2012) | Study the social security factor, one of the main parameters to calculate how much benefit will be receiving for contribution time. | The main conclusion of this work is the positive correlation between the social security factor and the amount of resources that the federal government has already saved to public coffers since the day the social security factor on the pensions granted came into force. | The Impact of the Social Security Factor on the Large Numbers of Social Security, this article cited Afonso and Lima (2011). |
| Penafieri & Afonso, (2013) | Create an Actuarially Fair Social Security Factor (FPAJ) that is less “punitive” for early retirements. | The authors investigate the actuarial justice of the social security factor on the contributions of the RGPS. The authors concluded that the social security factor reduces the value of the benefit of taxpayers far beyond actuarial equilibrium values. The authors create a substitute for the current social security factor. | Discussing social security justice is an important and much debated issue, as it is a factor of social balance, hence its importance. |
Source: Prepared by the authors (2019).
The complex dynamics of social security systems is widely discussed by (Iyer, 2002); Gremaud and Patrick (2004). According to these authors, the parameters that influence the social security system can be modeled by adopting the following simplifying hypotheses:
H1: The taxpayer does not be unemployed during the contributory period, that is, his income is characterized as a continuous function.
H2: The values of the economic parameters are considered constant throughout the contributory period.
H3: The pensions in question are exclusively for contribution time, are not considered retirements due to illness, disability and death.
The objective of the work does not include accurately evaluating the effect of the economic growth rate, real inflation and wage progression rate differentiating professions, education and etc. The author adopted values around the mean values used in the work of Gremaud and Patrick (2004), in addition, it becomes impossible to predict how economic parameters will behave over decades.
Thus, from these studies it was possible to construct the analyses, discussions and the methodology of the present in the work. Therefore, the next section to be presented is the methodology, this begins with a brief history of the RGPS, then will be presented the actuarial theory for the development of important concepts about justice in contributions to benefits, the next topic will address the routines of calculations developed by computational resource and its implications in social security calculation.
4. METHODOLOGY
The initial step of the methodological phase, in addition to the previous study presented in the chapter of the literature review, is the structuring of the computational resource that was used. The program used in this work was Matlab.
The simulation program in MATLAB was developed and structured to ask the user four information: gender of the individual (man or woman), initial age, retirement age and salary or initial income of entry into the social security system.
Some simplifying hypotheses were taken into account: contributions are initerruptas, disregarding the effects of income tax and inflation on the calculations of contributions and receipts of benefits. Figure 02 shows the insertion screen of the input data directly on the command prompt screen when the program is running.
Based on Afonso and Lima (2011) and Giambiagi and Afonso (2009) six simulation events of social security calculations were developed grouped by gender, three variations for men and three variations for women. All simulation parameters were the same for both sexes except income (1,200, 2,500 and 5,000).
Figure 2 – Matlab command prompt screen with the initial data entries for simulation calculations.
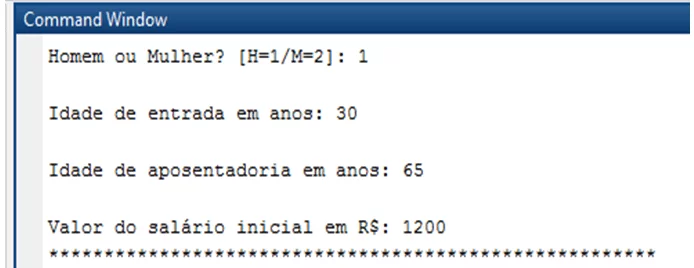
From these four input information, as already illustrated in Figure 2, the calculations of the RGPS and the actuarial social security regime are performed sequentially according to the program or calculation routine.
The next chapter will be the Results and Discussions, in this chapter will be shown the tables and graphs involving the equations presented in the Methodology, as well as will be presented the mathematics of the RGPS for the calculations of contribution and retirement compared to the calculations of the social security system, according to the precepts of actuarial science.
5. RESULTS AND DISCUSSIONS
5.1 INPUT PARAMETERS AND CONSTANTS
The routine of social security calculations is structured in data input and output, equally to the behavior of mathematical functions, the routine works from the previously configured constants, thus changing the input data if you change the output data.
Table 1 presents the data entry and the constants for the social security calculations of the RGPS and the Actuarial Pension Regime, both calculated sequentially according to the routine written in the Matlab available in the Appendix of this work.
The constants were assumed as average values for whatever the initial situation. Undoubtedly, the constants are the crucial part of the work as well as the most complicated part of justifying its adopted values, therefore the values adopted can be justified according to the works of Giambiagi and Afonso (2009); Plamondon, et al.(2011); Gremaud and Patrick (2004) and Afonso and Lima (2011) to value macroeconomic counts: growth rate, discount rate, wage progression rate.
The values of the input parameters and the values of the constants are presented according to table 2.
Table 2 – Entry and constant social security parameters.
| Input data | Constants | ||
| Age of entry (Woman) | 30 years old | Economic growth rate | 1% per year |
| Age of entry (Man) | Discount rate | 6% per year | |
| Retirement age (Woman) | 60 years old | ||
| Retirement age (Man) | 65 years old | ||
| Starting salary (both) | R$ 1.200,00 | Wage progression rate | 0.25% per year |
| R$ 2.500,00 | 0.5% per year | ||
| R$ 5,000.00 | 1.2% per year | ||
Source – Prepared by the authors.
The data of the age of entry and exit were selected according to the retirement rules by contribution time according to the INSS. The initial salary was defined at three levels for both genders, because the important thing here is to test actuarial justice under the same macroeconomic circumstances, varying only the biometric factor (gender), the ages of entry and retirement and the initial salary that characterizes, in general terms the class of the individual in low (R$ 1,200.00), average (R$ 2,500.00) and high (R$ 5,000.00).
5.2 SOCIAL SECURITY CONTRIBUTIONS TO RGPS
Table 3 shows the average contribution flows derived from the social security calculations of the RGPS as a function of retirement age, entry age and initial income. The average contribution values considerably between the same-sex wage levels, due to the initial income difference.
Table 3 – Average contributions sectioned by gender and initial income paid by taxpayers to the RGPS.
| Man | ||||
| Retirement age | Age of entry | Initial income (R$/month) | Average Contributions
(R$/month) |
Cumulative total (R$) |
| 65 years old | 30 years old | 1.200,00 | 122,00 | 52.703,68 |
| 30 years old | 2.500,00 | 300,58 | 129.850,26 | |
| 30 years old | 5.000,00 | 848,02 | 366.342,67 | |
| Woman | ||||
| Retirement age | Age of entry | Initial income (R$/month) | Average Contributions
(R$/month) |
Cumulative total (R$) |
| 60 years old | 30 years old | 1.200,00 | 117,99 | 43.891,86 |
| 30 years old | 2.500,00 | 288,61 | 107.363,77 | |
| 30 years old | 5.000,00 | 797,28 | 296.587,50 | |
Source – Prepared by the authors.
The cumulative total differs considerably from man to woman due to the contribution time being shorter in the case of women, since they retire 5 years earlier compared to men. It was not observed the application of actuarial concepts in the contributions to the RGPS, which according to Penafieri and Afonso (2013) represents an actuarial imbalance compromising the justice of contributions to the RGPS.
5.3 SOCIAL SECURITY FACTOR
The calculation of the social security factor was performed according to equation 2. Where the calculations were performed according to the guidelines already presented in the methodology for the RGPS, fulfilled the necessary conditions for retirement by contribution time, the social security factor will not act as a reduction of the value of the retirement benefit received by the taxpayer, on the other hand if the taxpayer retires before the legal and necessary conditions are met, the social security factor will reduce the value of the retirement benefit.
The initial income does not influence the value of the social security factor, as suggested in Table 4. The difference in the value for men equal to 1.0000 and for women equal to 0.6561 is due to the contribution time being reduced by 5 years for women and also by biometric differences, since men have lower life expectancy compared to women, according to the survival plank of IBGE 2017.
Table 4 – Social security factor segmented by gender.
| Man | ||
| Retirement age | Age of entry | Social security factor |
| 65 years old | 30 years old | 1,0000 |
| Woman | ||
| Retirement age | Age of entry | Social security factor |
| 60 years old | 30 years old | 0,6561 |
Source – Prepared by the authors.
In practice, the reduction of the social security factor was predicted for women in the RGPS as a way to imbue greater equity between genders, according to Penafieri and Afonso (2013), but some disagree with this, according to Afonso and Lima (2011), the lower social security factor punishes women further aggravated the historical differences in income between men and women. It is salutary to review that the social security factor was partially elaborated based on biometric criteria, because it takes into account life expectancy as disclosed by IBGE, although controversial the social security factor discourages early retirements and balances the longer life expectancy of women with the shorter life expectancy of men.
5.4 RGPS SOCIAL SECURITY BENEFITS
The results of the calculations of the benefits according to the parameters of table 2, generated from equation 3, the results presented according to table 5.
Table 5 – Flow of RGPS benefits to taxpayers, segregated by gender and initial income.
| Man | |||
| Retirement age | Age of entry | Initial income (R$/month) | Benefits
(R$/month) |
| 65 years old | 30 years old | 1.200,00 | 1.568,19 |
| 2.500,00 | 3.450,88 | ||
| 5.000,00 | 8.062,30 | ||
| Woman | |||
| Retirement age | Age of entry | Initial income (R$/month) | Benefits
(R$/month) |
| 60 years old | 30 years old | 1.200,00 | 989,68 |
| 2.500,00 | 2.160,28 | ||
| 5.000,00 | 4.931,19 | ||
Source – Prepared by the authors.
It is important to note that men will receive a higher retirement benefit value than their own initial income, remembering that the initial income will grow as a result of equation 5. In the case of women, they will receive less retirement benefit than they started contributing to the RGPS. The difference between the behavior of benefits paid to men and women is due to the social security factor, because according to table 4 men have a social security factor equal to 1.0000 and women equal to 0.6561.
Due to what was exposed, the behavior of contributions to the RGPS does not suggest following the actuarial precepts, because the contribution is calculated by multiplying the taxpayer’s income with percentages according to table 1. Regarding the benefits paid to retirees by the RGPS, there is evidence of the presence of concepts of actuarial science, seeking in thesis balance and justice between male and female taxpayers given their biometric characteristics crystallized in the survival board of IBGE 2017.
The issues of contributions are sensitive to public opinion as much as the benefits received by contribution time, because it influences the quality of life of the taxpayer at the delicate moment of life, when the years charge the days of youth, therefore, the loss of work capacity directly impacts on the income of the person.
5.5 THE RGPS COMPARED TO THE ACTUARIAL SOCIAL SECURITY REGIME
This section is dedicated to the behavior of social security values from the point of view of actuarial science and compares with the social security values of the RGPS shown in the previous section.
Contributions from the point of view of actuarial science are presented according to table 6 in the last column.
Table 6 – Difference between contributions to the RGPS for the Actuarial segregated by genders.
| Man | ||||
| Retirement age | Age of entry | Initial income (R$/month) | Average Contributions – RGPS
(R$/month) |
Actuarial Average Contribution (R$) |
| 65 years old | 30 years old | 1.200,00 | 122,00 | 88,43 |
| 30 years old | 2.500,00 | 300,58 | 206,47 | |
| 30 years old | 5.000,00 | 848,02 | 483,74 | |
| Woman | ||||
| Retirement age | Age of entry | Initial income (R$/month) | Average Contributions – RGPS
(R$/month) |
Actuarial Average Contribution (R$) |
| 60 years old | 30 years old | 1.200,00 | 117,99 | 87,30 |
| 30 years old | 2.500,00 | 288,61 | 190,92 | |
| 30 years old | 5.000,00 | 797,28 | 438,19 | |
Source – Prepared by the authors.
It is noticeable the increase in the average of contribution values as the initial contribution income rises for both the RGPS and the actuarial regime, it is also clear the substantial difference between the average of the contributions to the RGPS for the Actuarial. The considerable difference between contributions is the result of the foundations postulated by actuarial science, where the contribution rate is notably lower, according to table 6, in relation to the RGPS rate.
Table 6 – Contribution rate to the RGPS compared to the rate of the Actuarial Social Security Regime.
| Contribution Salary (R$) | Rate | General rate: worker + company | Actuarial Rate Man | Actuarial Rate Women |
| Up to 1,659.38 | 8% | 8%+20% = 28% | 16% | 13% |
| From 1,659.39 to 2,765.66 | 9% | 9%+20% = 29% | 17% | 14% |
| From 2,765.67 to 5,531.31 | 11% | 11%+20% = 31% | 17% | 14% |
Source – Prepared by the authors.
It is evident that, according to table 6, the actuarial rate is lower in both sexes and initial income ranges than the RGPS rates. Giambiagi and Afonso (2009) came to this same conclusion.
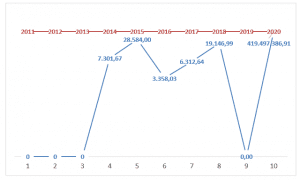
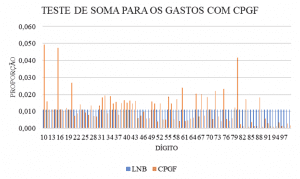
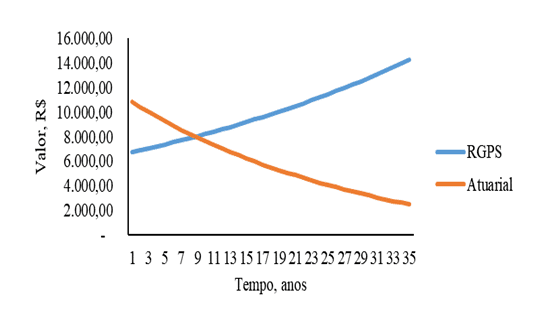
The system of contribution to the RGPS is very different to the Actuarial Regime in all its aspects, this is evident when one perceives the contribution values accumulated over the years. The first figure shows the relationship between contributions to the RGPS and the Actuarial Contribution Regime. The behavior of the curves is clearly divergent, where the RGPS tends to always increase its contribution values as time progresses, opposite to this the Actuarial Regime shows that the contribution values decrease. In addition, an important aspect is possible at the intersection between the two graphs, where from the age of 11 the Actuarial Contribution Regime becomes more financially advantageous for the taxpayer in relation to the RGPS.
Figure 1 – Contribution to the Social Security Systems RGPS and Actuarial Social Security Regime as a function of time for men with initial income of R$ 1,200.00.
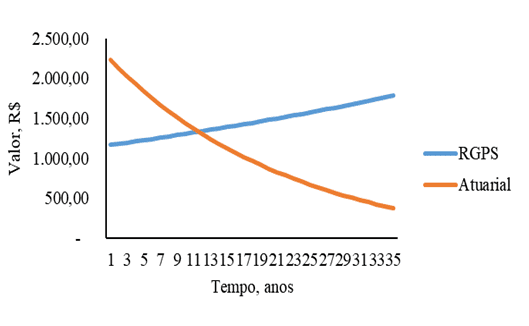
The divergent behavior of the curves in Figure 1 is justified by the absence of biometric considerations in the accumulation system to the RGPS, in which in the actuarial regime of contribution it is evident the presence of actuarial assumptions, because the tendency is to decrease the probability of survival of the taxpayer as time passes, as presented in the Theoretical Framework.
Similar behavior figure 1 can be shown in Figure 2. In Figure 2, the initial contribution income of the woman totals a value close to R$ 2,000.00 and ends up totaling R$ 500.00 close to the 30th year of contribution and women in Figure 2, however, the difference is in the total actuarial contribution that is higher, observing the 1st year of contribution to the total value is between R$ 2,000.00 and R$ 2,500.00 close to the midpoint of the two values (R$ 2,250.00).
Figure 2 – Contribution to the Social Security Systems RGPS and Actuarial Social Security Regime as a function of time for women with initial income of R$ 1,200.00.
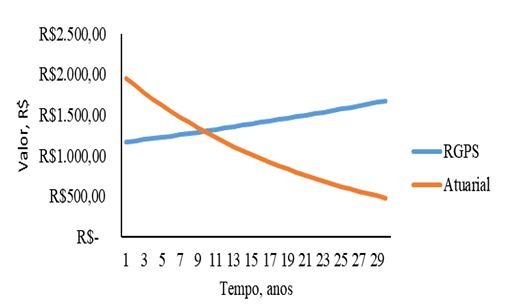
Another difference is in Figure 1 in relation to Figure 2 is in the time of intersection between the two curves, in graph 1 the intersection is close to the 11 years of contribution, in which, in graph 2 is close to 9 years.
The difference in actuarial contribution time of figures 1 and 2 also follows the same logic as graph 3 and 4. The initial income of R$ 2,500.00 men and women follows the same characteristics of the actuarial curve of figures 1 and 2. Below figure 3.
Figure 3 – Contribution to the Social Security Systems RGPS and Actuarial Social Security Regime as a function of time for men with initial income of R$ 2,500.00
The difference is in the total contributions, since the higher the initial income will be the contributions, as men have lower life expectancy and retire later, so figures 1, 2, 3 and 4 show that men in the actuarial system contribute higher values annually in relation to women.
Figure 4 – Contribution to the Social Security Systems RGPS and Actuarial Social Security Regime as a function of time for women with initial income of R$ 2,500.00.
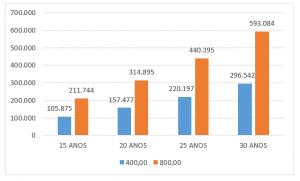
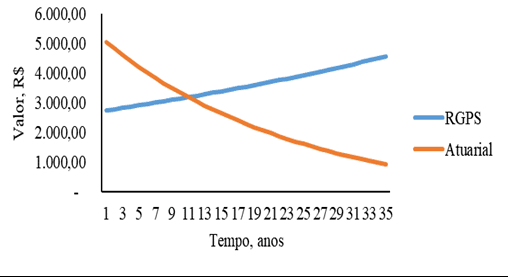
Figures 5 and 6 have similar behavior to the other figures, however the initial salary range is R$ 5,000.00 for both genders in figures 5 and 6.
The effect of initial income on aturais contributions shows that the higher the initial income, the higher the actuarial contributions. Men who contribute R$ 5,000.00 contribute just over R$ 10,000.00 in the first year, women total contribution just below R$ 10,000.00 in the 1st year.
Figure 5 – Contribution to the Social Security Systems RGPS and Actuarial Social Security Regime as a function of time for men with initial income of R$ 5,000.00.
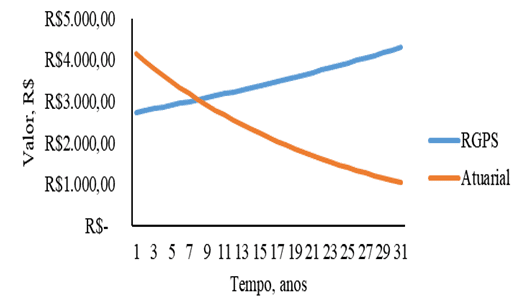
Regarding the behavior of the point of intersection between the contributory system of the RGPS and the Actuarial in figures 5 and 6, figure 5 of the men the value of the intersection is close to 9 years and how much that of the women figure 6 is close to 5 years. This divergence in the behavior of the point of intersection can be justified given the actuarial characteristics between men and women.
The man represented in Figure 5 differs from the men shown in figures 1 and 3, due to the macroeconomic characteristics that reflect on the contribution and time to the contribution system becomes advantageous in relation to the RGPS. Where figures 5 and 3 do not have much difference in the time of intersection in the initial incomes of R$ 2,500.00 and R$ 5,000.00, however, the difference becomes more evident in the time of intersection as the income increases. This suggests that the higher the individual’s income regardless of gender, the less it will compensate for the RGPS
Figure 6 – Contribution to the Social Security Systems RGPS and Actuarial Social Security Regime as a function of time for women with initial income of R$ 5,000.00.
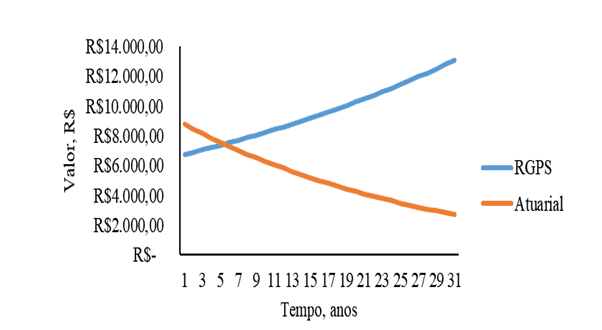
Figure 6 corresponds to the graph of women with initial income of R$ 5,000.00. Observing this graph is evident that the actuarial system for women in the range of R$ 5,000.00 intercepts the graph with the RGPS in the time close to 5 years, this is the lowest theme of interception between the curves evidenced in all figures from 1 to 5. Therefore, for women who earn an initial income of R$ 5,000.00 from the 5 years of contribution, the actuarial contribution system is more advantageous in relation to the RGPS.
The graphs point to the same trend, the contribution to the RGPS is in opposition to the Actuarial Regime, in cases there was a peculiar behavior, the contributions to the RGPS start at a lower level in relation to the Actuarial, as the time passes the contributions to the RGPS increases, while the contributions to the Actuarial Regime decrease. This behavior is justified given the characteristics of each particular system.
In addition to the contributions being higher in the RGPS, this elevation behavior becomes evident from the point of intersection of the two curves in graphs 1 to 6. It is suggested that after the 6 years of contribution the RGPS ceases to be advantageous and becomes much heavier for the taxpayer in relation to the Actuarial Social Security Regime.
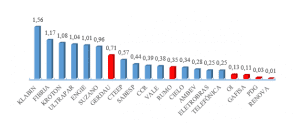
Figure 7 – Actuarial Factor Curve for men and women as a function of time.
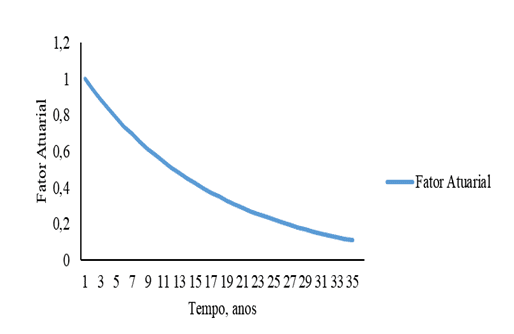
In RGPS as income increases over time, contributions also increase due to equation 1. In opposition to the RGPS, the Actuarial Regime decays with the value of contributions as a consequence of the actuarial factor, decreasing as a function of time according to figure 7 of equation 11. This decrease is influenced by the probability of survival decrease, as equation 6 and the discount rate also decrease, equation 8.
6. CONCLUSION
Previous studies were conducted to understand how social security parameters are calculated in practice, the basis for calculating the RGPS for retirement by contribution time, the values of contribution to the RGPS, social security factor and the benefit salary.
The second step was the study of actuarial theory on survival boards and actuarial mathematics. The third step was to operationalize the calculations of theoretical and practical values through Matlab, a computer program, and later comparison of the results obtained.
In the third step, as already mentioned, a structured programming code was developed in Matlab, where the social security system of the real world and the actuarial world was calculated, starting with four input variables (man or woman, age of entry, retirement age and initial income). The calculations were repeated six times as follows, three times for men all with the same age of entry 30 years, with the same retirement age 65 years, however with different incomes (1,200, 2,500, 5,000). The same procedure was repeated for women differing only in retirement age 60 years.
The great question that this course conclusion work sought to answer with absolute effort in the three steps was: “Is there justice in the system of contribution to the RGPS from the point of view of actuarial science? That is, the income and actuarial factor applied can determine the justice of contributory recollection? ”
It is concluded that the RGPS is not fair to answer the first part of the question, because from the point of view of actuarial science that seeks balance, the behavior of the contribution curves of the RGPS and the Actuarial Pension Regime exhibit a very distinct tendency and values, since the trend of the contribution curve of the RGPS is progressive increase, on the other hand , the actuarial regime curve tends to progressive decrease.
This work confirms as verified by Giambiagi and Afonso (2009), the social security rate charged by the INSS through the RGPS is too high, where the continuous increase in contribution puts pressure on the pocket of the elderly taxpayer mainly in the last years of contribution. Opposite effect was demonstrated by the Actuarial Pension Regime.
Now answering the second and last part of the question, there is evidence that it is possible to determine the justice of contributory recollection from the point of view of actuarial justice, because the actuarial factor that will affect contribution income is obtained through biometric functions based on actuarial science.
The RGPS calculates the value of contributions through a percentage that will focus on income, not informing the company how it has reached such a percentage and how fair it can be not only for the taxpayer but also for the institution that pays. Because the monthly retirement income assumed the same for both the RGPS and the Actuarial Pension Regime, however, much more contributes to the RGPS in relation to the actuarial one.
The values of contributions and benefits differ between the same gender as a result of the initial income, influencing the rate of salary progression and the contribution rate, which resulted in a higher amount of contribution paid to the RGPS. In the intergender comparison, there was a substantial difference, because women retire earlier and have a longer life expectancy, according to the survival plank, determining a lower amount to be paid in contribution to the social security system, in contrast they receive less retirement benefit compared to men.
The issue of social security is not exhausted, because the subject is broad and of strong interest to society. In view of this, in order to broaden the discussions, therefore, as suggestions for future work is proposed the analysis of the reasons that generate the actuarial imbalance in the RGPS, another suggestion is to compare social security plans offered in the market that can approach the actuarial criteria, another suggestion is to work on the construction of a computational application aimed at the teaching of actuarial science.
7. REFERENCES
- Afonso, L. E., & Lima, D. d. . Uma Análise dos Aspectos Distributivos da Aposentadoria por Tempo de Contribuição do INSS com o Emprego de Matemática Atuarial. Revista Gestão & Políticas Públicas, pp. p. 7-33.2011.
- Chapman, S. J. Programação em Matlab para Engenheiros. São Paulo: Thomson.2006.
- Filho, A. C. (2010). Cálculo Atuarial Aplicado (2ª ed.). São Paulo: Atlas.
- Giambiagi, F., & Afonso, L. E. Cálculo da Alíquota de Contribuição Previdenciária Atuarialmente Equilibrada: Um Aplicação ao Caso Brasileiro. rbe, v. 63, pp. p. 153-179.2009
- Gilat, A. Matlab com Aplicações em Engenharia (2ª ed.). Porto Alegre: Bookman.2006.
- Gonçalves, & Letieri, V. . Contribuições Previdenciárias: Uma análise nas Demonstrações Contábeis de Prefeituras de Municípios Pernambucanos com Vistas à Accountability. Universidade Federal de Pernambuco (Dissertação de Mestrado), p. 113. Recife, PE.2010.
- Gremaud, R. F., & Patrick, A. Regime de Previdência dos Servidores Públicos: Equilíbrio Financeiro e Justiça. p. 19.2004.
- HEITOR CAMPANI, C., & DIAS DA COSTA, T. R. Pensando na aposentadoria: PGBL, VGBL e autoprevidência. Universidade Federal do Rio de Janeiro. Rio de Janeiro: COPPEAD. doi:1518-3335.2016.
- IBGE. (s.d.). Acesso em 21/10/2018 de Outubro de 2018, disponível em http://sa.previdencia.gov.br/site/2016/07/TABUASDEMORTALIDADEIBGE2014_EXTRAPOLADAS.xls
- Iyer, S. Matemática Atuarial de Sistemas de Previdência Social (Vol. v. 16). Brasília, DF: Ministério da Previdência e Assitência Social.2002.
- Lima, D. V., Wilbert, M. D., Pereira, J. M., & Paulo, E. O Impacto do Fator Previdenciário nos Grandes Números da Previdência Social. Revista de Contabilidade & Finanças – USP, v. 23(n. 59), pp. p. 128-141.2012.
- COSTA, Raimundo Nonato Vieira, ARAUJO, Jamille Carla Oliveira, SILVA, Leidian Moura da Nascer, Crescer e Sobreviver: Uma Análise das Modalidades de Aposentadoria da Previdência Privada sob os Planos PGBL e VGBL. (2018). XV Congresso USP de Iniciação Científica em Contabilidade, (p. p. 20). São Paulo.
- Penafieri, A. C., & Afonso, L. E. . O Impacto da Mudança da Regra de Cálculo das Aposentadorias por Tempo de Contribuição do INSS: o Fator Previdenciário é Atuarialmente Justo? Economia Apicada, v. 17, 2013. pp. p. 667-694..
- Plamondon, P., et. al.. (2011). Prática Atuarial na Previdência Social (Vol. v. 33). (S. d. Brasil, Trad.) Brasília, DF, Brasil. 2011.
- Rodrigues, J. A. . Gestão de Risco Atuarial. São Paulo: Saraiva. 2008.
[1] Master’s degree in Mechanical Engineering (UFPA); Graduation in Mechanical Engineering (UFPA); Graduation in Accounting Sciences (UFRA)
[2] Master in Business Administration, MBA Accounting management, expertise, audit and control, Bachelor of Accounting
[3] PhD student in Science and Mathematics Education; Master’s degree in Electrical Engineering; Specialization in Environmental Education and Sustainability; Bachelor’s degree in Mathematics.
Submitted: May, 2019.
Approved: June, 2019.