ORIGINAL ARTICLE
NASCIMENTO, Alan Jacson Ferreira [1], MOURA, Edvander Luis de [2]
NASCIMENTO, Alan Jacson Ferreira. MOURA, Edvander Luis de. Analysis of Financial Statements: A Case Study at Fiat Automóveis S/A. Revista Científica Multidisciplinar Núcleo do Conhecimento. Year 06, Ed. 04, Vol. 07, pp. 107-133. April 2021. ISSN: 2448-0959, Access link: https://www.nucleodoconhecimento.com.br/accounting/at-fiat-automoveis
SUMMARY
The automotive sector in Brazil, both internally and externally, since the first industrial revolution, has been bringing advances to society, developing technology and heating the economy. This work was carried out with the objective of studying the financial and economic statements of the company Fiat Automóveis S.A. The analysis of the financial statements summarizes in an orderly manner the financial and economic situation of the company. It serves to inform and provide an assessment of past/present management, as well as subsidizestrategic decisions for future management. Through the statements, such as balance sheet and the statement of income for the year, two-period indices are extracted to observe the financial and economic situation of the company Fiat Automóveis S.A. The methodology was based on qualitative, bibliographic and explanatory research on the importance of balance sheet analysis. In turn, the result found is an evaluation consisting of specific analysis, demonstrating the financial and economic situation of the company, having as comparative reference the management 2006 and 2007.
Keywords: Financial and economic analysis, balance sheet analysis, financial and financial statements.
1. INTRODUCTION
The importance of the automotive sector in Brazil is clear. Both internally and externally, since the first industrial revolution, they have been bringing advances to society, developing technology, generating jobs and heating the economy.
According to ANFAVEA – National Association of Motor Vehicle Manufacturers, Brazil reached the position of ninth largest producer of motor vehicles in 2006, with two million and 600,000 units produced.
Fiat Automóveis S.A. at the end of 2007, it had 15,543 employees, an increase of 3,891 compared to 2006. The company in 2007 had a net operating income of R$17,115,187,000, with a growth of 39.5% over 2006, reflecting the higher sales volume in the local market (+31.9%), as well as the increase of 7.76% in dollar prices of exports, seeking to reduce the corrosion of margins caused by the overvalued real.
In the internal scenario, performance in 2007 was positive, with growth in the world economy. This sector was also responsible for an investment of one billion and 572 million dollars according to ANFAVEA.
The volume of light vehicle exports increased compared to 2006 by 10.4% (105,912 units in 2007 and 95,912 units in 2006), an increase of 27.0% in value of US$1,106.8 million in 2007 compared to US$ 871.5 million in 2006.
It is emphasized that accounting is a science that takes care of the generation of information contained in the company’s assets and has the function of interpreting, recording and controlling all the facts that affect the company’s asset situation. Through the financial statements collected by the company, information can be extracted regarding its economic and financial position, hence the importance of this study.
The importance of balance sheet analysis is to develop based on the financial statements sufficient information for decision making, because more and more information is taking a decisive role in business management. The information provides an assessment of past/present management, as well as subsidising decisions and strategies for future management.
This work aims to analyze the financial statements of Fiat Automóveis S.A. through a comparison of the management indexes of 2006 and 2007, identifying the factors that led the company to have increased its net profit by 107.40%.
Finally, the problem of this research was to analyze the aspects that led to Fiat Automóveis S.A. to have increased its net income in 2007 by 107.40% compared to 2006. It was defined as a hypothesis the decrease in costs from 2006 to 2007, where Fiat with the best costs increased its profit.
The knowledge acquired with this course completion work will provide the opportunity to deepen the study of the theme, expanding sources of research and technical knowledge added throughout the course of accounting sciences and taxes.
2. ORGANIZATION UNDER STUDY
According to the information obtained on the website of Fiat Automóveis S/A, the company of said study has been installed in Betim/MG, since 1976. Fiat currently operates in three shifts, with a daily production rate of approximately 2,500 cars.
Fiat companies in the country are today a parameter of efficiency and quality in the Brazilian business world. There are 15 companies occupying a leading position in almost all sectors where they operate and vying for leadership in the other sectors.
The group’s main activities in Brazil focus on the production and sale of cars and trucks (Fiat Automobiles and Iveco); production of iron castings for almost 100% of the national automotive industry (Teksid do Brasil); manufacture of agricultural and construction machinery (CNH); production and commercialization of automotive components (Magneti Marelli); supply of industrial automation equipment (Comau); consulting and staff training (Isvor); consulting and business administration (Business Solutions). The Fiat Group also operates in the financial credit sector (CNH Capital), financial management (Fiat Finanças) and insurance brokerage (Fides), in addition to maintaining in Brazil a bilingual school, the Torino Foundation.
2.1 MISSION
Develop, produce and market cars and services that people prefer to buy and be proud to own, ensuring the creation of value and the sustainability of the business.
2.2 VISION
To be among the main players in the market and to be a reference for excellence in automotive products and services.
3. THEORETICAL REFERENCE
3.1 HISTORY
In Brazil, S/A companies are obliged to publish their numbers through the financial statements at the end of each accounting year. The purpose of bringing up the intent and correct performance of its administrators.
The growth of companies led managers to a concern with the decisions made over time, which led to the need to create tools that would help them in the management of the company. The tools that monitor the decisions made are called financial statements.
Financial analysis is important for the economic and financial knowledge of other companies, nobly competitors and suppliers. The most important of the analysis instrument, however, is its internal use by the company. (PADOVEZE, 2004, p. 191).
3.2 ACCOUNTING FUNCTION
Accounting has the function of interpreting, recording and controlling all acts that give rise to facts that affect the company’s patrimonial, financial and economic situation. A good knowledge of accounting mechanisms is necessary for the development of a good financial analysis, but it alone is not enough.
3.3 MANDATORY REPORTS
According to the requirement of the civil code already mentioned, Article 176 of Law No. 6,404/76 establishes that, at the end of each fiscal year, the company’s board of directors must prepare, based on the bookkeeping, the following financial statements, which shall clearly express the company’s equity situation and the changes that occurred in the year:
3.3.1 BALANCE SHEET
In the Balance Sheet (BP) the company demonstrates the nature and values that make up the company’s assets, in a given period.
The balance sheet shows the equity and financial position of a company at any given time. The information that this statement provides is completely static and, most likely, its structure will be relatively different sometime after its closure. However, due to the relevant trend information that can be extracted from its various groups of accounts, the balance sheet will serve as an indispensable starting element for the knowledge of a company’s economic and financial situation. (ASSAF NETO, 2006, p.67).
3.3.2 STATEMENT OF INCOME FOR THE YEAR
The Statement of Income for the Year (DRE) reveals the results of the period and the factors generating this result.
The income statement for the year aims to provide, in a schematized manner, the results (profit or loss) earned by the company in a given fiscal year, which are transferred to equity accounts. Profit (or loss) is the result of revenues, costs and expenses incurred by the company in the period and appropriated under the jurisdiction regime, that is, regardless of whether those amounts have been paid or received. (ASSAF NETO, 2006, p.84).
3.3.3 STATEMENT OF ACCUMULATED PROFITS OR LOSS
The Statement of Retained Earnings or Losses (DLPA) that shows the change in the accumulated profit and loss account from one period to the next.
According to Iudícibus (1998, p.59) defines that the statement of income for the year ends with the calculation of net income. Then, the net income is carried to the statement of accumulated profits or losses to make its distribution.
3.3.4 DEMONSTRATION OF CHANGES IN SHAREHOLDERS’ EQUITY
The Statement of Changes in Shareholders’ Equity (DMPL) that reveals the variation occurred in the net worth group.
According to ASSAF (2006, p.100) the statement of changes in net worth is a more comprehensive accounting statement than the statement of accumulated profits or losses, and the company may choose whether or not to prepare them. If published, this statement legally replaces that of retained earnings.
3.3.5 EXPLANATORY NOTES
In addition to the financial statements mentioned above, accounting adds to those statements other additional information in order to enrich the reports and prevent them from becoming misleading.
The explanatory notes are intended to clarify certain important information that cannot be detailed in the financial statements prepared. For example: composition of share capital; detailing long-term debts; the company’s shareholding in other companies; criteria for the evaluation of assets, etc. (ASSAF NETO, 2006, p.57).
3.3.6 COUNCIL OPINION
It is important to remember that the law does not require the publication of the opinion of the supervisory board; when it exists. Such an opinion must be offered to the shareholders’ general meeting, but its publication is optional.
3.3.7 OPINION OF INDEPENDENT AUDITORS
The Opinion of the independent auditors is always the responsibility of the management of the company and are signed by the duly authorized accountant.
3.3.8 CASH FLOW STATEMENT
The Cash Flow Statement (DFC) aims to show how availability movements occurred in a given period of time.
According to IUDICIBUS (2002, p.220), the Cash Flow Statement is a financial flow, because they reflect the money movements that occurred in the entities. The difference is verified in the scope of approaches of these reports.
3.3.9 STATEMENT OF ADDED VALUE
Statement of Added Value (DVA) aims to inform the wealth created by the company and the form of distribution.
3.3.10 MANAGEMENT REPORT
The Management Report highlights the social business and the main administrative facts that occurred in the year, investments in other companies, the policy of distribution of dividends and profit reinvestments.
3.4 BALANCE SHEET ANALYSIS
The balance sheet analysis is extremely important for companies, because it is in them that all the information of their economic and financial situation is found. The balance sheet analysis allows debugging the static information of the financial statements bringing to the reader the correct idea of the movement of accounts occurred with a given company in the fiscal year.
3.5 VERTICAL/HORIZONTAL ANALYSIS
Through horizontal analysis, we compared the same account or group of accounts in several periods, trying to evaluate the variations that occurred, that is, its evolution.
Index number = Vd / Vb x 100
In the vertical analysis, the percentage of each account is calculated in relation to the total asset. In the balance sheet for example, is how much an account represents in relation to the total of a group of accounts.
Av n = RUBRICA n / BASE n x 100
3.6 ANALYSIS OF FINANCIAL AND ECONOMIC INDICATORS
The evaluation of the company is made through indexes, requires the comparison with standards and the setting of the relative importance of each index.
The indexes are divided into two groups that highlight the financial and economic aspects.
Financial aspects are divided into: structure and liquidity.
-The structure indices are: share of third-party capital, composition of indebtedness, fixed equity and fixed assets of non-current resources.
These indexes show the breakdown of the major lines of financial decisions, terms of obtaining and applying resources.
3.6.1 THIRD-PARTY EQUITY
Indicates how much the company took from third-party capital to R$100 of equity. The lower this index, the better.
Formula: Third-party capital / Equity x 100
3.6.2 COMPOSITION OF INDEBTEDNESS
Indicates the percentage of short-term obligations in relation to the total of the obligations. The smaller the better.
Formula: Liabilities / Capital of third parties circulating x 100
3.6.3 IMMOBILIZATION OF SHAREHOLDERS’ EQUITY
Indicates how much the company has invested in permanent assets for each R$100 of shareholders’ equity, that is, when the company has invested in permanent assets. The smaller the better.
Formula: Permanent Assets / Equity x 100
3.6.4 IMMOBILIZATION OF NON-CURRENT RESOURCES
Indicates the percentage of non-current assets of shareholders’ equity plus the long-term chargeable that was destined to the permanent asset. The smaller the better.
Formula: Permanent asset / equity + Long-term payable x 100
3.6.5 GENERAL LIQUIDITY
This index also aims to verify the company’s ability to make its payments, but now it commishes the overall ability of short- and long-term payments.
Formula: General Liquidity = AT+ RLP / PC + ELP
3.7.6 CURRENT LIQUIDITY
This indicator aims to verify whether the company has the ability to make its payments in the short term. To calculate current liquidity, the current asset is taken and divided by current liabilities. The amounts to be received and payable in the short term (Up to 360 days) are understood by rolling.
Formula: Current Liquidity = Current Assets / Current Liabilities
3.6.7 DRY LIQUIDITY
This indicator is similar to the previous one, the difference is that in this stock is excluded from the calculation of the asset. In this way the index will be smaller than the previous index.
Formula: Dry Liquidity = (Current Assets-Inventories) / Current Liabilities
Economic aspects are divided into: profitability
-Profitability indices are: Active turnover, net margin, asset profitability and return on equity.
3.6.8 ACTIVE TURNOVER
Indicates how much the company sold for each R$ 1.00 of total investment. The bigger the better.
Formula: Net Sales / Asset
3.6.9 NET MARGIN
Indicates how much the company makes profit for every R$ 100 sold. The bigger the better.
Formula: Net Income / Sales x 100
3.6.10 ASSET PROFITABILITY
Indicates how much the company obtains from profit for each R$ 100 invested. The bigger the better.
Formula: Net Income / Assets x 1000
3.6.11 RETURN ON EQUITY
Indicates how much the company obtains from profit for each R$ 100 of equity invested. The bigger the better.
Formula: Net Income / Average Equity x 100
3.6.12 AVERAGE TIME OF RECEIPT OF SALES
Formula: Duplicates to receive / daily sales
Formula: Duplicates to receive / sales x 360
The average time of receipt of sales indicates how many days, on average, the company takes to receive its sales. The volume of duplicates to be received is the result of two basic factors: (a) amount of term sales; and (b) time granted to customers for payment. The terms of sales in a company comprise the terms granted to customers, the discounts granted for cash payment, and the instruments for formalizing the term sale. (SILVA, 2005, p.279).
3.6.13 AVERAGE PAYMENT TERM FOR PURCHASES
Formula: Suppliers / purchases x 360
According to Silva (2005, p.281) “The average payment period for purchases indicates how many days, on average, the company takes to pay its suppliers.”
3.6.14 AVERAGE TIME OF RENEWAL OF INVENTORIES
Formula: Inventories / Average cost of sale x 360
The average time frame of inventory rotation indicates how many days, on average, the products are stored in the company before they are sold. The volume of inventories maintained by a company stems fundamentally from its sales volume and storage policy. (SILVA, 2005, p.277).
3.6.15 OPERATING CYCLE
This figure shows the natural sequence of the operational phases of the company, defined by operational cycle, starting with the purchase of materials that will be directly or indirectly used and leading to the collection of sales.
This indicator shows the purchase and receipt of the sale.
Formula: PMRV + PMRE
4. METHODOLOGY
4.1TYPE OF RESEARCH
4.1.1 HOW MUCH THE APPROACH
The method adopted in this research is of qualitative characteristics, more focused on the social scope. It is characterized by complex approaches related to sociopolitical, economic and cultural problems, through the use of static resources and techniques.
4.1.2 FOR THE PURPOSES
As for the purposes of the research, the research was descriptive and explanatory characteristics. The proposed study had as one of its main objectives to explain the economic and financial indicators that provided an evaluation of past/present management, as well as support strategic decisions for future management, which characterizes as descriptive research.
4.1.3 AS TO THE MEANS
As for the means, the research was of bibliographic characteristic and case study. As for bibliographic, because the use of material accessible to the public in general, such as books, newspapers, magazines, articles and balance sheets and financial statements already published, was used.
4.2 UNIVERSE AND SAMPLE
The universe of this research is Fiat automóveis S/A where its main financial statements for the year 2006/2007 will be analyzed.
The sample of this research is the accounting statement of Fiat Automóveis S/A.
4.3 DATA COLLECTION
As for data collection, the research was of bibliographic characteristic. Data were collected from books, newspapers, articles, magazines and on the Internet. The company’s financial statements of the study were also extracted from the Internet.
4.4 DATA PROCESSING
Regarding the data treatment, the research was by content analysis.
With the data collection it was necessary to analyze the main economic and financial indicators of the company. Calculated through indexes and formulas that led to a current economic diagnosis of the company under study.
5. ANALYSIS AND INTERPRETATION OF DATA
5.1 CAPITAL STRUCTURES
5.1.1 CAPITAL STRUCTURES
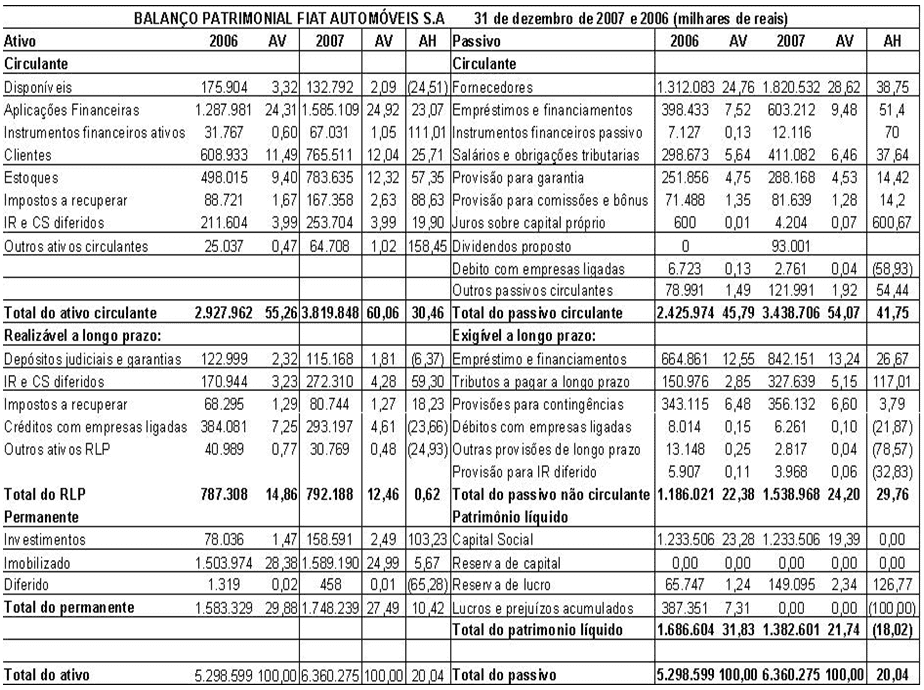
Regarding the share of third-party capital, Fiat had a growth, that is, for each R$ 100.00 of equity in 2006 it had R$ 214.16 of third-party capital, went to R$ 360.02 in 2007, significantly varying R$ 145.86 from one period to the next. The main variations were the supplier accounts, which increased to 38.75%, loan and short-term financing increased to 51.40% and long-term increased to 26.67% and salaries and social and tax bonds increased to 37.64% these accounts ranged from 2006 to 2007.
5.1.2 COMPOSITION OF INDEBTEDNESS
When the composition of indebtedness, with regard to short-term obligations in relation to total obligations in 2006, accounted for 67.16 % of the total. In 2007, it represented 69.08% of the short-term total. There was a 1.925% short-term increase over total bonds. The main variation was the short- and long-term loan and financing account, which increased by 78.07% in the year 2006 to 2007.
5.1.3 IMMOBILIZATION OF SHAREHOLDERS’ EQUITY
In 2006 fiat company invested R$93.88 in permanent assets, for each R$ 100.00 of shareholders’ equity, 2007 this amount increased to R$126.45. Representing a growth of R$32.57 for each R$100.00 of shareholders’ equity.
5.1.4 IMMOBILIZATION OF NON-CURRENT RESOURCES
For each R$100.00 of shareholders’ equity and long-term chargeable in 2006, Fiat allocated R$55.12 of its non-current assets to the permanent asset, ranging in 2007 to R$59.84, with a small variation of R$4.72.
5.2 LIQUIDITY
5.2.1 GENERAL LIQUIDITY
The general liquidity for each R$1.00 of current liabilities more chargeable in the long term, fiat has in its long-term current assets in 2006 R$1.03.In 2007 for each R$1.00 of total debt it had R$0.93 of current assets and long-term realisable, causing Fiat to need to carry out its permanent assets to meet its total obligations which is negative.
5.2.2 CURRENT LIQUIDITY
Current liquidity for each R$1.00 of current liabilities, Fiat has current assets in 2006 R$1.21, i.e., a surplus of R$ 0.21. In 2007, the current asset fell to R$1.11 and even then Fiat had a surplus of R$0.11. This difference from one period to the other was due to variations in the supplier accounts, loans and financing that increased more than the current assets.
5.2.3 DRY LIQUIDITY
As for dry liquidity, Fiat has less inventories for every R$ 1.00, that is, it does not need to carry out inventories to cover the liability. In 2007, it fell and started to represent R$ 0.88, with a fall of 0.12. The difference in this index in relation to the current liquidity index is mainly due to the inventory account that went from 9.40% of the total asset in 2006 to 12.32% in 2007.
5.3 PROFITABILITY
5.3.1 ASSET TURNOVER
As for the profitability the turnover of the asset increased from one period to the next, that is, in 2006 for each R$1.00 invested the Fiat company sold R$2.32 arriving in 2007 for each R$1.00 invested in the asset, at R$2.69. With this there was a variation of R$0.37 from 2006 to 2007. This was due to the 39.49% increase in net sales from 2006 to 2007.
5.3.2 NET MARGIN
Net margin increased from one period to another, where for every R$100.00 sold in 2006 net income went from R$6.55 increased in 2007 to R$9.74 profit, with an increase of 107.40%. This was mainly due to the increase in sales of 39.49% from 2006 to 2007.
The growth of 27.7% of vehicles sold in relation to 2006, was driven by the reduction of interest rate, credit expansion, lengthening of deadlines and “FlexFuel” engine that stimulated the exchange of gasoline vehicles for flexible gasoline or alcohol.
The main success factors continued to be the constant improvement of product quality, service and services of the dealer network, good communication with customers, the launch of Novo Palio and Punto and the faster speed with which the company responded to increased market demand. (DIÁRIO DO COMÉRCIO, 2008, p.5).
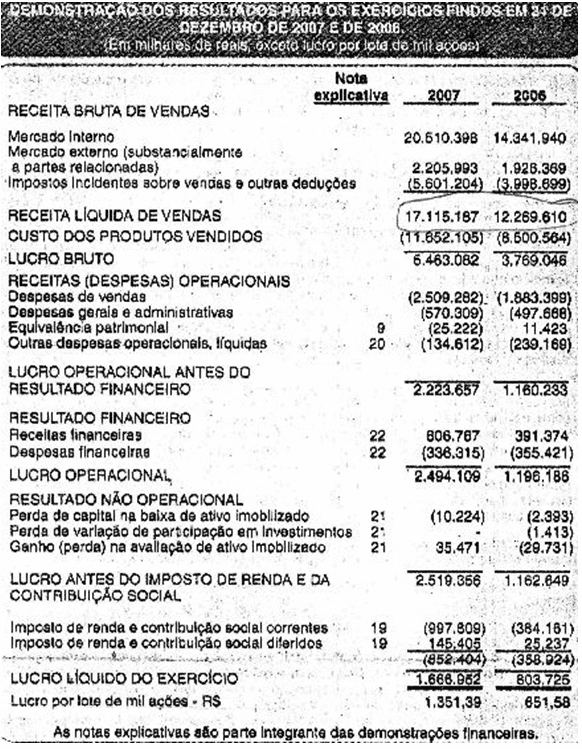
There was a decrease in the costs of products sold which now represents 68.08% of total revenue in 2007 already in 2006 was 69.28%.
Fiat was favored by the decrease in sales, general and administrative expenses that now represent 14.66% and 3.33% on revenue in 2007 against 15.35% and 4.06% in 2006, respectively. The financial result that was positive in 2006 increased for 2007 by 652%.
5.3.3 ASSET PROFITABILITY
The return on assets for every 100.00 invested in 2006 was R$15.17 of net income, as in 2007 it now represents 26.21.
5.3.4 RETURN ON SHAREHOLDERS’ EQUITY
As for the return on equity, it was shown that in 2006 for each R$100.00 of the equity invested, Fiat was able to make R$47.65 of profitability, as in 2007 it represented R$120.57.
5.4 AVERAGE DEADLINES
5.4.1 AVERAGE SALES RECEIPT PERIOD
The company Fiat Automóveis S.A In 2006 its average sales receipt period was 18 days, while in 2007 its receipt term drops to 16 days. Totaling that there was a 2-day fall between 2006 and 2007 in the period of receipt of sales.
5.4.2 AVERAGE PAYMENT TERM FOR PURCHASES
The company Fiat Automóveis S.A, in 2006 the payment period of suppliers was 55 days. Already in 2007, the days remained.
5.4.3 AVERAGE INVENTORY RENEWAL TERM
The average period of renewal of stocks of Fiat Automóveis S.A, in 2006 represented 21 days to produce and stock its product. Already in 2007 increased to 24 days.
5.4.4 OPERATING CYCLE
Fiat in 2006, it takes 39 days to receive its sales and to produce and stock its product.To pay its suppliers takes 55 days, that is, Fiat has a surplus of 16 days in the operation.
Already in 2007 Fiat takes 40 days to receive its sales and to produce and stock its product. To pay its suppliers takes 55 days, that is, Fiat has a surplus of 15 days in the operation.
6. CONCLUSION
Fiat Automóveis S.A, in the year 2006 to 2007 increased its net sales by 39.49%. The company decreased its costs of products sold which now represents 68.08% of total revenue in 2007, as in 2006 it was 69.28%. Fiat was favored by the decrease in sales, general and administrative expenses that represented 14.66% and 3.33% on revenue in 2007 against 25.35% and 4.06% in 2006, respectively. The financial result that was positive in 2006 increased for 2007 by 652%. Operating profit increased 108.51%, thus allowing a record profit of R$1,666,952,000 in 2007 against a profit of R$803,725,000 in 2006, i.e., an exceptional increase of 107.40% in net income.
Fiat maintains as a leader in sales in the light vehicle market with 607,598 units and 25.9% of the market in 2007 performed better than the average economy. The growth of 27.7% of vehicles sold in relation to 2006, was driven by the reduction of interest rate, credit expansion, lengthening of deadlines and “FlexFuel” engine that stimulated the exchange of gasoline vehicles for flexible gasoline or alcohol.
The main success factors continued to be the constant improvement of product quality, service and services of the dealer network, good communication with customers, the launch of Novo Palio and Punto and the faster speed with which the company responded to increased market demand.
The volume of exports increased compared to 2006 by 10.4% (105,912 units in 2007 and 95,912 units in 2006), with an increase of 27.0% in value (US$1,106.8 million in 2007 compared to US$871.5 million in 2006).
In 2007, Fiat Automóveis S.A The increased its investments in fixed assets in the amount of R$443.3 million, of which R$274.4 million in the development of new products. Also in 2007, Fiat made expenses with research and development of new technology and products in the amount of R$ 306.7 million.
In 2007 Fiat increased its number of employees to 15,543, this increase was due to increased production with implementation of the third shift and development of new technologies.
In 2006, Brazil achieved the position of the ninth largest producer of motor vehicles in the world, with two million and 600,000 units produced. The automotive industry is of great importance to Brazil regarding the generation of jobs, exports and development of new technologies.
REFERENCES
ASSAF NETO, Alexandre. Estrutura e análise de balanços: um enfoque econômico-financeiro. 8. ed. São Paulo: Atlas, 2006. 371 p.
ASSOCIAÇÃO NACIONAL DOS FABRICANTES DE VEICULOS AUTOMOTORES. Disponível em: <http://www.anfavea.com.br/anuario.html>. Acessado em 10/02/2009
BELO HORIZONTE. Diário do Comércio. Sexta-Feira, 08 de Fevereiro de 2008. Caderno de economia. p.5
BRASIL. Lei nº 6.404, de 15 de dezembro de 1976. Dispõe sobre as Sociedades por Ações. Diário Oficial [da] República Federativa do Brasil, Brasília, 15 dez. 1976.Disponível em: <www.senado.gov.br>. Acesso em: 19 abril. 2008.
BRASIL. Lei nº 11.638, de 28 de dezembro de 2007. Dispõe sobre as Sociedades por Ações. Diário Oficial [da] República Federativa do Brasil, Brasília, 28 dez. 2007. Disponível em: <www.planalto.gov.br>. Acesso em: 25 abril. 2008
IUDÍCIBUS, Sérgio de. Análise de balanços. 4.ed. São Paulo: Atlas, 1982. 250p.
__________; MARTINS, Eliseu; GELBCKE, Ernesto Rubens. Manual de contabilidade das sociedades por ações: aplicável também às demais sociedades. 6. ed. rev. atual. São Paulo: Atlas, 2003. 569 p.
__________; Analise de balanço: análise da liquidez e do endividamento, análise de giro, rentabilidade e alavancagem financeira. 7. ed. São Paulo: Atlas, 1998. 225 p.
__________; MARION, José Carlos. Introdução à teoria da contabilidade: para o nível de graduação. 3. ed. São Paulo: Atlas, 2002. 288 p.
MATARAZZO, Dante C. Análise financeira de balanços: abordagem básica e gerencial. 6. ed. São Paulo: Atlas, 2003. 459 p.
PADOVEZE, Clóvis Luís. Contabilidade gerencial: um enfoque em sistema de informação contábil. 4. ed. São Paulo: Atlas, 2004. 609 p.
SILVA, José Pereira da. Análise financeira das empresas. 7. ed. São Paulo: Atlas, 2005. 535 p.
VERGARA, Sylvia Constant. Projetos e Relatórios de pesquisa em Administração. 8 ed. São Paulo: Atlas, 2007. 96 p.
VIEIRA, Marcelo Milano Falcão; ZOUAIN, Débora Morais. Pesquisa Qualitativas em Administração 2 ed. São Paulo: FGV, 1995. 32 p.
APPENDIX A – BALANCE SHEET VERTICAL/HORIZONTAL ANALYSIS
APPENDIX B – DEMONSTRATION OF THE RESULT VERTICAL/HORIZONTAL ANALYSIS
Years ended December 31, 2007 and 2006
(In thousands of reais except earnings per shares)
| Statement of Income for the Year | 2006 | AV % | 2007 | AV % | AH % | ||
| NET OPERATING REVENUE | 12.269.610 | 100,00 | 17.115.187 | 100,00 | 39,49 | ||
| Cost of products sold | (8.500.564) | (69,28) | (11.652.105) | (68,08) | 37,07 | ||
| gross profit | 3.769.046 | 30,72 | 5.463.082 | 31,92 | 44,95 | ||
| OPERATING EXPENSES | |||||||
| Sales expenses | (1.883.399) | (15,35) | (2.509.282) | (14,66) | 33,23 | ||
| General and administrative expenses | (497.668) | (4,06) | (570.309) | (3,33) | 14,60 | ||
| Financial expenses | (355.421) | (2,90) | (336.315) | (1,97) | (5,38) | ||
| Financial revenues | 391.374 | 3,19 | 606.767 | 3,55 | 55,04 | ||
| Equity | 11.423 | 0,09 | (25.222) | (0,15) | (320,80) | ||
| Other operating income (expenses), net | (239.169) | (1,95) | (134.612) | (0,79) | (43,72) | ||
| (2.572.860) | (20,97) | (2.968.973) | (17,35) | 15,40 | |||
| Operating Income (Loss) | 1.196.186 | 9,75 | 2.494.109 | 14,57 | 108,51 | ||
| Capital gain on investments | (1.413) | (0,01) | 0 | 0,00 | (100,00) | ||
| Loss of capital in permanent asset snare | (2.393) | (0,02) | (10.224) | (0,06) | 327,25 | ||
| Provision for devaluation of fixed assets | (29.731) | (0,24) | 35.471 | 0,21 | (219,31) | ||
| Profit/Loss before IR/CS | 1.162.649 | 9,48 | 2.519.356 | 14,72 | 116,69 | ||
| IR/CS | (358.924) | (2,93) | (852.404) | (4,98) | 137,49 | ||
| Net Income for the year | 803.725 | 6,55 | 1.666.952 | 9,74 | 107,40 | ||
| Loss per thousand shares – R$ | 651,58 | 1.351,39 | |||||
APPENDIX C – INDICES
| Fiat Automóveis S.A Indices | ||
| Indexes | 2006 | 2007 |
| Capital Structure | ||
| Participation of third-party capital | 214,16 | 360,02 |
| Composition of indebtedness | 67,16 | 69,08 |
| Assets of shareholders’ equity | 93,88 | 126,46 |
| Fixed assets of non-current resources | 55,12 | 59,84 |
| liquidity | ||
| General liquidity | 1,03 | 0,93 |
| Current liquidity | 1,21 | 1,11 |
| Dry liquidity | 1,00 | 0,88 |
| profitability | ||
| Asset turnover | 2,32 | 2,69 |
| Net Margin | 6,55 | 9,74 |
| Asset Profitability | 15,17 | 26,21 |
| Profitability of shareholders’ equity | 47,65 | 120,57 |
| Average Deadlines | ||
| Average time of receipt of sales | 18 days | 16 days |
| Average payment term for purchases | 55 days | 55 days |
| Average inventory renewal time | 21 days | 24 days |
| Operational cycle | 39 days | 40 days |
ANNEX A – BALANCE SHEET
ANNEX B – DEMONSTRATION OF THE RESULT OF THE EXERCISE
[1] Post Graduation in Controllership and Auditing, Graduation in Accounting.
[2] Advisor. Master’s degree in Accounting.
Submitted: September, 2020.
Approved: April, 2021.