ORIGINAL ARTICLE
DIAS, Neylan Leal [1], SILVA, Edcarlos Vasconcelos da [2], PIRES, Marcelo Amanajas [3], CHAVES, Daniel [4], SANADA, Katsumi Letra [5], FECURY, Amanda Alves [6], DIAS, Cláudio Alberto Gellis de Mattos [7], OLIVEIRA, Euzébio de [8], DENDASCK, Carla Viana [9], LEAL, Simone Delphim [10]
DIAS, Neylan Leal. Et al. Prediction of the propagation of SARS-CoV-2 in Amapá State, Amazon Region, Brazil, by mathematical modeling. Revista Científica Multidisciplinar Núcleo do Conhecimento. Year 05, Ed. 05, Vol. 06, pp. 73-95. May 2020. ISSN:2448-0959, Access link in: https://www.nucleodoconhecimento.com.br/health/prediction-of-the-propagation, DOI: 10.32749/nucleodoconhecimento.com.br/health/prediction-of-the-propagation
ABSTRACT
This article presents an analysis of the spread of SARS-CoV-2 in Amapá using three approaches. In the first, the ICL model for the pandemic applied to Brazil was used to implement a comparative linear projection for the Amapá population. The second approach was developed with the short-term solution of the standard SIR model where it was shown that the typical exponential behavior satisfactorily describes the data for the first weeks of the epidemic, but soon after there are early discrepancies due to a sudden slowdown in the temporal evolution number of cases due to isolation measures. This new regime is appropriately described with the third approach which is based on the vSIR model which is a variant of the SIR model. The results presented enable, on the one hand, a better understanding of the scenarios already faced by the population and on the other hand provide short-term projections that will be constantly updated on the link[11].
Keywords: COVID-19, pandemic, mathematical model, vSIR, SARS-CoV-2.
INTRODUCTION
Coronavirus is a family of viruses that cause respiratory infections that, although registered since 1937, only on December 31, 2019, after cases registered in China, the new coronavirus was discovered and identified as the cause of the disease called COVID-19 that is caused by the SARS-CoV-2 coronavirus (MINISTRY OF HEALTH, 2020b).
According to the World Health Organization (WHO), about 80% of cases can be asymptomatic and the remaining 20% often require hospital care and a small portion – approximately 5% – of these go to intensive care units because of severe respiratory deficiency. (WHO, 2020).
This fact is reflected in the condition of community transmission installed nationally in Brazil, where even considering the low testing of the country and the constant review of deaths by COVID-19, the average lethality rate is around 6% and the projection of cases reached the month of May, probably in the six digits, spread mostly in the Southeast region. In this sense, the situation in the North region is of considerable impact; at the end of April, there were approximately 12% of national cases in absolute numbers, which becomes even more dramatic considering the demographic proportionality between the five national macro-regions (BATISTA et al, 2020b).
In mid-May, both incidence and mortality per 100 thousand inhabitants in the North (245.7) were double the rates of the most advanced regions in this same picture, as shown in Table 1 (OMS, 2020a).
Table 1 Summary of cases, deaths, incidence and mortality of covid-19 Brazil and regions.
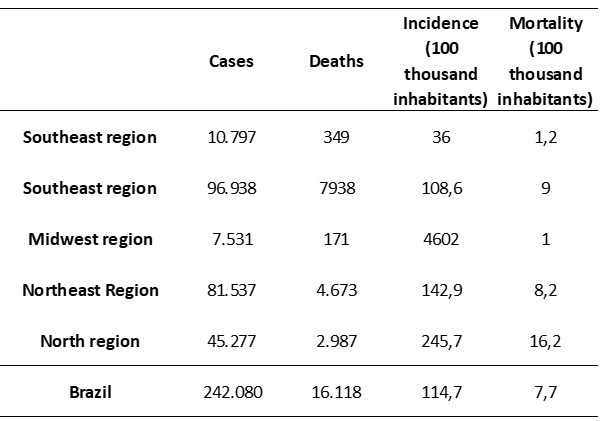
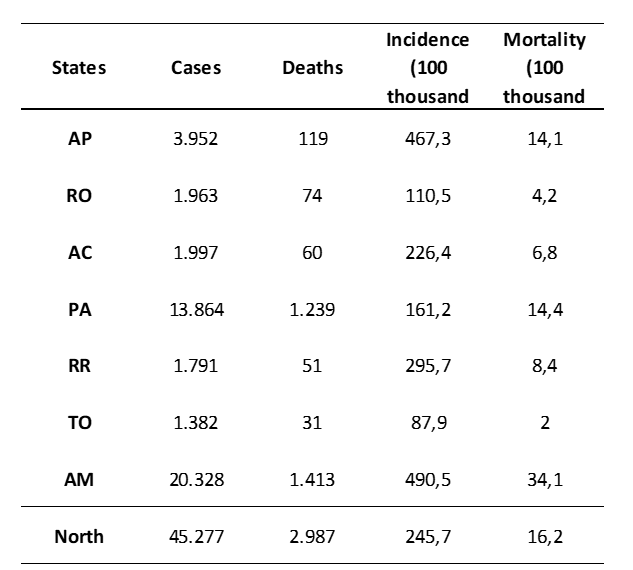
In the case of Amapá, as can be seen in Table 2, in the same period figures presented followed the upward trend, with a similar average to the regional one on mortality (14.1 of the AP x 16.2 in the North), but with alarming numbers in what it concerns the incidence of cases (467.3 of AP x 245.7 in the North). Thus, there is an urgent specific attention to the visible contradiction between the patterns of incidence and mortality in the region in the light of the national reality, since, considering the demographic density of the North region and the number of cases per capita, 5 cities in the North were among the 20 cities with the highest mortality rates at the end of April (BATISTA et al, 2020b).
Table 2 Summary of cases, deaths, incidence and mortality of covid-19 Northern Region and States
Given the configuration of national and regional public health systems, there are several factors that, in turn, are typically linked to developing countries – such as Brazil – such as low number of beds with respirators or intensive care capacity, technological delay influencing quality of testing, absence of personal protective equipment (PPE), deficiencies in the sanitary systems of cities, saturation of the number of people per bedroom in dwellings in regions with extremely high demographic density and the Brazilian inexperience with situations of confinement and / or traffic restriction – make the epidemiological and infectious projections about COVID-19 even more uncertain. Such uncertainties must observe, albeit with due care, macroscopic modeling aiming at the closest possible projection 01 (PIRES, CARVALHO and XAVIER., 2020).
COVID-19 IN AMAPÁ AND THE METROPOLITAN REGION OF THE STATE
It is important to have a picture as accurate as possible, in this sense, observing behavioral patterns of circulation of people, hygiene and care with hospital health can influence the spread of COVID-19 in Amapá, also considering the behavior patterns of the absolute values of notified cases (SVS, 2020).
Tangenced by an unrestrained spread of the new coronavirus in Amapá, let us think of families alienated from the labor force and in social isolation, prevented from carrying out their profession. Under these conditions, the only solution is to wait for the illness to pass, causing other problems such as anxiety, depression, post-traumatic stress, irritability, among other psychological impacts of the quarantine. For their response to the negative impacts, people also suffered from predictive facts such as: fear, sadness, guilt, confusion, for not being able to find a work or hobby solution on their own. Part of these psychological contexts mentioned is perceptible in all classes and social levels of the State of Amapá, starting mainly with health professionals who work and are always at the forefront of care centers that have been inadequate and insufficient for years lived behind of an alarming political system of democratic inequality (BROOKS, 2020).
In the existing cataloging at the different levels of urban and peripheral social groups in the state of Amapá, a city like Macapá and Santana are the two municipalities where the disease is most concentrated. According to the Superintendence of Health Surveillance SVS, this researched statement was based on the period from April 14th to 27th, always showing the concentrating characteristics of COVID-19 in the city center of Macapá, where it all started, this is due to people who traveled abroad state and returned. It is concluded that then the effect of the expansion of contamination is given by imported people that we will call Class A and B (Socioeconomic Classification Criterion). Partly opposed to the confirmations of the under pressure epicenter of COVID-19 in downtown Macapá, Santana is ratifying its concentration statistics in all possible urban and peripheral areas of necessary intercity commuting for family reasons, residential or not (direct contact), even with the containment measures applied by sanitary barriers. This panorama will be presented by the group of people of Class C, D, E, framed in the dependence on the use of public and private transportation (SVS, 2020).
In this idea commented above, we have integrated a framework model for the relations of classes or social groups of isolation, measured by income and well-being among Amapá people (IN LOCO, 2020).
Table 3 Compared relationship of social isolation by socioeconomic group
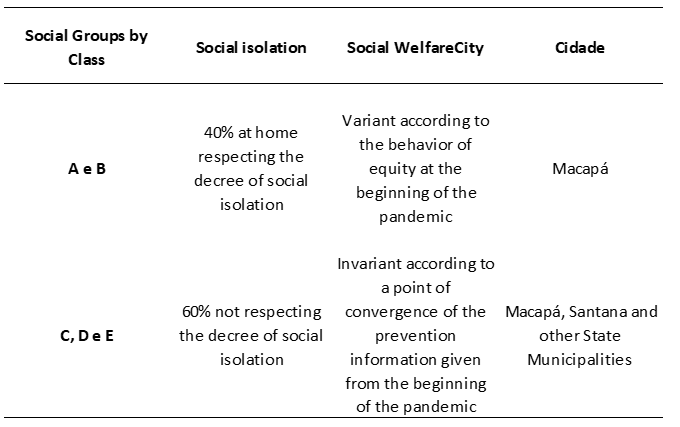
The table scenario is just a small demonstration of the social behavioral reality of the Amapá population, regarding the value of their responsibility to maintain their well-being from the length of a decree established by the state government agencies. Cherished at home by the news serialized by the pandemic, the picture shows 40% of the classes A and B willing to fulfill isolation, part of this fulfillment is due to these people having companies, jobs and fixed salaries of public servants in career. Contrary to the other remaining social classes C, D and E, there is a criterion of the combined wage pattern between contributing parts of the family fixed income (financial dependence), and formal and informal temporary jobs for the expected well-being, regardless of whether or not he is a public career employee. or academic training. This is the reason for the growing breach of social isolation, which reaches 60% with a tendency to grow even more during the current months (IBGE-AMAPÁ, 2020).
Following the validation of the facts in question from each social class intervening for pluralist reasons, figure 1 is outlined general showing the index of irresponsibility of the population regarding social isolation in the State of Amapá Cidade de Macapá Capital and other Municipalities in the period of January 30 to May 14, 2020 with a tendency to vary, split or regress (IN LOCO, 2020).
Figure 1 Index of social isolation for Amapá from January 30 to May 14
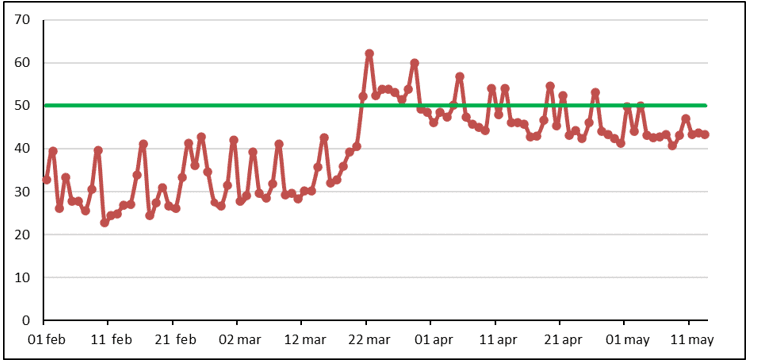
Statistical analyzes of social isolation, are still uncertain variants for what was agreed in practice by the Amapá population, the variation in the period until May 14, 2020 is still expected to vary, considered the fulfillment of staying at home and leaving only if necessary or emergency. Actions of sanitary inspection barriers will be the basis for controlling the intense flow of people around the city. And even if there are enough suspicious symptomatic cases of the virus so informed, the expected uncontrollable result is still being monitored. (SVS, 2020).
AIM
This research aims to analyze the incidence of confirmed cases of COVID-19 in Amapá / AP /Brazil using statistical methods and mathematical models in order to understand the dynamics of contagion of the virus, providing information to promote a more effective combat strategy against the covid-19.
Among other driving specifications, it is intended to verify the forced behavior of social restriction in the public and domestic environment, given as one of the priority care conditions for the proliferation reduction of contagion by Coronavirus.
METHOD
In general, two modeling approaches have been used to gain insights into the epidemic evolution related to Sars-CoV-2. On the one hand, there is an effort to develop sophisticated models that take into account several variables that can describe the epidemic dynamics. Such an approach was used, for example, in Zhang (2020) with a system of 15 differential equations. On the other hand, a mathematical vision has also been adopted focusing on the main epidemic characteristics of the contagious process of success for the epidemic curve of the coronavirus through primary or extended versions of the SIR models (TODA, 2020; KATUL, 2020; ZHONG, 2020).
The SIR epidemiological model proposed by Kermack and McKendrick in 1927 (HETHCOTE, 2000) is one of the classic models used to describe the evolution of the infectious disease contagion process. This model composed of differential equations employs the compartment strategy and divides, in relation to the disease, the population into individuals who can contract, individuals who can transmit and individuals who have recovered and are not subject to new contamination called susceptible (S), infected (I) and recovered (R) respectively.
Mathematically, a SIR model can be represented using the following differential equations:
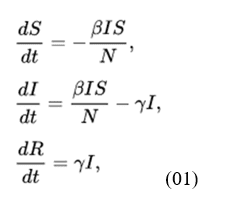
where β is the disease transmission rate, ? is the recovery rate of individuals, both are positive and characteristic parameters of the data under analysis.
In order to optimize and estimate these parameters so that the reported and simulated cases are approximately equal, initial values are used for the three-state variables ? (0), ? (0) and ? (0).
The initial value ? (0) is the population community affected by the outbreak, while ? (0) is the number of confirmed cases that can have any value, but not zero. We can set ? (0) to zero if the spread and simulation start times are the same. The transmission rate reduces monotonically over time (HARKO, 2014).
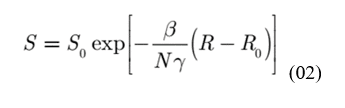
Solving the system (1) we determine the solution function for the susceptible population and we obtain (BATISTA, 2020).
Among the relevant parameters used in epidemiological models such as the SIR is the baseline reproducibility that is provided by R0 (reproduction rate) defined by R0 = β / ϒ. The R0 rate is affected, among several factors, by the number of susceptible people in the population with which the affected patients are in contact and can be described as the average number of people who are infected by a single individual (DELAMATER et al, 2019).
According to Ghani and Fergunson (2020), the R0 value for COVID-19 has varied between 1 and 7 (more precisely 1.1 to 6.95) throughout the development of the epidemic. As indicated by Delamater et al (2019), an R0 <1 shows that the number of infected people decreases with time and the epidemic tends to eradicate, for values of R0> 1 it is assumed that the epidemic must persist in the population for a long term.
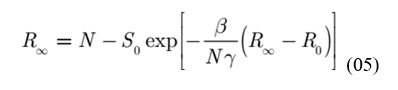
Thus, taking the limit when t tends to infinity, the number of susceptible people obtained is:
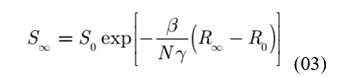
Where is the final amount of recovered. Considering that the final number of infected people is zero, we have:
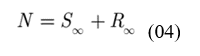
From (03) we get
Assuming that the available data are a time series of the total number of C = R + I cases, the parameters and initial values are defined by minimizing the difference between the current values and the calculated case numbers:
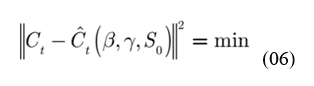
where Ct = (C1, C2, …, Cn) is the number of cases at time t = 1,2, …, n and the vector corresponds to the estimated values at the same time as the reported values. The minimization in question was obtained by the MATLAB fminsearch function according to Batista (2020).
We emphasize that in the aforementioned approach there are three parameters to be estimated, namely {} where N is the effective population size. We denote this variant by the acronym vSIR to differentiate it from the standard SIR model where N is the total size of the population which is a quantity defined a priori. Computationally, the numerical solution of the vSIR system of equations is implemented with the MATLAB software using the explicit fourth-order Runge-Kutta method (BATISTA, 2020).
All analyzes with the mathematical model of this study were carried out with data from confirmed cases of covid-19 for the State of Amapá, made available by the State Health Department of the State and the Ministry of Health of Brazil, both online, in the case of secondary data, for this reason, it was not necessary to register the research in an ethics committee.
RESULTS AND DISCUSSIONS
PROJECT ANALYSIS OF THE COLLEGE LONDON IMPERIAL MODEL
We present in this topic some local projections made with the model of the Imperial College of London (ICL), which sought to guide emergency public policies in the epidemiological and infectious control of COVID-19 for affected countries, obviously all models need to be attentive in an immediate moment to the transoceanic expansion of the pandemic, considering the aggravating factors that occur in each region.
Thus, the ‘ICL Model’ describes the five scenarios as follows:
A) An unmitigated epidemic – a scenario in which no action is taken.
B) Mitigation, including social distance at the population level – we evaluate the maximum reduction in the final scale of the epidemic that can be achieved through a uniform reduction in the rate at which individuals communicate, with the exception of complete suppression.
C) Mitigation, including greater social distance from the elderly – as (B), but with individuals aged 70 or over, reducing their social contact rates by 60%.
D and E) Suppression – we explore different epidemiological triggers (deaths per 100,000 inhabitants) for the implementation of large-scale intensive social detachment (modeled as a 75% reduction in interpersonal contact rates) with the aim of quickly suppressing transmission and minimizing short-term cases and deaths.
For these scenarios, we do not produce final size estimates, but we illustrate their impact on representative configurations. For Tardia, it is considered conducting mass tests, isolating positive cases and monitoring people close to those diagnosed from 1.6 deaths per 100 thousand inhabitants per week. For Precoce, the same measures as before, but adopted from 0.2 deaths per 100 thousand inhabitants per week (GHANI; FERGUSON, 2020).
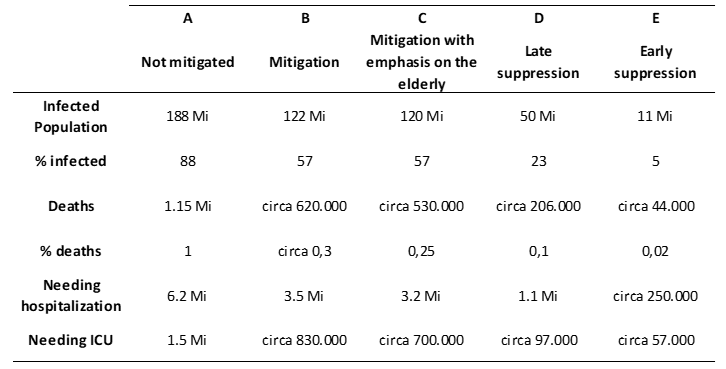
The scenarios exposed by ICL for a population in Brazil of more than 200 million people at the present time, are extrapolated (due to the fundamental premise of minimizing impacts for the population) are as follows: Scenario A – No mitigation measures; Scenario B – With social distance from the entire population. In Scenario A, the Brazilian situation is reckless, and depending on the scenario, with percentages of infected people ranging from 88% and lowering up to 5% of the population, to the number of deaths ranging from 1% to 0.02%. There is also a third scenario – C – that works with social distance and reinforces the distance between the elderly. Finally, scenarios D and E, corresponding to late and early suppression, respectively, are considered, being among the catastrophic scenarios, those of lesser quantitative destruction, as can be seen below.
We constructed, for the sake of appreciation, the following national projection, according to the ICL Model.
Table 4 Projections for Brazil according to the ICL model
At the end of March, the current scenario pointed to an acceleration in the number of detected cases, approximately one week after the tensions around the confinement, as can be seen in the following projection. Data from the Ministry of Health, consolidating the State Health Secretariats, point to 5,812 infected and 202 deaths on the 36th Day after the First Confirmed Case. It took 22 days until the 500th case, and from then on to 1000th it took just 2 days, doubling in three days (2000) and reaching twice the 2000 in 5 days. In the last 15 days of March, therefore, there was a sharp acceleration (PRADO, et al., 2020).
It is already recognized that Brazil has experienced an underreporting scenario since the beginning of the pandemic, with an estimated notification rate in Amapá of around 11.2%, as pointed out in a study in the first half of April (BATISTA et al, 2020b). This factor can be observed due to the problems of planning for the ‘outbreak’ of the crisis – despite the fact that it has been predicted since the last week of January, when proliferation began to overcome the Asian continent – and the low amount of tests, which in turn, they are mostly applied to symptomatic individuals, disregarding the enormous potential of asymptomatic contaminants; that is, that they have already been infected by the virus, but having no symptoms, they feel comfortable for free traffic and enhance transmission. Factors such as tensions since the end of March around a significant part of the population that contests the confinement or minimizing its effects should also be weighed in order to make the elasticity and informal character of free circulation promotions a burden. previous (PRADO et al., 2020).
In the case of Amapá, in March the possible escalation was observed, although maintained in that current progression, for native cases – already in community transmission (AMAPA, 2020a) – due to the setbacks with the authorization for local tests (authorized only in 03/27 – and with the reduction of the progression time since March 26. With respect to the month of March, between March 19 and March 24, we registered 1 case for 5 days, between March 25 to March 26, we passed to the 2nd case; between 3/27 and 3/28, we moved to the 3rd, 3/3, 6 cases, 3/3, 8 cases, and 3/31, 10 cases. In April, the observed rate of cases increased at risk of lack of environmental control (AMAPÁ, 2020a)
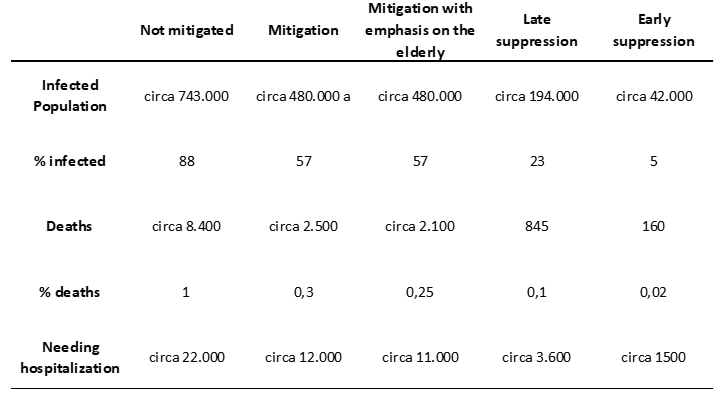
Considering that the latest IBGE projections deal with a population of 845,000 people estimated for Amapá (IBGE, 2020), if the ICL modeling for the state is projected, in a linear way compared to the national scenario – which in itself already represents one more factor for the distortion – we would have the following prediction scenario, severely extrapolated to be accumulated over the entire first epidemiological cycle of propagation of COVID-19 below:
Table 5 Comparative linear projection of the ICL model p. COVID-19 applied to Brazil for Amapá
Due to the Decree of the Government of the State of Amapá (GEA) No. 1414/2020, which promoted a wide reduction of economic, social and cultural activities, and the wide adoption of actions in favor of the deconcentration of people, scenario A is imminently discarded in the extrapolate as long as the insulation is maintained. The fundamental concern becomes, in a cogent way, the maintenance of isolation with measures of intelligent containment of flows to avoid social indiscipline in relation to this, to mitigate as much as possible the patterns of scenario B and C to get closer to the realistic scenario D, of late suppression – which would make, in absolute numbers, the navigable crisis in Amapá, given its demographic density and its population contingent. The reason for optimism is in favor of the quick actions of the metropolitan city halls and mainly of the state government; however, the technical conditions of notification, as well as the quantitative and qualitative of the facilities and beds for hospitalization or intensive treatment, suggest an emergency when a proliferation of cases is eventually confirmed. For this reason, containing community transmission was found to be the best option. The forecasts presented in a projection by a joint team of the Getúlio Vargas Foundation and the Oswaldo Cruz Foundation (FGV / Fiocruz) point convergently towards the positive effects of the combined social and transfer restrictions with regard to the next national wave accumulated over the entire first period. epidemiological cycle of propagation of COVID-19 (ZORZETTO, 2020).
It is important to reiterate the concern with the obvious adaptations of ICL modeling in relation to the socio-cultural and socio-economic characteristics of our country. At the same time, the data from the ICL modeling scenarios are extrapolated numbers and may, in this sense, constitute an exaggeration. In this sense, in a preventive way, verifying the propensity for the next days of multiplication of national cases and the still current implantation of the local testing system and the imminent arrival of rapid testing exams – which are likely to be under-sufficient and will be focused on symptomatic population, which delays the improvement of any projection due to the immediate incubation period to contagion and, therefore, muddies the real perception of the epidemiological picture – it is considered probable that the transition from Scenario D to C is possible. If this transition is confirmed, prospects of securitization of the city through traffic zoning of people and goods will be inevitable (Wuhan model of confinement reinforced by restriction to intrazonal traffic) to reach the desirable 60% -75% restriction, noting that case mapping by region would be positively determinant in helping to contain community transmission more accurately and observe both contaminated and elderly people. The advance and massification of tests, social distance, prioritization of the location of elderly and co-morbid patients, as well as the isolation of those diagnosed, are decisive in this regard (ZORZETTO, 2020).
VSIR MODELING FOR THE ASSESSMENT OF THE CURVE OF ACCUMULATED CASES OF COVID-19 IN AMAPÁ
The time series with confirmed cases of covid-19 for the State of Amapá belongs to the section from March 25 to May 12. In this period, the referred State presented the following evolution of individuals tested positive, mortality and recovered:
Figure 2 Confirmed cases of covid-19 (A). Evolution of mortality (B). Recovered cases (C).
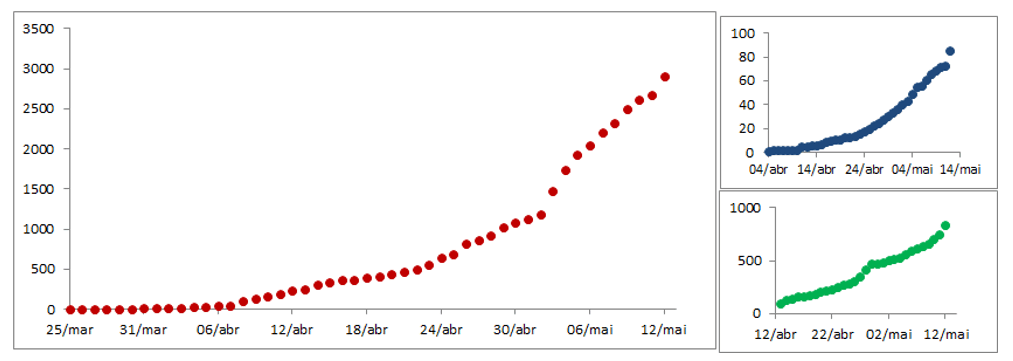
As seen in figure 2, in (A), Amapá took 50 days to leave 1 case for 2910 (03/25 to 05/12). As of the closing date of the study, the state had one of the highest relative rates of cases with around 355.3 per 100,000 inhabitants, drawing attention from the entire country because it is a state with less than 1 million inhabitants.
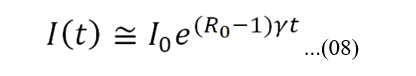
Based on this scenario, at the beginning of the epidemic temporal evolution for Amapá, we can assume S ≅ N. Thus, the equation for dI / dt in the system (1) becomes:
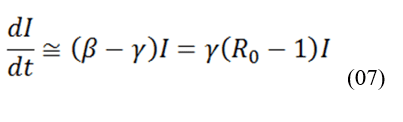
Where R0 = β / ϒ . After a direct integration we obtain:
To obtain a first estimate of R0 we apply a linearization of the above equation. In this way we obtain log (I (t)) = mt + lgo (I0), where we have the slope m = ϒ (R0-1). The fit with the statistical tools of the R programming language provides m = 0.21547 ± 0.01163. Based on the literature (TODA, 2020; LI, 2020; READ, 2020) we assume γ in the range [0.1,0.6]. With this we have a preliminary estimate of R0 between [1,340, 3,271] which is a comparable range with values reported in the summary tables of the review articles on R0 (LIU, 2020; ALIMOHAMADI, 2020).
Regarding the exponential growth phase of covid-19 cases, in Figure 3 there is a satisfactory agreement between the observed data and the theoretical forecast (red curve) until April 14. However, immediately afterwards there is an early discrepancy of the preliminary fit with the data, which raises questions about the reason for such behavior. A possible justification for this change in the trend arises from the perception that the period coincides with the beginning of public policies to avoid contagion. Among them is Decree No. 1497 of April 3, 2020 from the Government of the State of Amapá, which immediately determines social isolation and the suspension of services considered to be physical agglomeration, resulting in new hours of operation and keeping only establishments of extreme necessity open. Thus, it is observed that the isolation measures have an impact on the number of cases, after the delay of sixteen days related to the incubation period.
Figure 3 Initial exponential growth
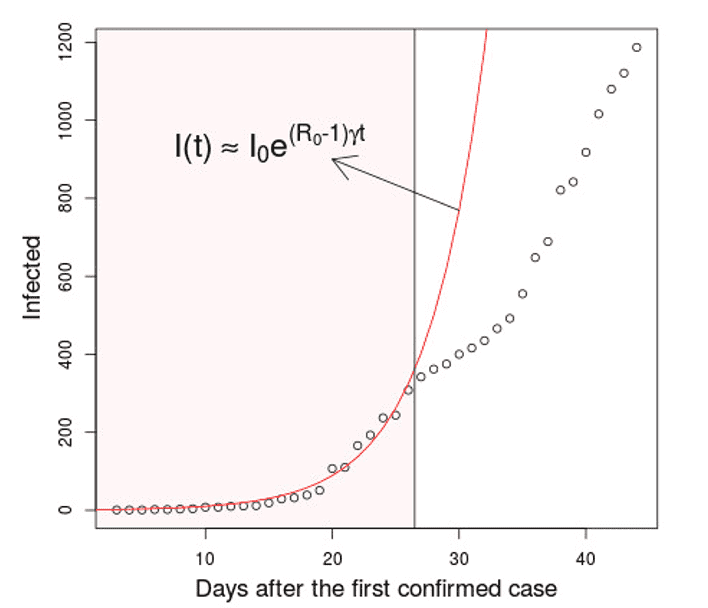
While figure 3 presents a short-term analysis with exponential adjustment (3/25 to 4/14), in later analyzes the confirmed data of the epidemic are compared with the standard SIR mathematical model and the variant employed by Batista (2020) ( which we call vSIR, for brevity).
Figure 4 vSIR simulation and confidence interval
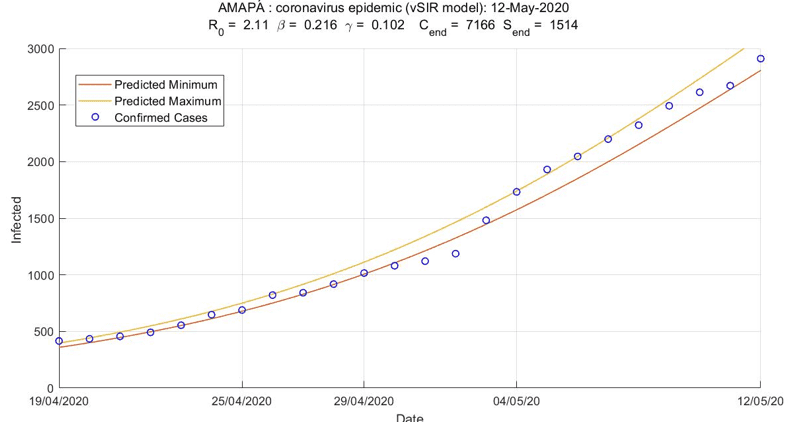
The simulation of the vSIR model from 25.03 until 12.05.2020 shown in Figure 03 shows the confidence interval (CI) that defines the upper and lower limits of the simulated values in order to give a 95% probability of including the real value of predictive cases. There are two outlier points that occur on 01. May.2020 and 02. May.2020, Friday and Saturday respectively. These dates that involve the national holiday of the labor day and whose number of infected people do not live up to expectations raise questions involving the procedural method of collecting information that will be investigated later from an analysis of data in loco. It is also noteworthy that the model was calibrated based on the actual data of infected people since the beginning of the pandemic in the state.
Figure 5 Prediction curve of cases until May 31, 2020
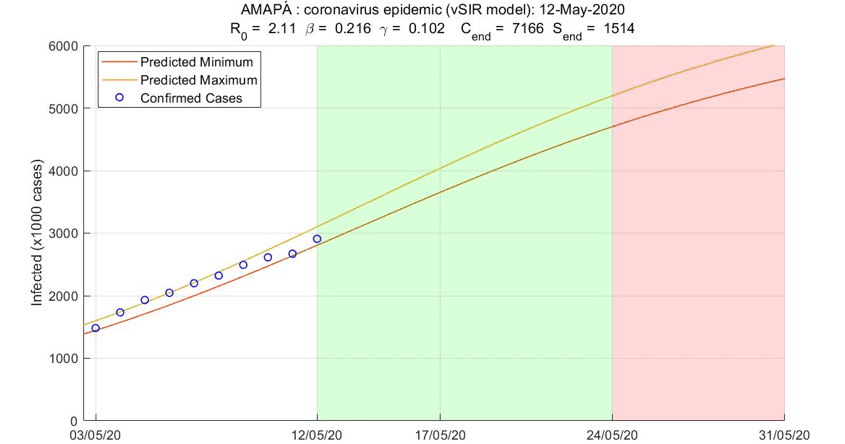
Figure 5 shows the prediction curve for Covid-19 cases in the state until May 31. It appears that, until 17.05 (Sunday), the model estimates that the state will have the number of infected cases close to 4 thousand (3651-4036), in the following week on 24.05 this number will be close to 5,000 cases (4700-5196), and finally until the end of May, on May 31, these values revolve around 5,500 cases (5469-6044). which is almost double what was recorded on 12.05. The green area from 12.05 to 24.05 represents dates when the model is most effective in prediction (close dates), while the red area represents dates when the model can fail in prediction (BATISTA, 2020).
The estimated parameters for the Amapá data, using MATLAB’s fminsearch programming, developed by Batista (2020), were as follows:
Table 6 Estimated parameters in the vSIR model
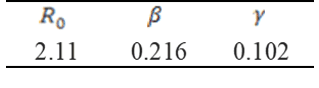
The estimated value of the basic reproduction rate is in accordance with the values reported by the literature specialized in systematic review and metadata as in Liu (2020) and AliMohamadi (2020). The figure in figure 04 also shows a value = 7166, which is a projection for the number of cases for the days following the available data. Despite the name, it does not refer to the expected final number if the available data are still in the initial and intermediate stages of the epidemic evolution, as is the current situation of the data in the AP. As we will see below, the vSIR model provides 5-10 day forecasts in line with observed data.
In table 7, it is possible to observe the predicted values of cases, with a 95% CI. It is worth mentioning that these values are valid if there is no change in public policies, or in the significant individual attitude, towards tougher measures in relation to isolation.
Table 7 Prediction of the number of infected per day.
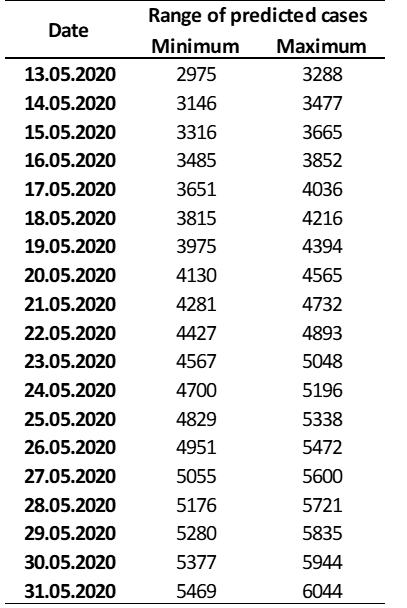
Considering the forecast table of accumulated cases of infected by covid-19 in Amapá, on May 31, 2020, the model predicts that the State may have between 5469 to 6044 accumulated cases. Taking into account the current proportion of lethality calculated for this federative unit, on the 12th (last day of actual data collected), its value was p = 2.95%. Maintaining this level, on May 31st we may have between 161 and 178 deaths due to the disease.
Regarding the basic number of reproduction R0, the vSIR model also generated a time series for daily monitoring of the evolution of The daily monitoring of R0 aims to understand the detailed magnitude of the evolution of the disease, in addition to being an indicator of non-pharmaceutical public policies for mitigating the disease. COVID-19.
Figure 6 Daily evolution of R0.
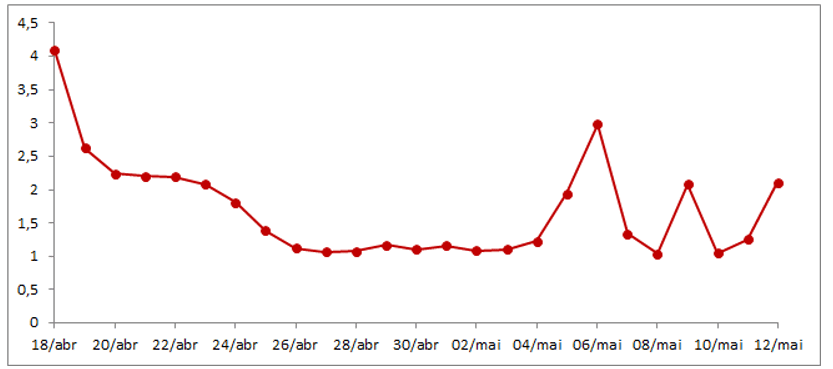
The daily evolution of R0 shows that the lowest values occurred between April 26 (R0 26/04 = 1.12) to May 3 (R0 03/05 = 1.1) this period of low R0 may be indicating that the government decree of April 3 helped to reduce the basic reproduction rate, but not enough to lower its value below 1, which is ideal for controlling the epidemic. As of May 3, R0 rose again, being on the 12/5 at the level of 2.11, this increase may indicate relaxation of the quarantine by the population, whose relationship with R0 is inverse, reducing the quarantine, R0 and vice versa versa, as reported in Dandekar and Barbastathis (2010).
STUDY LIMITATIONS
While in the SIR model there are only two parameters to be estimated (namely the transmission rate β and recovery γ), in the vSIR model we have the possibility to estimate an additional parameter which is the effective size of the population N. With these three parameters {β , γ, N} we can satisfactorily describe the time series for the number of confirmed cases in the state of Amapá.
Our modeling can also be improved in future works considering the following limitations:
- There is a limitation of the linear and general application of the ICL Model, on the one hand, and on the other, possible inaccuracies must be observed due to the interdependence and complexity of the specific conditions of human development in Brazil – already mentioned, such as concentration accentuated demographic in dozens of cities, precarious conditions of basic sanitation in needy communities, dwellings with inhabitants per room above the recommended by the World Health Organization (WHO), historical absence of other experiences of sanitary emergency with measures of this size and standard. In other words, Brazil has a specific proportion and demographic conditions, which makes the general models inaccurate.
- The underreporting of covid-19 cases is a factor that has been reported repeatedly around the world, which in the Brazilian case, due to the reduced number of tests, makes the incidence of this factor to be critical. For example, recently ~ 86% (95% confidence interval: 82-90%) of underreporting was estimated in the early stages of epidemic evolution when travel restrictions were not yet imposed (LI, 2020). For Amapá, there are estimates that project an underreporting rate of ~ 11.2%, according to a technical note published on April 11 (BATISTA et al, 2020b).
- The vSIR model does not take into account the number of asymptomatic cases. For example, in the review article by (BUITRAGO-GARCIA, 2020) an upper limit for the proportion of asymptomatic SARS-CoV-2 infections of ~ 29% (95% confidence interval: 23-37%) was estimated. One strategy to obtain an estimate of the fraction of asymptomatic cases in Amapá is to invest in testing a massive proportion of the population.
CONCLUSIONS
In the first approach, a comparative linear projection of the ICL model was developed for COVID-19 applied to Brazil for Amapá, whose conclusions point to the urgency of measures of social isolation as early as possible, considering the need to avoid massive contagion and accelerated in the locality. We also sought to observe the general conditions of the pandemic context. There is an inaccuracy with regard to the effective speed of transmission and infection, although surrounded by some degree of measurement, months after the beginning of a declared pandemic, it directly implies the observation of the respective local standards.
The second approach was mediated by the short-term solution of the SIR model equations. Such a solution provided the typical exponential growth that was shown to be in agreement with the data observed up to April 14th allowing the obtaining of a preliminary estimate of Ro between [1,340, 3,271]. In the following days there is an abrupt and early discrepancy in the exponential fit due to the isolation measures adopted.
In the third approach, the vSIR model was applied to the actual infected data. It was verified that the basic reproduction rate R0 for Amapá is ~ 2.11, showing that the epidemic in this state is in full expansion, this fact is even worse with the information of social isolation that shows that the State, in the light the first quarantine decree reached 56% of its citizens isolated on April 5, however, that number dropped to 43% on April 12.
In order for there to be a reduction in the level of control of the epidemic (R0 <1), it is necessary that the transmission rate β, which is now at ~ 0.216, undergo a reduction of more than 53% in order to have R0 under control, which it is only possible with rigorous actions to control the dispersion of the population to reduce contacts between individuals, thus slowing down the interaction between susceptible and infectious individuals.
ACKNOWLEDGMENTS
The authors are particularly grateful to Milan Batista of the University of Ljubljana for his helpful contributions in the use of the open source code for Matlab and for the support of the Brazilian development agencies (CAPES and CNPQ) in the development of this work, through the granting of a PhD scholarship. and support for research.
REFERENCES
ALIMOHAMADI, Yousef; TAGHDIR, Maryam; SEPANDI, Mojtaba. The estimate of the basic reproduction number for novel coronavirus disease (covid-19): A systematic review and meta-analysis. Journal of Preventive Medicine and Public Health, 2020. Disponível em: <https://www.jpmph.org/upload/pdf/jpmph-20-076.pdf> Acesso em: 01/05/2020
AMAPÁ. Painel Coronavírus. [internet].2020a. Disponível em: <http://painel.corona.ap.gov.br/ > Acesso em: 10/05/2020
AMAPÁ. Superintendência de Vigilância em Saúde – SVC. 2020b. Disponível em: <https://svs.portal.ap.gov.br/coronavirus> Acesso em: 14/04/2020.
BATISTA, Milan. fitVirusCOVID19. MATLAB Central File Exchange. [Internet]. 2020. Disponível em: <https://www.mathworks.com/matlabcentral/fileexchange /74658-fitviruscovid19> Acesso em 15/05/2020.
BROOKS, Samantha K.; WEBSTER, Rebecca K.; SMITH, Louise E.; WOODLAND, Lisa.; WESSELY, Simon; GREENBERG, Neil. RUBIN, Gideon James. The psychological impact of quarantine and how to reduce it: rapid review of the evidence. The Lancet. London, Uk, v. 395, p.912-920, mar. 2020. DOI:https://doi.org/10.1016/S0140-6736(20)30460-8
BUITRAGO-GARCIA, Diana C.; EGLI-GANY, Dianne; COUNOTTE , Michel J.; HOSSMANN, Stefanie; IMERI, Hira; SALANTI, Georgia. LOW, Nicola. The role of asymptomatic SARS-CoV-2 infections: rapid living systematic review and meta-analysis. medRxiv, 2020. Disponível em: <https://www.medrxiv.org/content/10.1101/2020.04.25.20079103v1> Acesso em: 10/05/2020
DANDEKAR, R.; BARBASTATHIS, G. Neural Network aided quarantine control model estimation of COVID spread in Wuhan, China. 2020. Disponível em: <https://arxiv.org/abs/2003.09403> Acesso em: 10/05/2020.
DELAMATER, Paul L.; STREET, Erica J.; LESLIE, Timothy F., YANG, Y. Tony; JACOBSEN, Kathryn H. Complexity of the Basic Reproduction Number (R0). Emerg Infect Dis 2019;25:1-4 PMC6302597
FERGUSON, Neil M.; GHANI, Azra C.; WALKER, Patrick G. T.; WHITTAKER, Charles; WATSON, Oliver; BAGUELIN, Marc; AINSLIE, Kylie E. C. et al.. The Global Impact of COVID-19 and Strategies for Mitigation and Suppression. 26 mar 2020. Imperial College London COVID-19 Response Team. Disponível em: <https://www.imperial.ac.uk/media/imperial-college/medicine/mrc-gida/2020-03-26-COVID19-Report-12.pdf> Acesso em: 14/05/2020.
HARKO, Tiberiu; LOBO, Francisco S. N.; MAK, M. K. Exact analytical solutions of the Susceptible-Infected-Recovered (SIR) epidemic model and of the SIR model with equal death and birth rates. Applied Mathematics and Computation. 236: 184194, 2014. Disponível em: <https://arxiv.org/abs/1403.2160> Acesso em: 10/05/2020
HETHCOTE, Herbert W. The mathematics of infectious diseases. SIAM Review, v. 42, n. 4, p. 599-653, 2000. Disponível em: <https://epubs.siam.org/doi/abs/10.1137/s0036144500371907> Acesso em: 10/05/2020
IBGE. Cidades e Estados: Amapá. 2020. [internet]. Disponível em: <https://www.ibge.gov.br/cidades-e-estados/ap.html> Acesso em: 20.04.20
IN LOCO. Mapa de Dados. 2020. [internet]. Disponível <https://mapabrasileirodacovid.inloco.com.br> Acesso em 03/05/2020.
MRAD, Assaad; BONETTI, Sara; MANOLI, Gabriele; PAROLARI, Anthony J. Global convergence of COVID-19 basic reproduction number and estimation from early-time SIR dynamics. MedRxiv. 2020. Disponível em: <https://www.medrxiv.org/content/10.1101/2020.04.10.20060954v2> Acesso em: 01/05/2020
LI, Ruiyun; PEI, Sen; CHEN, Bin; YIMENG, Canção; ZHANG, Tao; YANG, Wan; SHAMAN, Jeffrey. Substantial undocumented infection facilitates the rapid dissemination of novel coronavirus (SARS-CoV-2). Science, v. 368, n. 6490, p. 489-493, 2020. Disponível em: <https://science.sciencemag.org/content/368/6490/489> Acesso em: 10/05/2020
LIU, Ying; GAYLE, ALBERT A.; WILDER-SMITH, Annelies; ROCKLÖV Joacim. The reproductive number of COVID-19 is higher compared to SARS coronavirus. Journal of travel medicine, 2020. Disponível em: <https://academic.oup.com/jtm/article/27/2/taaa021/5735319> Acesso em: 10/05/2020
MINISTÉRIO DA SAÚDE. Sobre a Doença Covid-19. Brasília. 2020. [internet]. Disponível em <https://coronavirus.saude.gov.br/sobre-a-doenca> Acesso em: 14/05/2020
MINISTÉRIO DA SAÚDE. Síntese de casos, óbitos, incidência e mortalidade. Brasília. 2020a. [internet]. Disponível em: <https://covid.saude.gov.br/> Acesso em 15/05/2020.
ORGANIZAÇÃO MUNDIAL DA SAÚDE. Coronavirus disease 2019 (COVID-19) Situation Report – 46. Disponível em <https://www.who.int/docs/default-source/coronaviruse/situation-reports/20200306-sitrep-46-covid-19.pdf?sfvrsn=96b04adf_4#:~:text=For%20COVID%2D19%2C,infections%2C%20requiring%20ventilation.> Acesso em 16/05/2020
PIRES, L.N.; CARVALHO, L.; XAVIER, L.L. COVID-19 e Desigualdade no Brasil. Centro Brasileiro de Estudos da Saúde. Disponível em < http://cebes.org.br/2020/04/covid-19-e-desigualdade-no-brasil/>. Acesso em 16/05/2020.
PRADO, Marcelo; BASTOS, Leonardo; BATISTA, Amanda; ANTUNES, Bianca; BAIÃO, Fernanda, MAÇAIRA, Paula; HAMACHER, Silvio; BOZZA, Fernando. Nota Técnica 7 NOIS/Puc-Rio: Análise de subnotificação do número de casos confirmados da COVID-19 no Brasil. <http://www.supersuporte.com/myRpubs/NT7_Subnotificacao_notaDia11-abr-2020.pdf>, Acessado em: 14.05.2020.
PRADO, Marcelo; BASTOS, Leonardo; BATISTA, Amanda; ANTUNES, Bianca; BAIÃO, Fernanda, MAÇAIRA, Paula; HAMACHER, Silvio; BOZZA, Fernando. Nota Técnica 7 NOIS/Puc-Rio: Evolução da epidemia de COVID-19 no Brasil até 04 de maio de 2020. <https://drive.google.com/file/d/17a9F6WEmCoihJmXF3KMHEI1jWo51xarz/view>, Acesso em: 14/05/2020
READ, Jonathan M.; BRIDGEN, Jessica R. E.; CUMMINGS, Derek A. T. HO, Antonia; JEWELL, Chris P. Novel coronavirus 2019-nCoV: early estimation of epidemiological parameters and epidemic predictions. MedRxiv, 2020. Disponível em: <https://www.medrxiv.org/CONTENT/10.1101/2020.01.23.20018549V2> Acesso em 10/05/2020
TODA, Alexis Akira. Susceptible-infected-recovered (sir) dynamics of covid-19 and economic impact. ArXiv:2003.11221, 2020. Disponível em: <https://arxiv.org/abs/2003.11221> Acesso em: 09/05/2020
ZHANG, Yuan; YOU, Chong; CAI, Zhenghao; SUN, Jiarui; HU, Wenjie; ZHOU, Xiao-Hua. Prediction of the COVID-19 outbreak based on a realistic stochastic model. medRxiv, 2020. Disponível em: <https://www.medrxiv.org/content/10.1101/2020.03.10.20033803v1> Acesso em: 09/05/2020
ZHONG, Linhao; MU, Lin;LI, Jing; WANG, Jiaying; YIN, ZHE; LIU, Darong. Early prediction of the 2019 novel coronavirus outbreak in the mainland china based on simple mathematical model. Ieee Access, v. 8, p. 51761-51769, 2020. Disponível em: <https://ieeexplore.ieee.org/document/9028194> Acesso em: 09/05/2020
ZORZETTO, R. A segunda onda do coronavírus. PESQUISA FAPESP, 2020. Disponível em <https://revistapesquisa.fapesp.br/2020/03/30/a-segunda-onda-do- coronavirus/> Acesso em: 09/05/2020
11. http://www2.unifap.br/matematicaplicada/pagina-exemplo/
[1] Mathematician, PhD student in Mechanical Engineering – FEB / UNESP-SP. Professor and researcher at the Mathematics Course at the Federal University of Amapá (UNIFAP).
[2] Mathematician, PhD student in Public Health – FIOCRUZ / RJ. Professor of the Mathematics Course at the Federal University of Amapá (UNIFAP).
[3] Physicist, Master in Physics (UFF), PhD student at the Brazilian Center for Physical Research (CBPF).
[4] Historian, Doctor in Comparative History, Professor and researcher of the History Course, of the Graduate Programs in Regional Development and in Intellectual Property and Technology Transfer for Innovation, Federal University of Amapá (UNIFAP).
[5] Degree in Letters, Master of Science in Education (UNIFAL) Lecturer at the Federal Institute of Amapá (IFAP).
[6] Biomedical, PhD in Tropical Diseases, Professor and researcher of the Medical Course at the Federal University of Amapá (UNIFAP).
[7] Biologist, PhD in Theory and Research of Behavior, Professor and researcher at Chemistry Collegiate, Macapá Campus, Federal Institute of Amapá (IFAP).
[8] Biologist, PhD in Topical Diseases, Professor and researcher of the Physical Education Course at the Federal University of Pará (UFPA).
[9] Theologian, PhD in Psychoanalysis, researcher at the Research and Studies Center Advanced – CEPA.
[10] Mathematician, PhD in Computational Modeling, Professor and researcher of the Mathematics Course at the Federal University of Amapá (UNIFAP).
Submitted: May, 2020.
Approved: May, 2020.