ORIGINAL ARTICLE
GARCIA, Amanda Carvalho [1]
GARCIA, Amanda Carvalho. Identification of microRNAs in the intergenic regions of braf genes. Revista Científica Multidisciplinar Núcleo do Conhecimento. Year 11, Ed. 09, Vol. 01, pp. 204-226. September 2026. ISSN: 2448-0959. Available at: https://www.nucleodoconhecimento.com.br/health/identification-of-micrornas, DOI: https://doi.org/10.5281/zenodo.23092126
ABSTRACT
In Papillary Thyroid Carcinoma (PTC), the BRAFV600E mutation represents 90% of cases, considered a point mutation due to the transversion of thymine (T1799A) of the BRAF gene by replacing valine with glutamate (V600E), in the serine/threonine kinase chain. It activates the recruitment of RAF proteins (BRAF in thyroid follicular cells) to the plasma membrane, activating ERK kinase (MEK), which phosphorylates and activates the extracellular signal-regulated kinase (ERK). In the nucleus, ERK regulates transcription genes involved in cell differentiation, proliferation, and survival. In the human genome, the evidence of microRNAs in regions favorable to carcinogenesis is 50%. MicroRNAs (small non-coding RNAs) act in post-transcriptional regulation, causing inhibition of translation or degradation of mRNAs, whose altered expression is evidenced in papillary thyroid carcinoma (for example, miR-146, miR-222, and miR-221). We identified 9 families of small RNAs in the intronic regions of the BRAF gene: BRAF-207, BRAF-208, BRAF-209, BRAF-211, BRAF-212, BRAF-214, BRAF-216, BRAF-217, and BRAF-218. Among the non-protein-coding BRAF gene intronic transcripts, we determined putative targets for microRNA signatures mir-1255, mir-562, mir-544, and mir-574. An mRNA target of mir-562 is the EIF1AX gene, recently described as a new gene related to thyroid cancer. The results provide a better understanding of the participation of this type of RNA in post-transcriptional regulation in thyroid cancer, representing an accessible and differentiated molecular methodological development, thus contributing to therapeutic decisions in cases of indeterminate thyroid nodules.
Keywords: Non-coding RNA (ncRNA), BRAF, microRNA, Intronic region, Thyroid.
1. INTRODUCTION
Thyroid cancer is the fifth most common cancer in women in the US [1]. Its incidence continues to increase worldwide, even though mortality has changed minimally over the last five decades [2]. The incidence has indicated a dramatic increase; findings suggest that changing patterns of treatment of thyroid nodules may have led to a decrease in the diagnosis of small indolent tumors, but not more advanced tumors [3,4,5,6], mainly small papillary carcinomas [7], with the highest increase found in South Korea [4]. Most thyroid cancers have mutations along the Mitogen-Activated Protein Kinase (MAPK) cell signaling pathway. This pathway transmits growth signals from the plasma membrane to the nucleus, playing a central role in regulating cell proliferation. Somatic mutation of the BRAF 1799 A gene, resulting from mutant kinase-BRAF V600E, is unique to Papillary Thyroid Carcinoma (PTC) cancer and in PTC-derived anaplastic cancer. The BRAF V600E mutation has an 80% prevalence of genetic alterations in cases of papillary thyroid carcinoma [8]. Another frequent mutation is that of the RAS oncogene family, mainly in the follicular type and in the follicular variant PTC. Furthermore, chromosomal translocations are seen in Thyroid Cancer (TC), and thus these genomic rearrangements lead to the expression of new oncogenic fusions, initiating events in various TCs [2,5,6]. RET and TRK somatic rearrangements are found almost exclusively in PTC and can be found in early stages [5].
In the human genome, evidence of microRNAs in regions conducive to carcinogenesis presents an incidence of 50% [9]. Scientific and technological advances led to the discovery of the functions of those considered to be the main RNAs: messenger RNA (mRNA), a molecule that transfers information during protein synthesis; ribosomal RNA (rRNA), a component of the structure of protein synthesis; and transfer RNA (tRNA), capable of transporting amino acids and interacting with proteins [10]. Several structural and functional studies of RNA have been carried out and have enabled the description of new classes of RNA, with varied functions across the Archaea, Bacteria, and Eukarya domains [11].
RNAs are transcribed from a DNA template and can be classified according to their function. In addition to this main group, there is a second group composed of a wide variety of RNAs with special functions that do not contain information for protein synthesis: riboswitches, RNAi, snoRNA, miRNA/sRNA, among others [12]. Riboswitches are RNAs that undergo a change in structure in response to the binding of regulatory molecules and act in cis to control the expression of a wide range of bacterial genes [13,14]. RNAi, or interfering RNAs, participate in a natural mechanism of post-transcriptional regulation of gene expression that can silence individual genes creating a knockout phenotype [14]. The snoRNAs are unique to eukaryotes and chemically modify other ncRNAs such as rRNA and tRNA. MiRNAs, which are equivalent to prokaryotic sRNAs, are involved in several post-transcriptional regulatory processes [15,16].
The nomenclature of non-coding RNAs is quite diverse and has varied over time and according to the advancement of knowledge about these molecules [17]. In eukaryotes, non-coding RNAs with a regulatory function are made up of small single-stranded RNA molecules that act in the post-transcriptional regulation of gene expression, regulate important signaling pathways, and control several pathophysiological processes [18,19].
The main function of microRNAs is in the imperfect pairing with target mRNAs, being able to regulate multiple targets and generating the so-called regulatory network. Studies have shown that many genes involved in the endocrine system are microRNA targets, and changes in microRNA expression levels have been coadjutants in tumor processes [22,23]. The recognition of the mechanisms regulated by these small RNAs could help in clinical diagnosis [20,21].
MicroRNA expression is altered in some tumors, and tumor-specific inactivating mutations have been identified in some microRNAs, which may act as tumor suppressor genes [20,21]. Calin et al. [24] found frequent deletions and downregulation of miR-15 and miR-16 in the 13q14 region in cases of chronic lymphocytic leukemia, which inhibited the expression of an oncogene soon identified as anti-apoptotic BCL-2. In lung cancer, considered one of the most aggressive, it was analyzed that the decrease in let-7 miRNA modulates the action of RAS and MYC oncogenes [20].
Oncogenic action occurs with increased expression in tumors that negatively modulate tumor suppressor genes, as is the case of miR-221 in glioblastoma, miR-372 and miR-373 in testicular cell neoplasia, and miR-221, miR-222, and miR-146 in thyroid tumors [9]. Regarding the suppressor effect, a certain regulatory mechanism that includes miRNA can lead to downregulation of tumor suppressor genes and/or upregulation of oncogenes [5]. MicroRNAs can act in post-transcriptional regulation in the 3’UTR region of gene expression, influencing the translation of target mRNAs, which can lead to inhibition of translation or degradation of mRNAs, bringing new knowledge in thyroid tumorigenesis [2].
We further analyzed the predicted ncRNAs in BRAF-207, BRAF-208, BRAF-209, BRAF-210, BRAF-211, BRAF-212, BRAF-214, BRAF-216, BRAF-217, and BRAF-218 using Infernal bioinformatics tools [45,46]. Furthermore, these analyses constitute the first documented evidence of the presence of sRNAs in the intronic regions of the BRAF gene.
2. MATERIALS AND METHODS
2.1 DATA SET
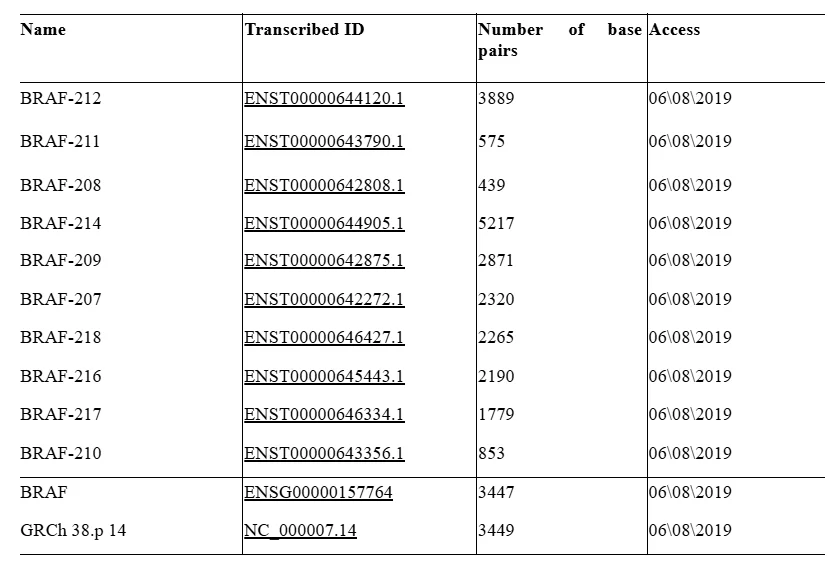
The Infernal-1.1.2 tool was used [45,46], and the following command line was applied: cmscan –o sequencegene.out –tblout sequencegene.tbl –T 24 –notrunc Rfam.cm sequencegene to predict non-coding RNAs (ncRNAs) in transcripts that do not encode proteins (Table 1) [44].
The prediction results demonstrated the presence of ncRNAs in the BRAF-207, BRAF-208, BRAF-209, BRAF-210, BRAF-211, BRAF-212, BRAF-214, BRAF-216, BRAF-217, and BRAF-218 transcripts. These transcripts were considered intronic sequences that do not encode proteins. However, using the Infernal-1.1.2 tool, the ncRNA nomenclature was identified, as well as transcripts for which no ncRNA prediction was obtained.
Table 1. BRAF gene transcripts
2.2 PREDICTION OF NCRNAS IN SILICO
Infernal is a computational tool that uses covariance models to generate probabilistic profiles of RNA sequences and secondary structures from RNA families [45,46]. The covariance model is a special case of a probabilistic model that evaluates the combination of the consensus sequence and the consensus secondary structure of a given RNA. Therefore, in many cases, it can identify homologous RNAs that have conserved secondary structures but low conservation at the primary sequence level [46]. Infernal 1.1.1 consists of five programs: cmbuild, cmcalibrate, cmsearch, cmscan, and cmalign.
2.3 ANNOTATION OF MICRORNA SEQUENCES
For the annotation of microRNA sequences, the online Rfam database versions 12.0 and 12.1 were used [27]. This database contains a collection of ncRNA families represented by manually curated alignment sequences, consensus secondary structures, and annotations obtained from taxonomic and ontology sources [27]. The database is a broad and diverse source of ncRNAs and includes 2,474 ncRNA families, providing information on diverse types of ncRNAs across the three domains of life and viruses. Infernal 1.1.1 was used to perform multiple sequence alignments based on covariance models [45,46]. In addition to ncRNA annotation, Rfam 12.1 classifies ncRNAs and provides bibliographic references for each family, as well as links to the PDB (Protein Data Bank), miRBase, ENA, and Gene Ontology (GO).
2.4 TARGET PREDICTION
The miRBase tool provides interfaces for microRNA sequences and covers data related to gene annotation, predicted targets, nomenclature, and the publication of new microRNA sequences [47]. The latest version of miRBase contains 24,521 microRNA loci across 206 species, with the capacity to produce 30,424 mature microRNAs [48]. The database is updated in response to the discovery and development of microRNA sequencing methods, while maintaining standardized mapping criteria [48].
2.5 STATISTICAL ANALYSIS
For the descriptive analysis of the variables studied, the means, standard deviations, minimum and maximum values, box plots, and proportions were calculated to provide an overview of the data [49,50,51,52]. The box plot was used to assess the homogeneity of variance among variables, and to verify independence between groups of nominal variables, the G-test/Chi-square test [53] was used. In addition, to find out if there were differences between the means of numerical variables, Student’s t-test and Cramér’s V test were used to verify the strength of association of qualitative variables. R software version 3.5.2 [54] and Microsoft Excel were used for statistical analyses. Where necessary, a 95% confidence level was used.
For data analysis of the functional characterization of microRNAs in the BRAF gene transcripts, the data were described by statistical procedures that make it possible to summarize, organize, explain, and interpret numerical information.
The information obtained was entered into spreadsheets in the Microsoft Excel® 2019 program; then the data were generated, applying descriptive statistical analysis techniques, obtaining the definitive results in absolute and relative frequencies (%), demonstrated in means, standard deviations, minimum values, quartiles, and maximum values. After descriptive analysis, RStudio software version 4.2.0 was used for fitting the models. The data were submitted to Analysis Of Variance (ANOVA) and, subsequently, the presupposition of normality of the residues was verified by the Shapiro-Wilk normality test. This assumption was violated [55]. The ANOVA test is used to test the equality of three or more population means, based on the analysis of sample variances [52,56].
The hypothesis tested in ANOVA is that the population means of the treatments do not differ from each other, with a given significance level of 5%, which can be represented as follows: H0: µ1 = µ2 = µ3 = … = µa, where a represents the total number of treatments in the trial and µi represents the population mean of the i-th treatment, i = 1, …, a.
Therefore, as the assumption of normality of the residues was violated, we then applied the Kruskal–Wallis test, which is the alternative non-parametric method to one-way ANOVA [52,57], used in cases where the assumptions required by ANOVA are not satisfied. The non-parametric test is a method that compares two or more independent samples of equal or different sizes. After applying non-parametric tests, the Nemenyi multiple comparison test was applied to verify which of the factors differ from each other [58].
3. RESULTS
3.1 PREDICTION OF NEW NCRNAS IN THE INTRONIC REGIONS OF THE BRAF GENE
The computational tool Infernal 1.1.2 was employed in this study. The detection of covariance models and sequence analyses used as input the RNA family database (Rfam; available at http://rfam.xfam.org/; accessed August 22, 2022), the predicted RNA families within the intronic regions of the BRAF gene, and the BRAF sequence based on the GRCh38.p14 reference genome, as described in Supplementary Material S1.
The complete list of BRAF gene intronic sequences analyzed is as follows: BRAF-207, BRAF-208, BRAF-209, BRAF-210, BRAF-211, BRAF-212, BRAF-214, BRAF-216, BRAF-217, and BRAF-218. The results are presented in Table 1.
Using this approach, no ncRNA was detected in BRAF-218, which may be associated with the high number of scaffolds and contigs identified in the incomplete sequence assembly. The transcripts with the highest number of common ncRNAs were BRAF-214 and BRAF-216, as shown in Table 2.
Table 2. ncRNAs predicted in the intronic sequences of the BRAF gene. The computational tool Infernal (version 1.1.2) was used
| Intronic sequences | ncRNAs |
| BRAF | CRISPR-DR45, CRISPR-DR62, Metazoa_SPR, mir-1255, mir-544, mir-574, mir-
562, mir-6, Plant_SPR, plasmodium_snoR14, plasmodium_snoR21, snopsi28S- 3316, snoR07, snoR13 and U6. |
| BRAF-207 | CRISPR-DR45, CRISPR-DR62, Metazoa_SPR, mir-1255, mir-544, mir-562, mir-
574, mir-6, Plant_SPR,, snoR07, snoR13 and U6. |
| BRAF-208 | CRISPR-DR45, CRISPR-DR62, Metazoa_SPR, mir-1255, mir-544, mir-562, mir-
574, mir-6, Plant_SPR,, snoR07, snoR13 and U6. |
| BRAF-209 | Metazoa_SPR, mir-544, mir-562, mir-574, Plant_SPR, snoR07, snoR13 and snopsi28S-3316. |
| BRAF-210 | Metazoa_SPR. |
| BRAF-211 | CRISPR-DR45, CRISPR-DR62, Metazoa_SPR, mir-1255, mir-544, mir-562, mir-
574, mir-6, Plant_SPR, snoR07, snoR13 and U6. |
| BRAF-212 | Metazoa_SPR, mir-562, mir-544, mir-574, Plant_SPR, snoR07, snoR13 and
snopsi28S-3316. |
| BRAF-214 | CRISPR-DR45, CRISPR-DR62, Metazoa_SPR, mir-1255, mir-544, mir-562, mir-
574, mir-6, Plant_SPR, plasmodium_snoR14, plasmodium_snoR21, snopsi28S- 3316, snoR07, snoR13 and U6. |
| BRAF-216 | CRISPR-DR45, CRISPR-DR62, Metazoa_SPR, mir-1255, mir-544, mir-574, mir-6,
Plant_SPR, plasmodium_snoR14, plasmodium_snoR21, snopsi28S-3316, snoR07, snoR13 and U6. |
| BRAF-217 | Metazoa_SPR. |
| BRAF-218 | Absence |
| GRCh38.p14 | CRISPR-DR45, CRISPR-DR62, Metazoa_SPR, mir-1255, mir-544, mir-574, mir-6,
Plant_SPR, plasmodium_snoR14, plasmodium_snoR21, snopsi28S-3316, snoR07, snoR13 and U6. |
Source: Author’s own elaboration (2026).
Note: Intronic sequences of the BRAF gene = 10; BRAF = gene BRAF; GRCh38.p14 = Homo sapiens chromosome 7, GRCh38.p14 Primary Assembly; ncRNAs = non-coding RNAs.
All ncRNAs predicted by the Infernal 1.1.2 tool within the BRAF gene intronic sequences and the GRCh38.p14 reference genome are shown in Supplementary Material S1. As shown in Table 3, the number of predicted ncRNAs varied according to the sequence, except for the intronic sequences BRAF-207, BRAF-208, BRAF-214, and BRAF-216, which showed the same number of predicted ncRNAs, resulting in lower variability, with standard deviations of 11.36 and 10.76, respectively. The BRAF-217 intronic sequence showed the lowest variability, as it presented the smallest standard deviation (5.89) and equal mean and median values.
Table 3. Descriptive analysis of BRAF intronic sequences, BRAF gene and GRCh38.p14
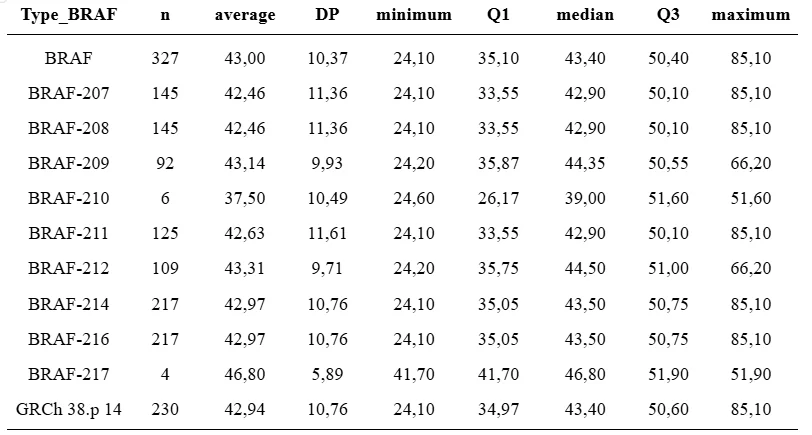
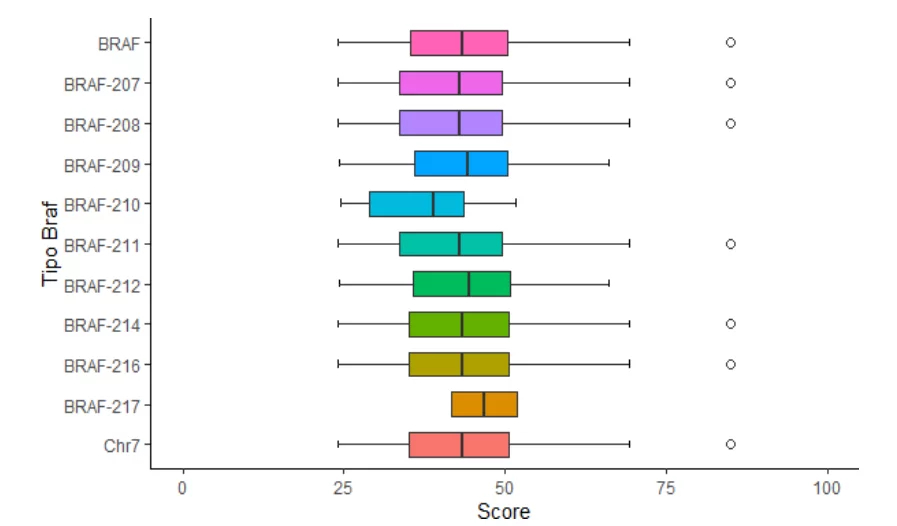
In Graph 1, the boxplot analysis of the BRAF intronic sequences showed that the only predicted ncRNA was identified in the BRAF-207 sequence, corresponding to Metazoa_SRP (ncRNA signal recognition particle RNA). This finding is reflected in the quartile distribution of the BRAF-217 sequence, which was considered the most condensed dataset. On the other hand, the BRAF-210 sequence presented a significant difference compared with the others, with a wider interquartile range between the third and first quartiles. This distribution was not influenced by outliers and showed positive asymmetry. The datasets of BRAF-207 and BRAF-208 were symmetrical, although outliers were observed in the boxplot.
Graph 1. Density of braf intronic sequences, braf gene and grch 38.p 14
The one-way analysis of variance (One-Way ANOVA) test was applied, and the data were statistically analyzed using RStudio software version 4.2.0, adopting a significance level (α = 5%) as the decision criterion. Considering the ANOVA hypotheses: H₀: the means are equal ( ); H₁: at least one mean is different. The obtained p-value was 0.984 (p > 0.05); therefore, there was no statistical evidence to reject the null hypothesis, indicating that the means did not differ significantly (Table 4).
Table 4. Simple Analysis of Variance (One-Way ANOVA)

For the analysis of residual normality, the Shapiro–Wilk test was used, which aims to assess whether the distribution follows a normal distribution. Based on the hypotheses and the results of the proposed tests, considering a 5% significance level, the null hypothesis was rejected. Therefore, there was evidence to state that the errors did not follow a normal distribution. The p-value obtained from the Kruskal–Wallis test was 0.9277 (p > 0.05), indicating that the null hypothesis was not rejected and that there was no statistically significant difference among the groups.
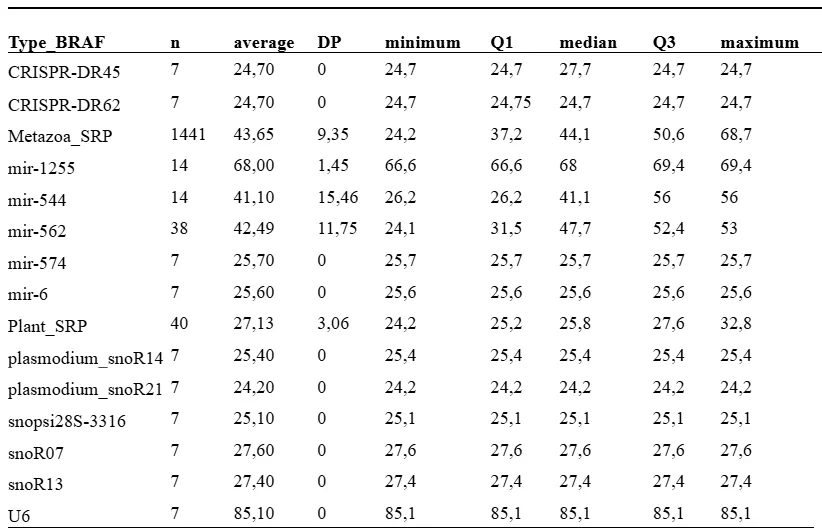
The analysis of the density of predicted ncRNAs in the sequences under study (Table 1) showed that, in general, there was a significant difference in the total number of predicted ncRNAs according to the RNA family to which they belonged. The Metazoa_SRP ncRNAs presented a total of 1,441 predicted sequences, compared with 40 sequences for Plant_SRP ncRNAs and a lower number for mir-562. Within the collection of RNA families, it is important to note that these families contain multiple sequence alignments, consensus secondary structures, and covariance models.
In Table 5, variability was observed in the datasets of the ncRNAs Metazoa_SRP, mir-1255, mir-544, mir-562, and Plant_SRP, as their standard deviations were higher than those observed for ncRNAs CRISPR-DR45, CRISPR-DR62, mir-574, mir-6, Plasmodium_snoR14, Plasmodium_snoR21, snopsi28S-3316, snoR07, snoR13, and U6. These latter ncRNAs presented a standard deviation equal to zero, indicating that the mean, median, first quartile, and third quartile values remained identical according to the values assigned to each RNA family (Table 5).
Table 5. Descriptive analysis of predicted ncRNAs sequences
As the assumptions required for ANOVA were not met, the Kruskal–Wallis test was performed, which is the non-parametric alternative to one-way ANOVA. This test evaluates the hypotheses that H₀: the groups have the same distribution, and H₁: at least one group differs from the others. The obtained p-value was < 2e-16 (p < 0.05); therefore, there was statistical evidence to reject the null hypothesis, indicating that at least one group differed significantly from the others (Table 6).
Table 6. Simple variance analysis test (One-Way ANOVA)

The normality of the residuals was assessed using the Shapiro–Wilk test, which evaluates whether a distribution follows a normal distribution. The results showed that the sample group deviated significantly from a normal distribution, with W = 0.988896 and p = 9.717 × 10⁻¹⁰ [55].
The Kruskal–Wallis test was performed as a non-parametric alternative to ANOVA [57]. The obtained p-value (< 2.2 × 10⁻¹⁶) was lower than the significance level of 0.05, leading to rejection of the null hypothesis and indicating that the groups presented statistically significant differences.
The in silico prediction of each BRAF gene transcript resulted in a broad identification of non-protein-coding RNAs within BRAF gene transcripts, resulting in 15 non-coding RNAs (ncRNAs). Among them, microRNAs, the main focus of the present study, were identified, including mir-1255, mir-544, mir-574, and mir-6.
Nemenyi’s non-parametric multiple comparison test was performed to evaluate pairwise comparisons between groups [58]. The results demonstrated significant differences between groups. Among the ncRNAs predicted in the intronic sequences of the BRAF gene and GRCh38.p14 reference genome, the CRISPR-DR45 and CRISPR-DR62 families differed from Metazoa_SRP, mir-544, and mir-574, but not from mir-1255 or the other analyzed ncRNAs.
The Metazoa_SRP ncRNAs, also known as signal recognition particle RNAs, are components of the signal recognition particle ribonucleoprotein (SRP) complex, which recognizes signal peptides and interacts with ribosomes, regulating protein synthesis [25]. Compared with ncRNAs such as mir-574, mir-6, Plasmodium_snoR14, Plasmodium_snoR21, snopsi28S-3316, snoR07, snoR13, and U6, no significant differences were observed.
Furthermore, mir-544 and mir-562 differed from the microRNAs mir-574 and mir-6, as well as from Plasmodium_snoR14, Plasmodium_snoR21, snopsi28S-3316, snoR07, snoR13, and U6. The mir-562 microRNA did not differ from Plant_SRP, whereas mir-1255 differed only from mir-544 (Figure 1).
The mir-544, mir-562, and Metazoa_SRP ncRNAs were the only groups that showed significant differences when compared with snRNA U6. U6 is a non-coding component of small nuclear RNA (snRNA) that forms an RNA–protein complex and interacts with other small nuclear ribonucleoproteins (snRNPs), participating in pre-mRNA splicing through intron removal [26].
The differences or similarities between non-coding RNAs (ncRNAs) may be explained by the fact that they belong to families with specific characteristics that evolved from common ancestors. Over time, these families underwent modifications that resulted in distinct RNA families. Therefore, the Rfam database provides access to ncRNA families represented by multiple sequence alignments and Covariance Models (CMs), which are used for the detection of homologous sequences with conserved structural characteristics [27].
Figure 1. Nemenyi multiple comparison test
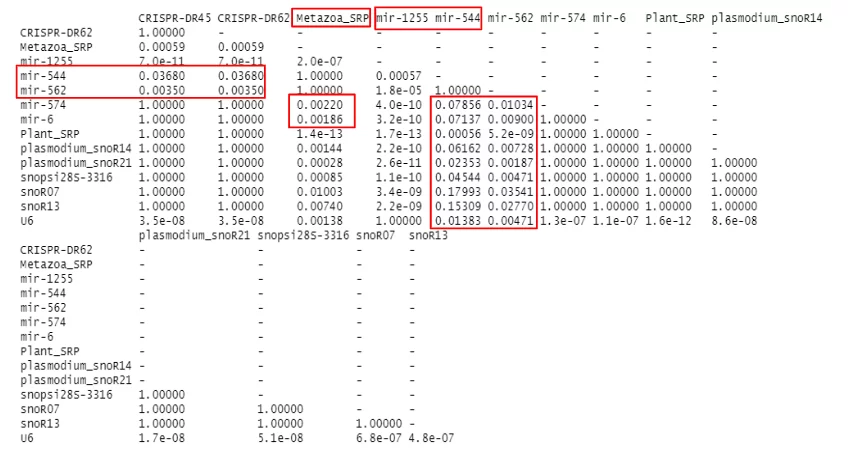
Note: Examples of ncRNAs that showed significant difference by the Nemenyi test are contained in the rectangles in color (red). U6 = RNA, U6 Small Nuclear 1; Metazoa_SRP = Metazoan signal recognition particle RNA; mir-1255 = mir-1255 microRNA; mir-562 = microRNA 562; mir-544 = microRNA 544; mir-574 = microRNA 574; mir-6 = microRNA 6.
As mir-562 was predicted in the majority of the sequences analyzed, we propose a new putative miRNA regulatory network that may provide new directions for functional studies. The prediction of mir-562 target genes resulted in 122 mRNA targets, among which the EIF1AX gene was highlighted. Recently, The Cancer Genome Atlas (TCGA) study, conducted in a large cohort of Papillary Thyroid Carcinomas (PTC), reported EIF1AX gene mutations in these tumors [8,28,29,30].
The EIF1AX gene is located on the X chromosome and encodes the eukaryotic translation initiation factor 1A (eIF1A) [29,30,31]. The protein promotes 43S preinitiation complex formation by stabilizing the binding of the ternary eIF2-GTP-Met-tRNAi complex to the 40S ribosomal subunit. Together with other translation initiation factors, eIF1A participates in a complex scanning mechanism responsible for accurately identifying the appropriate start codon on mRNA molecules in eukaryotes [29,30,31].
eIF1A is the eukaryotic ortholog of the bacterial translation initiation factor IF1, sharing homologous sequences between 32 and 95 amino acids that constitute the RNA-binding domain [30,31,34]. Additional domains present in eIF1A, but absent in IF1, include a helical domain adjacent to the RNA-binding region and highly charged, structured N- and C-terminal tails (NTT and CTT) [34]. The C-terminal tail is predominantly negatively charged but contains hydrophobic residues at its terminus, which have been proposed to participate in protein–protein interactions. Mutations in residues located on the RNA-binding surface of eIF1A have been reported to impair the formation of the 43S and 48S preinitiation complexes [34].
Before the TCGA study on PTC, EIF1AX mutations had already been reported in uveal melanomas [35,36]. More recently, EIF1AX mutations have also been identified in anaplastic thyroid carcinomas (ATC) [8,28,29,30,32,33].
4. DISCUSSION
We analyzed the sequences of the non-protein coding transcripts in the BRAF gene, the RNA U6 Small Nuclear 1, Metazoan signal recognition particle RNA, mir-1255, mir-562, mir-544, and mir-574. Anbalagan et al. [37] observed that miR-562 increases the formation of endothelial cell tubes, influencing the increase in angiogenic factors secreted from breast tumor cells MCF-7. miR-455-5p can interact with cyclin-dependent kinase inhibitor 1B, an enzyme inhibitor encoded in humans by the CDKN1B gene influencing the cell cycle process; miR-1255a can regulate transcription factor proteins acting as mediators of TGF-β signal transduction to SMAD4 in the TGF-β signaling pathway, as described in the study identifying exosomal miR-455-5p and miR-1255a as therapeutic targets for breast cancer [38].
In the study by Zhang et al. [39], NF-κB-activated mir-574 was described as promoting multiple malignant and metastatic phenotypes by targeting BNIP3 in thyroid carcinoma. It was identified that NF-κB/mir-574 signaling can reduce the aggressiveness of thyroid cancer, but mir-574, directly regulated by NF-κB/p65, promotes thyroid cancer tumorigenesis through inhibition of the BNIP3/AIF pathway [39]. Because BNIP3 and AIF cooperate to induce apoptosis and cavitation during epithelial morphogenesis, AIF also upregulated BNIP3 expression through mitochondrial production of reactive oxygen species and consequent stabilization of HIF-2α [40].
Studies have shown that mir-544a upregulation may be crucially involved in the translational repression of GKN1, suggesting its potential role as a biomarker and therapeutic target in patients with gastric cancer [41].
Záveský et al. [42], in a study on non-coding RNA profiles, analyzed the expression of small non-coding RNAs in plasma, indicating that U6 snRNA and mir-548b-5p may have pro-oncogenic functions, while mir-451a may act as a tumor suppressor in breast cancer [42].
The Signal Recognition Particle (SRP) plays a central role in the delivery of classic secretory and membrane proteins to the Endoplasmic Reticulum (ER); the signal recognition particle mediates post-translational targeting in eukaryotes [43]. Since the discovery of microRNAs in the process of dysregulation of tumor cell expression described by Calin et al. [24], a decrease in the expression of miR-15 and miR-16 in patients with chronic lymphocytic leukemia has been observed, playing a fundamental role in the regulation of gene expression and neoplastic cell formation related to several diseases [24].
However, the prevalence of these mutations in other common types of thyroid cancer, such as follicular carcinoma, and in benign thyroid nodules remains unknown. Furthermore, the histopathological features of thyroid tumors that carry EIF1AX mutations are not well characterized [29,30,31,32,33].
5. CONCLUSIONS
Studies have shown that many genes involved in the endocrine system are driven by microRNAs, and changes in microRNA expression levels have supported tumor processes [22,23]. More than 95% of thyroid carcinomas are derived from follicular cells, and their behavior varies from the indolently growing well-differentiated papillary and follicular carcinomas (PTC and FTC, respectively) to the extremely aggressive Undifferentiated Carcinoma (UC). Let us consider the importance of descriptive studies that tend to understand the main clinical characteristics that affect nodular thyroid disease, as well as the recognition of the post-transcriptional mechanisms regulated by these small RNAs, contributing to clinical diagnosis, corroborating therapeutic decisions in cases of indeterminate thyroid nodules, and furthering understanding of nodular disease in general.
REFERENCES
[1] Haugen, B. R., Alexander, E. K., Bible, K. C., Doherty, G. M., Mandel, S. J., Nikiforov, Y. E., Pacini, F., Randolph, G. W., Sawka, A. M., Schlumberger, M., Schuff, K. G., Sherman, S. I., Sosa, J. A., Steward, D. L., Tuttle, R. M., & Wartofsky, L. (2016). 2015 American Thyroid Association Management Guidelines for Adult Patients with Thyroid Nodules and Differentiated Thyroid Cancer: The American Thyroid Association Guidelines Task Force on Thyroid Nodules and Differentiated Thyroid Cancer. Thyroid, 26(1), 1–133.
[2] Cabanillas, M. E., McFadden, D. G., & Durante, C. (2016). Thyroid cancer. Lancet, 388(10061), 2783–2795.
[3] Moon, P. K., Chakoma, T., Ma, Y., & Megwalu, U. C. (2022). Thyroid Cancer Incidence, Clinical Presentation, and Survival Among Native Hawaiian and Other Pacific Islanders. Otolaryngology–Head and Neck Surgery, 167(6), 945–951.
[4] Vaccarella, S., Dal Maso, L., Laversanne, M., Bray, F., Plummer, M., & Franceschi, S. (2015). The Impact of Diagnostic Changes on the Rise in Thyroid Cancer Incidence: A Population-Based Study in Selected High-Resource Countries. Thyroid, 25(10), 1127–1136.
[5] Krasner, M. S., Epstein, R. M., Beckman, H., Suchman, A. L., Chapman, B., Mooney, C. J., Quill, T. E., & Association of an educational program in mindful communication with burnout, empathy, and attitudes among primary care physicians. (2009). JAMA, 302(12), 1284–1293.
[6] Patel, A., Kaur, H., Xess, I., Michael, J. S., Savio, J., Rudramurthy, S., Singh, R., Shastri, P., Umabala, P., Sardana, R., Kindo, A., Capoor, M. R., Mohan, S., Muthu, V., Agarwal, R., & Chakrabarti, A. (2020). A multicentre observational study on the epidemiology, risk factors, management and outcomes of mucormycosis in India. Clinical Microbiology and Infection, 26(7), 944.e9–944.e15.
[7] Davies, L., Morris, L. G., Haymart, M., Chen, A. Y., Goldenberg, D., Morris, J., Ogilvie, J. B., Terris, D. J., Netterville, J., Wong, R. J., & Randolph, G. (2015). American Association of Clinical Endocrinologists and American College of Endocrinology Disease State Clinical Review: The Increasing Incidence of Thyroid Cancer. Endocrine Practice, 21(6), 686–696.
[8] Agrawal, N., Akbani, R., Aksoy, B. A., Ally, A., Arachchi, H., Asa, S. L., Auman, J. T., Yau, C., & TCGA Network. (2014). Integrated Genomic Characterization of Papillary Thyroid Carcinoma. Cell, 159(3), 676–690.
[9] Ricarte-Filho, J. C. M., & Kimura, E. T. (2006). O microRNA LET-7 apresenta função supressora de tumor em carcinoma papilífero da tireoide. Arquivos Brasileiros de Endocrinologia & Metabologia, 50(6), 1102–1108.
[10] Cox, M. M., Doudna, J. A., & O’Donnell, M. (2012). Biologia Molecular – Princípios e Técnicas (1a ed.). Artmed.
[11] Brosius, J., & Raabe, C. A. (2016). What is an RNA? A top layer for RNA classification. RNA Biology, 13(2), 140–144.
[12] Zaha, A., Ferreira, H. B., & Passaglia, L. M. P. (Orgs.). (2014). Biologia molecular básica (5a ed.). Artmed.
[13] Waters, L. S., & Storz, G. (2009). Regulatory RNAs in bacteria. Cell, 136(4), 615–628.
[14] Winkler, W. C. (2005). Riboswitches and the role of noncoding RNAs in bacterial metabolic control. Current Opinion in Chemical Biology, 9(6), 594–602.
[15] Han, Y., Liu, L., Fang, N., Yang, R., & Zhou, D. (2013). Regulation of pathogenicity by noncoding RNAs in bacteria. Future Microbiology, 8(5), 579–591.
[16] Azhikina, T. L., Ignatov, D. V., Salina, E. G., Fursov, M. V., & Kaprelyants, A. S. (2015). Role of Small Noncoding RNAs in Bacterial Metabolism. Biochemistry (Moscow), 80(13), 1633–1646.
[17] Hüttenhofer, A., Schattner, P., & Polacek, N. (2005). Non-coding RNAs: hope or hype? Trends in Genetics, 21(5), 289–297.
[18] Bartel, D. P. (2004). MicroRNAs: genomics, biogenesis, mechanism, and function. Cell, 116(2), 281–297.
[19] Wahid, F., Shehzad, A., Khan, T., & Kim, Y. Y. (2010). MicroRNAs: synthesis, mechanism, function, and recent clinical trials. Biochimica et Biophysica Acta (BBA) – Molecular Cell Research, 1803(11), 1231–1243.
[20] Zhang, B., Pan, X., Cobb, G. P., & Anderson, T. A. (2007). microRNAs as oncogenes and tumor suppressors. Developmental Biology, 302(1), 1–12.
[21] Farazi, T. A., Hoell, J. I., Morozov, P., & Tuschl, T. (2013). MicroRNAs in human cancer. Advances in Experimental Medicine and Biology, 774, 1–20.
[22] Nikiforov, Y. E. (2008). Thyroid carcinoma: molecular pathways and therapeutic targets. Modern Pathology, 21(S2), S37–S43.
[23] Nikiforov, Y. E., Biddinger, P. W., & Thompson, L. D. (Eds.). (2012). Diagnostic Pathology and Molecular Genetics of the Thyroid (2nd ed.). Lippincott Williams & Wilkins.
[24] Calin, G. A., Dumitru, C. D., Shimizu, M., Bichi, R., Zupo, S., Noch, E., Aldler, H., Rattan, S., Keating, M., Rai, K., Rassenti, L., Kipps, T., Negrini, M., Bullrich, F., & Croce, C. M. (2002). Frequent deletions and down-regulation of micro-RNA genes miR15 and miR16 at 13q14 in chronic lymphocytic leukemia. Proceedings of the National Academy of Sciences, 99(24), 15524–15529.
[25] Liu, L., Ben-Shlomo, H., Xu, Y. X., Stern, M. Z., Goncharov, I., Zhang, Y., & Michaeli, S. (2003). The trypanosomatid signal recognition particle consists of two RNA molecules, a 7SL RNA homologue and a novel tRNA-like molecule. Journal of Biological Chemistry, 278(20), 18271–18280.
[26] Brow, D. A., & Guthrie, C. (1988). Spliceosomal RNA U6 is remarkably conserved from yeast to mammals. Nature, 334(6179), 213–218.
[27] Kalvari, I., Argasinska, J., Quinones-Olvera, N., Nawrocki, E. P., Rivas, E., Eddy, S. R., Bateman, A., Finn, R. D., & Petrov, A. I. (2018). Rfam 13.0: shifting to a genome-centric resource for non-coding RNA families. Nucleic Acids Research, 46(D1), D335–D342.
[28] Roman, B. R., Morris, L. G., & Davies, L. (2017). The thyroid cancer epidemic. Current Opinion in Endocrinology, Diabetes and Obesity, 24(5), 332–336.
[29] Elsherbini, N., Kim, D. H., Payne, R. J., Hudson, T., Forest, V. I., Hier, M. P., Payne, A. E., & Pusztaszeri, M. P. (2022). EIF1AX mutation in thyroid tumors: a retrospective analysis of cytology, histopathology and co-mutation profiles. Journal of Otolaryngology – Head & Neck Surgery, 51(1), 43.
[30] French, K. E., Nikitski, A. V., Yip, L., Nikiforova, M. N., Nikiforov, Y. E., & Carty, S. E. (2022). Clinicopathological features and outcomes of thyroid nodules with EIF1AX mutations. Endocrine-Related Cancer, 29(8), 467–473.
[31] Gargano, S. M., Badjatia, N., Nikolaus, Y., Peiper, S. C., & Wang, Z. X. (2021). Characterization and Clinical Significance of EIF1AX Mutations and Co-Mutations in Cytologically Indeterminate Thyroid Nodules: A 5-Year Retrospective Analysis. Acta Medica Academica, 50(1), 4–12.
[32] Li, Y., Guo, L., Ying, S., Feng, G. H., & Zhang, Y. (2020). Transcriptional repression of p21 by EIF1AX promotes the proliferation of breast cancer cells. Cell Proliferation, 53(10), e12903.
[33] Simões-Pereira, J., Moura, M. M., Marques, I. J., Rito, M., Cabrera, R. A., Leite, V., & Cavaco, B. M. (2019). The role of EIF1AX in thyroid cancer tumourigenesis and progression. Journal of Endocrinological Investigation, 42(3), 313–318.
[34] Nag, N., Lin, K. Y., Edmonds, K. A., Yu, J., Nadkarni, D., Marintcheva, B., & Marintchev, A. (2016). eIF1A/eIF5B interaction network and its functions in translation initiation complex assembly and remodeling. Nucleic Acids Research, 44(15), 7441–7456.
[35] Scholz, S. L., Möller, I., Reis, H., Süßkind, D., van de Nes, J. A. P., Leonardelli, S., Schilling, B., Livingstone, E., Schimming, T., Paschen, A., Sucker, A., Murali, R., Steuhl, K. P., Schadendorf, D., Westekemper, H., & Griewank, K. G. (2017). Frequent GNAQ, GNA11, and EIF1AX Mutations in Iris Melanoma. Investigative Ophthalmology & Visual Science, 58(9), 3464–3470.
[36] Robertson, A. G., Shih, J., Yau, C., Gibb, E. A., Oba, J., Mungall, K. L., Hess, J. M., Uzunangelov, V., Walter, V., Danilova, L., Lichtenberg, T. M., Kucherlapati, M., Kimes, P. K., Tang, M., Penson, A., Babur, O., Akbani, R., Bristow, C. A., Hoadley, K. A., Iype, L., & Woodman, S. E. (2017). Integrative Analysis Identifies Four Molecular and Clinical Subsets in Uveal Melanoma. Cancer Cell, 32(2), 204–220.e15.
[37] Anbalagan, D., Yap, G., Yuan, Y., Pandey, V. K., Lau, W. H., et al. (2014). Annexin-A1 Regulates MicroRNA-26b* and MicroRNA-562 to Directly Target NF-κB and Angiogenesis in Breast Cancer Cells. PLOS ONE, 9(12), e114507.
[38] Zaballos, M. A., & Santisteban, P. (2017). Key signaling pathways in thyroid cancer. The Journal of Endocrinology, 235(2), R43–R61.
[39] Zhang, Z. J., Xiao, Q., & Li, X. Y. (2020). NF-κB-Activated miR-574 Promotes Multiple Malignant and Metastatic Phenotypes by Targeting BNIP3 in Thyroid Carcinoma. Molecular Cancer Research, 18(7), 955–967.
[40] Qi, Y., Tian, X., Liu, J., Han, Y., Graham, A. M., Simon, M. C., Penninger, J. M., Carmeliet, P., & Li, S. (2012). BNIP3 and AIF cooperate to induce apoptosis and cavitation during epithelial morphogenesis. The Journal of Cell Biology, 198(1), 103–114.
[41] Stella Di Stadio, C., Faraonio, R., Federico, A., Altieri, F., Rippa, E., & Arcari, P. (2019). GKN1 expression in gastric cancer cells is negatively regulated by miR-544a. Biochimie, 167, 42–48.
[42] Záveský, L., Jandáková, E., Turyna, R., Langmeierová, L., Weinberger, V., & Minář, L. (2016). Supernatant versus exosomal urinary microRNAs. Two fractions with different outcomes in gynaecological cancers. Neoplasma, 63(1), 121–132.
[43] Abell, B. M., Pool, M. R., Schlenker, O., Sinning, I., & High, S. (2004). Signal recognition particle mediates post-translational targeting in eukaryotes. The EMBO Journal, 23(14), 2755–2764.
[44] Garcia, A. C. (2021). In Silico Prediction for ncRNAs in Prokaryotes. In S. Mukhtar (Ed.), Modeling Transcriptional Regulation (Methods in Molecular Biology, Vol. 2328, pp. 201-215). Humana.
[45] Nawrocki, E. P., Kolbe, D. L., & Eddy, S. R. (2009). Infernal 1.0: inference of RNA alignments. Bioinformatics, 25(10), 1335–1337.
[46] Nawrocki, E. P., & Eddy, S. R. (2013). Infernal 1.1: 100-fold faster RNA homology searches. Bioinformatics, 29(22), 2933–2935.
[47] Griffiths-Jones, S. (2006). miRBase: the microRNA sequence database. Methods in Molecular Biology, 342, 129–138.
[48] Kozomara, A., & Griffiths-Jones, S. (2014). miRBase: annotating high confidence microRNAs using deep sequencing data. Nucleic Acids Research, 42(D1), D68–D73.
[49] Bruni, R., Cesarone, F., Scozzari, A., & Tardella, F. (2013). No arbitrage and a linear portfolio selection model. Economics Bulletin, 33(2), 1247–1258.
[50] Ogle, D., Wheeler, P., & Dinno, A. (2019). Simple Fisheries Stock Assessment Methods. The Comprehensive R Archive Network.
[51] Matloff, N. (2019). Probability and statistics for data science. CRC Press.
[52] Fraser, D. A. S. (1992). Introduction to Bartlett (1937) ‘Properties of Sufficiency and Statistical Tests.’ In S. Kotz & N. L. Johnson (Eds.), Breakthroughs in Statistics (pp. 121–126). Springer.
[53] Sokal, R. R., & Rohlf, F. J. (1995). Biometry: The Principles and Practice of Statistics in Biological Research (3rd ed.). W. H. Freeman and Co.
[54] Field, A. (2009). Discovering Statistics Using SPSS (3rd ed.). SAGE Publications.
[55] Shapiro, S. S., & Wilk, M. B. (1965). An analysis of variance test for normality (complete samples). Biometrika, 52(3–4), 591–611.
[56] Montgomery, D. C., & Runger, G. C. (2003). Applied Statistics and Probability for Engineers (3rd ed.). John Wiley & Sons.
[57] Kruskal, W. H., & Wallis, W. A. (1952). Use of ranks in one-criterion variance analysis. Journal of the American Statistical Association, 47(260), 583–621.
[58] Nemenyi, P. (1963). Distribution-Free Multiple Comparisons [Doctoral dissertation, Princeton University].
AUTHOR INFORMATION
[1] PhD in Internal Medicine (UFPR). Master of Science (Biochemistry) from UFPR. Bachelor’s degree in Biomedicine (Unibrasil). Focuses mainly on Clinical Pathology, Molecular Biology, Bioinformatics, non-coding RNAs in prokaryotes, BRAFV600E mutation in thyroid FNAB, and microRNAs. Currently Assistant Professor PhD at Evangelical Mackenzie Faculty of Paraná – FEMPAR. ORCID: https://orcid.org/0000-0003-2314-5774. Currículo Lattes: http://lattes.cnpq.br/3603191721520716.
Authors’ Contributions:
Amanda Carvalho Garcia: Conceptualization and study design, literature search, data analysis and interpretation, manuscript drafting, critical revision of intellectual content, and approval of the final version.
ARTICLE INFORMATION
Conflict of Interest:
N/A.
Acknowledgments:
The authors thank the participants who gave their time and effort to participate in the study, Hamashia, J.C.
Funding:
This study was financed in part by the Coordination of Improvement of Higher Education Personnel — Brazil (CAPES) — Finance Code 001.
Note:
Supplementary material S1.
AI Use Statement:
N/A.
Copyright and License Information:
This is an Open Access article distributed under the terms of the Creative Commons Attribution License, which permits unrestricted use, distribution, and reproduction in any medium, provided the original author and source are credited.
The names and addresses entered in this journal site will be used exclusively for the stated purposes of this journal and will not be made available for any other purpose or to any other party.
- ISSN (Online): 2448-0959
- Creative Commons License: This work is licensed under a Creative Commons Attribution 4.0 International License.
Publication History:
Received: January 21, 2025.
Peer-reviewed and accepted: February 25, 2026.
Edited material approved by authors: August 31, 2026.