ORIGINAL ARTICLE
NARCIZO, Samara Cristina Garcia [1]
NARCIZO, Samara Cristina Garcia. Application of the PDCA cycle and the seven basic quality tools in the routine of aeroviário service: a case study in an airline in the city of Rio de Janeiro. Revista Científica Multidisciplinar Núcleo do Conhecimento. Year 07, Ed. 04, Vol. 03, p. 45-70. April 2022. ISSN: 2448-0959, Access link: https://www.nucleodoconhecimento.com.br/production-engineering/aeroviario-service
ABSTRACT
Excellence in customer service is a competitive differentiator for organizations. To achieve it, it is necessary to adopt positive approaches and behaviors, as a good service with education and mutual respect is the least that the consumer expects when entering an establishment. In this context, this article has as its guiding question: can the seven basic quality tools and the PDCA cycle be applied in the aeroviário[2] routine? Therefore, the general objective of this research is to demonstrate the application of the seven basic quality tools and the PDCA cycle in the air service routine of some sectors of an airline located in the city of Rio de Janeiro, aiming at the continuous improvement of the organization and higher quality in the services provided. In order to demonstrate the use of this method and these tools, a case study was carried out in the aeroviário in an Airline, evaluating the use of the presented tools, in order to identify the main problem that has been affecting the quality of service and customer satisfaction. The survey results showed that the improvement of the company depends not only on customer satisfaction, but also on the well-being of the employees who are part of it. In the end, it was concluded that the use of the seven basic quality tools and the PDCA Cycle, despite being practical and simple, are efficient and allow the organization to achieve good results both at organizational and operational levels, presenting excellent results for the company. Although the seven tools were not applied in the investigated company, the study showed that they can be useful in the management of improvement, demonstrating that their application and obtaining great results is possible in all organizations.
Keywords: Continuous Improvement; Quality tools; PDCA cycle; Airline.
1. INTRODUCTION
Airport workers and aeroviário, around 30,000 workers, work on land to ensure the air travel of 1.6 million tons of cargo and 110 million people a year. Despite the apparent modernization of Brazilian airports, behind the facade of a shopping center, several risks persist in each sector (OLIVEIRA, 2008).
In this way, given that the first impression is the one that remains, excellence in service has been a competitive differential in relation to customer service. Therefore, for this to occur, it is necessary to adopt positive approaches and behaviors and, in cases of public service, to maintain a good appearance and hygiene. These practices are important so that there is quality in the service provided (RIBEIRO, 2012).
In many cases, assisting people requires a high degree of maturity, as there are numerous factors that can lead to failure in service, such as: being attending to someone in person and interrupting the service to view notifications on the phone; going out for coffee or a snack; talk to the colleague next door about the weekend, among others (RIBEIRO, 2012).
For improvements to occur, methods and tools need to be put into practice. In this context, this article has as its guiding question: can the seven basic quality tools and the PDCA Cycle be applied in the aeroviário routine? And, as a general objective, to demonstrate the application of the seven basic quality tools and the PDCA Cycle in the air service routine of some sectors of an airline located in the city of Rio de Janeiro, aiming at the continuous improvement of the organization and greater quality in services provided.
In order to demonstrate the use of this method and these tools, a case study was carried out in the aeroviário in an Airline, evaluating the use of the tools presented in order to identify the main problem that has been affecting the quality of service and customer satisfaction towards the services provided.
2. LITERATURE REVIEW
2.1 IMPROVEMENT CONCEPT
Improvement is an activity that must be present in the routines of the entire company. All business processes, whether productive or administrative, can and should be continually evaluated and improved. In this context, there are two strategies for process improvement: Revolutionary Improvement (Radical) and Continuous Improvement (Incremental) (TOLEDO, 2017).
According to Toledo (2017), Revolutionary (Radical) Improvement assumes that the main means for improvement is a large and dramatic change in the way the operation works. The impact of these improvements is relatively sudden, they are rarely cheap and usually require large capital investments. Furthermore, this improvement process often interrupts or disrupts ongoing work in the operation and involves changes in products/services or process technology.
On the other hand, Continuous Improvement (Incremental), adopts an approach that assumes frequent and smaller steps of improvement, involving everyone in the company, whether managers or workers. In this context, the most important thing is the probability that the improvement will continue, that is, the improvement process is more important than the size of each step (TOLEDO, 2017).
In the case study carried out, the strategy used to improve processes was continuous improvement, aiming to meet the objective of guaranteeing the continuous improvement of the organization and greater quality in the services provided.
2.2 CONTINUOUS IMPROVEMENT
Continuous improvement is based on the Japanese system: Kaizen. Translating this term into Portuguese, we find that “KAI” means change, and “ZEN” means good, that is, in its etymology, the term Kaizen means change for the better. According to Imai (2005), creator of Kaizen, the term means continuous improvement throughout the organization.
According to Machado (2010), to develop a continuous improvement program within an organization, it is necessary that there are factors that facilitate the implementation of this program and the achievement of consistent and effective results.
There are methods and tools that contribute to the development of continuous improvement, the method being the logical sequence to achieve the desired goal. As for the tools, they are the resources to be used in the method (FIGUEIREDO; SATOSHI; ALVES, 2014).
In this case study, the method presented is the PDCA Cycle and the tools are the seven basic quality tools.
2.3 PDCA CYCLE
The PDCA Cycle was created by Deming in the 50s, and is considered the most efficient method of continuous improvement, being divided into four stages: Plan (P), Do (D), Check (C) and Act (A). The letters that make up the name of the cycle have their origin in the initials of the stages in the English language, which are: “Plan”, “Do”, “Check” and “Act” (FERREIRA, 2015).
The application of this method consists of establishing improvements to the standards set up in the organization, which serve as a reference for its management (ALENCAR, 2008), consisting of a simple technique that aims to control the process.
This method can be used continuously, as a tool for managing the activities of a company, being an efficient way to present an improvement in the process, standardize the information aiming at greater quality control, avoid logical errors in the analyzes and make the information more understandable for everyone (ALENCAR, 2008).
It can also be used in order to facilitate the change to management aimed at continuous improvement (ABRANTES, 2008).
2.3.1 PDCA CYCLE STEPS
The PDCA Cycle consists of 4 stages, namely: Plan, Do, Check and Act. The process carried out in each of these stages will be detailed below, using the concepts addressed by Bezerra (2017) as a foundation.
P = (Plan): it is the first step of the cycle. In it, a plan is established based on the company’s guidelines, and the objectives, paths and methods to be followed are also defined. Then, the problems encountered, the items described in the problem, the questions to be answered must be identified and, finally, an action plan must be developed (BEZERRA, 2017).
D = (Do): means putting the planning into practice, that is, executing the action plan previously prepared according to what was pre-established (BEZERRA, 2017).
C = (Check): at this stage of the cycle, one must evaluate what was done during the execution stage, making comparisons and identifying the differences between what was planned and what was executed. It is also necessary to verify what was learned during the execution of the plan, comparing the results with the predictions that were made in the planning stage, in order to observe whether the objectives were achieved or not (BEZERRA, 2017).
A = (Act): this step aims to carry out corrective actions for the failures found during the process. After the correction is made, the cycle must be repeated, continuing the process of continuous improvement. It is through the critical analysis of the PDCA Cycle that a definitive action plan is established for the implementation of the activities to be carried out after the cycle studies (BEZERRA, 2017).
Also, for Bezerra (2017), the changes implemented by the PDCA Cycle can be considered as reversible and irreversible:
- Reversible changes: are the changes that we can return to the initial stage, that is, to its original state. They are those that, even having occurred, can be reversed without leaving any kind of trace in the system or process;
- Irreversible changes: these are changes that, once implemented, cannot be undone (the previous stage can no longer be reached).
2.4 THE SEVEN QUALITY TOOLS
Quality tools are techniques used to: define, measure, analyze and propose solutions to problems that will eventually be found and that interfere with the good performance of organizational processes. They emerged in the 1950s, based on existing concepts and practices. Since then, its use has been of great value to management systems (MARCONDES, 2016).
According to Magalhães (2017), the objectives of using the seven quality tools are: to raise quality levels through effective solutions to problems; reduce costs by implementing more uniform products and processes; identify existing problems in processes, suppliers and products; identify root causes of problems and solve them effectively.
The seven quality tools covered in this article are: Histogram; Pareto Diagram; Cause and Effect Diagram; Scatter diagram; Stratification; Check Sheet and Control Chart.
2.4.1 HISTOGRAMS
According to the Centro de Engenharia da Qualidade (2016), histograms can be defined as bar graphs that depict variation over a specific range. This tool was developed in 1833 by Guerry for the purpose of describing his analysis of crime data. Since then, they have been applied in the most diverse areas in order to describe the data.
The histogram is a tool that makes it possible to know the characteristics of a particular product or batch, promoting an overview of the variation of a set of data, describing the frequency with which the processes vary and the distribution of the data as a whole (CENTRO DE ENGENHARIA DA QUALIDADE, 2016).
The quantitative data collected can be grouped, analyzed and represented in frequency classes, allowing the distinction of the shape, central point and variation of the distribution, in addition to other data such as: amplitude and symmetry in their distribution (PMKB, 2014).
For Pereira (2017), the steps to assemble a histogram are: obtaining a sample of 50 to 100 data (50 < n < 100); determine the largest and smallest value (xmax and xmin); calculate the total amplitude of the data R = xmax – xmin; determine the number of classes k = √n; calculate the amplitude of classes h = R/k; determine class boundaries; build a frequency table; draw the diagram.
According to Pereira (2017), the types of histograms are:
- General Type (Symmetric): The average value of the histogram is in the middle of the data range. The frequency is highest in the middle and gradually becomes lower towards the extremes. The profile is symmetrical. It is the most frequently found format for processes within normality;
- Comb Type (Multimodal): Classes have high and low frequencies, alternately. This profile occurs when the amount of data included in the class varies from class to class, or when there is a particular trend in the way data is rounded;
- Positive skew type (negative skew): The mean value of the histogram is located to the left (right) of the center of the range of variation. The frequency decreases somewhat abruptly towards the left (right), but smoothly towards the right (left). This occurs when the lower (upper) limit is controlled, either theoretically, or by a specification value, or when values lower (higher) than a certain value do not occur;
- Right slope type (left slope): The average value of the histogram is located to the left (right) of the center of the range of variation. The frequency decreases somewhat abruptly towards the left (right), and slowly towards the right (left). This occurs when 100% screening is performed due to low process capacity and also when positive (negative) asymmetry becomes even more extreme;
- Plateau type: The frequency in each class forms a plateau, because the classes have more or less the same frequency except for those at the ends. This format occurs when there is a mixture of several distributions that have different means;
- Double peak type (bimodal): The frequency is low, near the middle of the data range and there is a peak on either side. This format occurs when two distributions with very different means are mixed together;
- Isolated peak type: There is a small isolated peak in addition to a general type histogram. This is a profile that occurs when there is a small inclusion of data from a different distribution, as in the case of a process abnormality, measurement error, or inclusion of data from a different process.
Therefore, the way these data are distributed contributes in a decisive way in the identification of the data.
2.4.2 PARETO DIAGRAM
PARETO DIAGRAM Every company is often faced with a series of problems to be solved. Pareto analysis is one of the tools that helps in determining priorities, that is, the order of solution of each problem (ABRANTES, 2008).
The Pareto Diagram and its analysis are used for defect correction priorities. The causes and defects are researched and placed in tables, which facilitate the visualization of the participation of each cause in the total of defects (ABRANTES, 2008).
Finally, the information is distributed in a graph (Pareto Diagram) which can also be known as the ABC curve, which is divided into the following classes:
- Class A – These are the most important problems (20% of the total);
- Class B – Intermediate problems (30% of the total);
- Class C – These are the least important problems (50% of the total).
Alves (2012), presents the steps for the assembly of the Pareto Diagram, they are: identification of the problem; stratification of the problem, that is, the discovery of its causes; collection of data related to it; discovery of priorities, through the Pareto chart; and attribution of responsibility for solving problems, that is, defining who will solve each problem and when.
2.4.3 CAUSE AND EFFECT DIAGRAM
Created in order to demonstrate how the various factors of a process within an industry are interconnected, this diagram was developed by Kaoru Ishikawa, a professor at the University of Tokyo, in 1943.
Being one of the seven basic quality tools, the diagram consists of a graph, whose function is to organize the reasoning of the discussions of a priority problem, arising from different processes, mainly in industrial production. Therefore, its objective is to simplify the recognition of the causes of the problems, so that they are remedied.
The figure below represents the composition of this diagram, considering that the causes of the problems are classified into 6 types, known as the 6Ms: Method, Machine, Measurement, Other Factors (Environment), Labor and Material.
Figure 1 – Cause and Effect Diagram
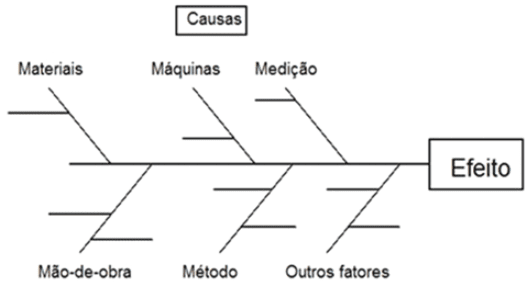
According to Werkema (2006), when drawing up a diagram, the highest concentration of people involved with the effect must be included, so that no relevant information is missed.
In addition, whenever possible, the degree of importance of the causes should also be composed of measurable data, in addition to the experiences of each individual involved.
According to Werkema (2006), some steps for the construction of a Cause and Effect Diagram are: defining the quality characteristic or the problem to be analyzed; write the quality or problem characteristic inside a rectangle on the right side of a sheet of paper; relate within rectangles, such as large pimples, the primary causes that affect the quality characteristics or the problem defined in the first item; to relate, with medium pimples, the secondary causes that affect the primary causes; to relate, with small pimples, the tertiary causes that affect the secondary causes; Identify on the diagram the causes that appear to have the most significant effect on the quality characteristic or problem. In this step, the available knowledge about the process is used, considering previously collected data or collecting new data; record other information that must be included in the diagram, such as: title, date of drawing up the diagram and those responsible for drawing up the diagram.
2.4.4 SCATTER DIAGRAM
As the next step to be taken after the Cause and Effect Diagram, the Scatter Diagram is represented by graphs that identify the relationship between causes and effects.
Through this, it is possible to recognize if there is a tendency of joint variation, as this collaborates to increase the efficiency of the process control methods, facilitating the identification of possible problems. Thus, the scatterplot shows the direction of a variable when the values of another related variable increase.
According to Werkema (2006) the steps to be followed for the construction of a Scatter Diagram are: collect at least 30 pairs of observations (x, y) of the variables whose type of relationship will be studied; record the collected data in a table; choose the variable that will be represented on the horizontal x axis. This variable must be the one that, for some reason, is considered as predicted by the other variable, which will be plotted on the y-axis; determine the maximum and minimum values of the observations of each variable; choose the appropriate and easy-to-read scales for the horizontal and vertical axes. The smallest value of the scale must be less than the minimum, and the largest value of the scale must be greater than the maximum of the observations of the corresponding variable. The lengths of the two axes should be approximately equal; draw the scales on graph paper; represent, on the graph, the pairs of observations (x, y). When there are pairs of repeated observations, this fact should be indicated by drawing concentric circles; record the important information that must be included in the graph, such as: title, collection period, number of pairs of observations, identification and unit of measurement of each axis, identification of the person responsible for building the diagram.
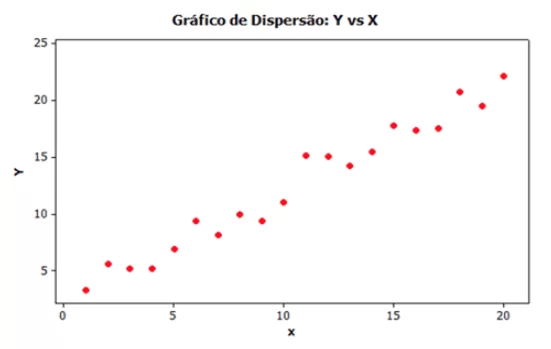
The Graph below demonstrates one of the possible aspects of using a scatterplot. In the case below, the points form a pattern that indicates that an increase in X (variable 1) implies an increase in Y (variable 2), resulting in a positive correlation of these variables. However, one of the possible aspects would be a negative correlation, when an increase in one of the variables implies a decrease in the other, or even no relationship, which is when the definition of the behavior of variable 2 becomes impossible.
Chart 1 – Example of a Scatter Chart
2.4.5 STRATIFICATION
Stratification is a tool that allows the division of certain data groups into different subgroups, always according to the desired requirements, which are called stratification factors.
The causes that generate some variation in the production process can become possible stratification factors, for example, they are natural stratification factors: machines, shifts, environmental conditions, methods, people, raw materials, etc.
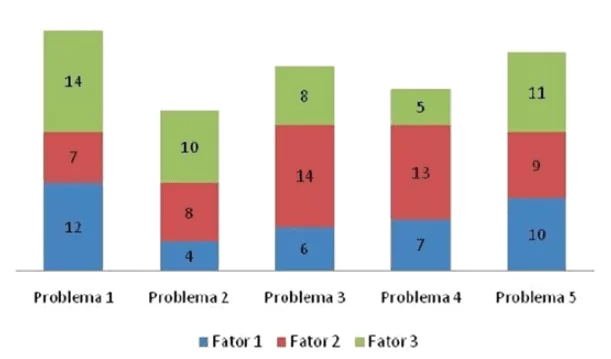
The following chart presents an example, where problems 1 to 5 are subdivided into stratification factors 1 to 3.
Chart 2 – Example of a stratified chart
This tool can be applied in the following stages: observation, analysis, execution, verification and standardization of the PDCA Cycle. It is in the observation phase of the PDCA that the identification of the characteristics of the problems begins, stratifying the information and considering several points of view, among them: time; whether results show a significant variation at different times of the day; local, if the results of different production lines or locations where the product is marketed have a relevant variation; inputs, considering the suppliers; and individual, relating the operator to the workplace.
The diagnosis obtained will only find the main causes of a problem if the data collection has been carried out correctly.
2.4.6 CHECK SHEET
It is considered the simplest of the seven basic quality tools. This is organized through charts, tables or spreadsheets, which facilitates the collection and analysis of data. It also consists of a means of facilitating, organizing and standardizing the collection and recording of data (WERKEMA, 2006).
The main objectives of the check sheet are: to facilitate data collection; organize them in such a way that it is not necessary to rearrange them later; and, standardize the collection process to be carried out, so that the same process is always carried out, regardless of who collects them.
To choose the type of check sheet that will be used, knowledge of the purpose of data collection is needed. Among the different types are:
- For frequency distribution of a control item: the distribution of the values of a control item associated with a process is studied, allowing the data to be classified exactly at the moment they are collected. Normally, a histogram is used to perform this type of analysis;
- For defect classification: indicates the defect quantities for each item inspected, showing which types are most frequent and which are least frequent. For example, a checklist that presents the types of problems that cause customer complaints, machine defects, raw material failures, etc.;
- For Defect Location: Allows identification and recording of the physical location of defects, accidents, or other types of observation. The intention is that this type of check sheet has a product design printed so that it is marked where the defects are being observed, facilitating the identification of the root causes of the problems;
- For identification of causes of defects: allows a broader stratification of the factors that constitute a defect.
According to Werkema (2006), some recommendations for the elaboration and use of verification sheets are: defining the objective of data collection; determine the type of check sheet to be used; establish an appropriate title for the check sheet; include fields for recording the names and codes of the departments involved; include fields for recording the names and codes of the products considered; include fields to identify the person(s) responsible for completing the verification sheet (who); include fields for recording the origin of the data (collection date shift, measuring instrument, total number of evaluated products, among others); present, on the verification sheet itself, simplified instructions for filling it out; make all people involved in the process of obtaining data aware of the purpose and importance of collection (why); inform everyone involved in the data collection process on exactly what, where, when and how it will be measured; instruct all persons involved in data collection on how to complete the check sheet; make sure that all stratification factors of interest (machines, operators, shifts, raw materials, among others) have been included in the verification sheet; perform a pre-test before starting to use the verification sheet, in order to identify possible flaws in the preparation of the sheet.
2.4.7 CONTROL CHART
Variations in a production process consequently generate variations in their respective final products or services provided. Such changes occur due to: environmental changes, differences between machines, suppliers or labor, changes between raw materials, among others.
The variability presented at the end of the production process probably cannot be completely eliminated. For this reason, it must be monitored repeatedly so that products with defects, of low quality, are not generated, losing the link with the customer. In this context, “control charts are tools for monitoring variability and evaluating process stability” (WERKEMA, 2006).
The causes of variability can come from the processes, being classified as common or random causes, that is, natural causes of the process, being caused by common reasons. Such causes may occur even if all operations are performed following the operating instructions. Therefore, the use of control charts is an important analysis tool that will allow the creation of a plan that blocks the previously identified causes of variability (WERKEMA, 1995).
3. METHODOLOGY
In order to achieve the proposed objectives, this research is characterized as qualitative, which offers the possibility of answering which quality control tools can be applicable in solving problems, showing the “how” and “why” of using them. According to Dalfovo; Lana and Silveira (2008, p. 06),
A pesquisa qualitativa, por sua vez, descreve a complexidade de determinado problema, sendo necessário compreender e classificar os processos dinâmicos vividos nos grupos, contribuir no processo de mudança, possibilitando o entendimento das mais variadas particularidades dos indivíduos.
According to Minayo (2009), qualitative research works with the universe of beliefs, meanings, aspirations, motives, values and attitudes performed by the individual. This set of phenomena is understood as part of social reality, because the human being is distinguished by acting, thinking and interpreting their actions according to the reality experienced with their peers.
Initially, a bibliographic survey was carried out to deepen and study the theme, aiming “to offer means to define, solve, not only already known problems, but also to explore new areas where the problems have not crystallized sufficiently” (MANZO apud MARCONI; LAKATOS 1996, p. 66).
According to Vergara (2000, p. 48), a bibliographic study can be developed based on material already published, taking into account that it can be from a primary or secondary source. In its composition, materials accessible to the general public are used, that is, books, magazines, newspapers and electronic networks. This study methodology acts as an analytical tool for other types of research.
Therefore, bibliographic research is not a mere reproduction of what has already been written on a given subject, as it favors the analysis of a topic under a new focus or approach, reaching innovative conclusions.
Subsequently, the case study was carried out, which according to Ventura (2007, p. 385):
Como qualquer pesquisa, o estudo de caso é geralmente organizado em torno de um pequeno número de questões que se referem ao como e ao porquê da investigação. É provável que questões como essas estimulem também o uso de experimentos e pesquisas históricas.
Yin (2001 apud GIL, 2002, p. 54), complementa que “[…] é encarado como o delineamento mais adequado para a investigação de um fenômeno contemporâneo dentro de seu contexto real, onde os limites entre o fenômeno e o contexto não são claramente percebidos”.
4. CASE STUDY
4.1 STUDY PLACE
The case study was carried out in an airline located in the city of Rio de Janeiro, with the objective of providing aeroviário transport services. The investigated company has more than 52 thousand employees, that is, it is a large company, composed of 310 aircraft, with 13.5 billion in gross revenue and which is currently considered the largest company in this segment in Brazil. The company offers flights to 150 destinations in 22 countries and domestic operations in six countries. Performing more than 1600 daily flights, serving around 5000 passengers a day.
The investigated company has some sectors and their respective activities, namely the Store, Check-in, Embarkation and Arrivals.
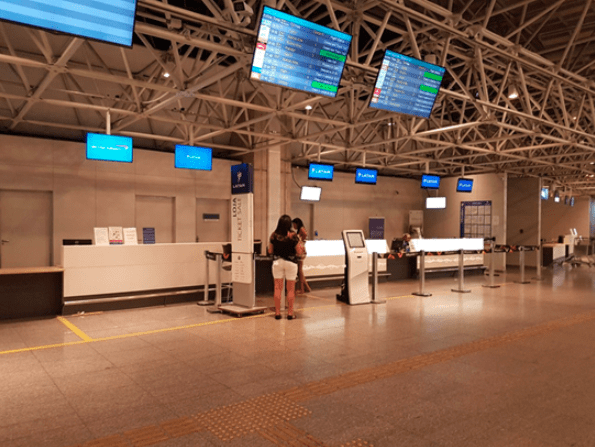
The Store is the sector responsible for carrying out the operational and commercial activities of the airport stores. Being responsible for the services of: ticket sales; ticket rebooking; charging for special services; provision of accommodation in case of flight cancellation or delay, etc.
Figure 2 – Store Service
Check-in is responsible for performing operational activities related to check-in, that is, it is the sector responsible for: checking the documentation; print the tickets for each passenger’s reservation; tag your luggage and check it on the carousel.
After the check-in service, passengers who finish the service can go to a tablet and evaluate the service received, classifying it between: good, fair or bad.
The Boarding sector is responsible for carrying out activities related to the boarding of passengers. These are: check PAX documents and tickets; tag luggage when necessary; make boarding calls; highlight boarding passes; check the total number of PAXs on board and monitor the closing of aircraft doors.
In the Arrivals sector, the employee is responsible for providing customer service with a focus on operational luggage activities, performing functions such as: assisting the customer who had their luggage lost or damaged.
4.2 PROBLEM TREATED IN THE CASE STUDY
The investigated company has a high rate of passenger complaints and a low level of customer satisfaction. In view of this, a case study was carried out to investigate the main causes of these problems and seek ways to solve them.
For the development of this study, data were collected through passenger complaints records between the months of July to September and October to November 2017. Aiming at greater focus on customer satisfaction and employee well-being, a target of 30% reduction in complaints.
4.3 STUDY DESCRIPTION
4.3.1 DEFINITION OF PDCA CYCLE STEPS
In step P of the PDCA Cycle, four tools were used: Check Sheet, Pareto Chart, Cause and Effect Diagram and Action Plan (5W2H), in order to develop an action plan to achieve the 30% reduction target of complaints;
In step D, the proposed Action Plan was executed;
In step C, a new Check Sheet was used in order to verify if the results of the previous step were achieved;
In step A, the measures that must be standardized were defined to maintain the good functioning of the proposed actions that were positive for the organization.
4.4 APPLICATION OF TOOLS
For the elaboration of the Action Plan, in the first stage of the PDCA Cycle, four tools were used. The first of these was the Verification Sheet, which, according to Werkema (2006), is “a form in which the items to be examined are already printed, with the objective of facilitating the collection and recording of data”.
The Check Sheet was prepared with the aim of collecting data for the preparation of the Pareto Chart, where it was possible to identify the problems that need more attention. Then, the Cause and Effect Diagram was prepared and, finally, the Action Plan.
Table 1 – Prepared Verification Sheet
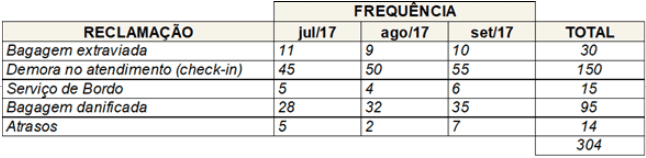
In the table above we can identify the problems and the frequency in which they occur. These data were used to assemble the Pareto Chart, where it was possible to visualize which are the problems where most complaints are concentrated, as shown in the chart below.
Chart 3 – Prepared Pareto Chart
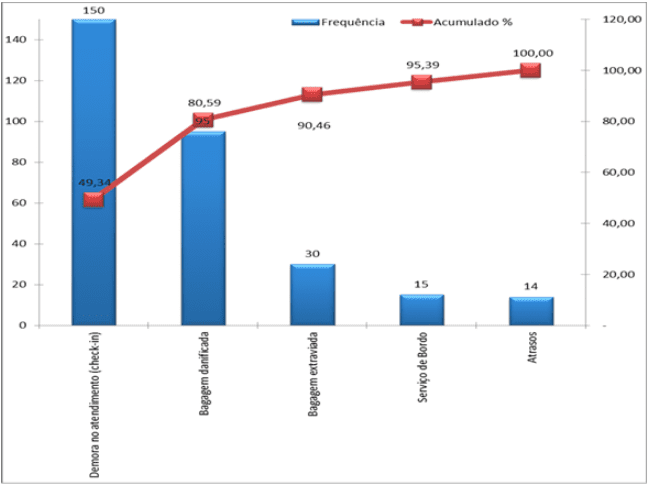
After analyzing the Pareto Chart, it was identified that the problems: Delay in service (check-in) and Damaged Baggage, represent 80.59% of all complaints registered in the period from July/2017 to September/2017.
Thus, it is known that by solving these problems, it will be possible to reduce about 80% of complaints. However, initially, only the biggest problem was addressed, which is the delay in the check-in service.
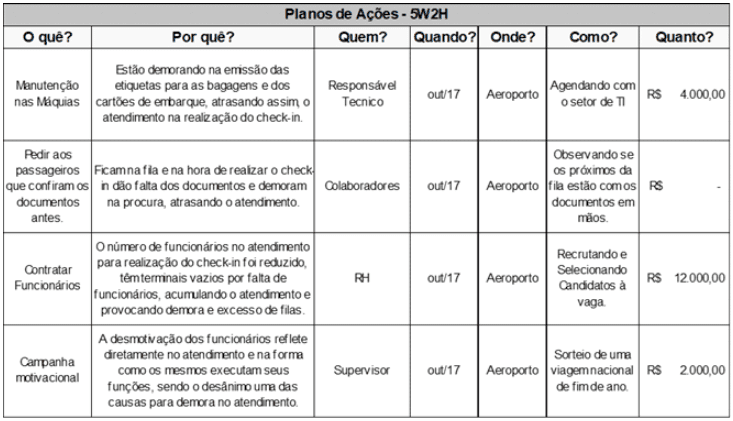
In view of this, some possible causes for this problem were raised and a Cause and Effect Diagram was elaborated. The identified causes, as well as possible solutions to them, will be presented through the Action Plan (5W2H), shown below:
Table 2 – Action plan (5W2H) prepared
In stage D of the PDCA Cycle, what was planned in the previous stage must be put into practice. Therefore, the execution of the actions proposed in the table above was initiated.
The results of this execution were monitored and checked in step C. For this, a new verification sheet was used, comprising the months of October and November 2017, as it was in this period that the repairs and changes in the team’s work methods took place .
With the data provided by the passenger complaints record in these two months (October and November 2017), a new Check Sheet was prepared, so that it was possible to see if the plans were executed correctly and if they reached the objective of reducing by 30% complaints regarding delay in service.
Table 3- Check Sheet – Step C
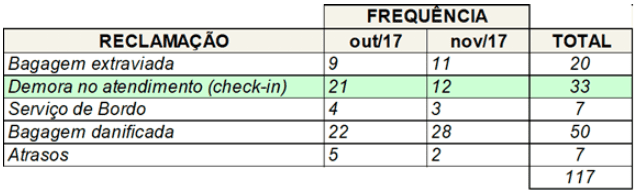
According to the data collected and shown in Table 1, the average number of complaints about delays in checking in at the airport was 50 per month. After the implementation of the proposed actions, as seen in the table above, this number was significantly reduced in the first month of changes, where there were 21 complaints, and even more in the second, where 12 complaints were registered, accounting for a 74% reduction.
Finally, in step A, the measures that must be standardized were defined to maintain the good functioning of the proposed actions that were positive for the organization.
5. RESULTS
The passenger service team during check-in and baggage dispatch achieved quick and efficient results in the execution of the planning.
As can be seen in tables 1 and 3, the number of complaints about the delay in checking in was reduced by more than half in the first month, with 55 complaints being collected in September and 21 in October. In November, the number of complaints decreased even more, with only 12 complaints being accounted for.
Therefore, it was found that the results achieved were higher than expected for the problem treated, characterizing an absolute and surprising success, as it was aimed at a reduction of 30% and, at the end of the study, the reduction of complaints was 74%.
However, even having registered a small drop in October, the problem of damaged luggage continues to receive the same frequency of complaints and should be the next problem to be addressed by the investigated company.
In this context, it is recommended that the organization’s managers return to Stage P of the PDCA Cycle, in order to seek the causes and verify the possibility of solving this and other problems, in particular that of damage to luggage. It is also a suggestion for the team that they meet weekly to verify the progress of the plans that are being executed, observing possible changes and the need for corrections.
6. FINAL CONSIDERATIONS
This article aims to demonstrate the application of the seven basic quality tools and the PDCA Cycle in the air service routine of some sectors of an airline located in the city of Rio de Janeiro, aiming at the continuous improvement of the organization and higher quality in services provided.
In this context, it is evident the importance of continuously improving the services and the attendance of any organization, mainly of the airlines that are the focus of this study, in a global way, so that the attendance has high quality.
The method presented for carrying out the proposed case study and achieving the research objectives was the PDCA Cycle (Plan, Execute, Check and Act) and the tools are the seven basic quality tools (Flow Chart, Check Sheet, Control, Pareto Analysis, Histogram, Cause and Effect Diagram and Scatter Diagram). By pointing out the steps to be followed, the PDCA Cycle provides means that assist in the identification, prioritization and search for the solution of problems, in addition to assisting in the standardization of processes. For each stage of the PDCA, steps were determined to be followed and some tools used to assist in its execution and continuous improvement of the organization and greater quality in the services provided.
In the literature review carried out in this article, the steps of the PDCA Cycle were presented where the seven basic quality tools can be applied, describing them in detail, in order to demonstrate their applications. We also present the steps that must be followed and some examples in order to facilitate its use. The method and tools discussed are simple and can be used by anyone in the organization, thus enabling the culture of continuous improvement to be implemented at all organizational and operational levels.
Despite the simplicity, these methods are efficient and allow the organization to achieve good results, as verified in the case study carried out. Therefore, after conceptualizing the seven basic quality tools, the company where the study was carried out was presented and the case described. Although the seven tools were not applied, the study showed that they can be useful in managing the improvement, with a significant reduction in complaints being identified for the problem presented.
Finally, returning to the guiding question, which aimed to answer whether the seven basic quality tools and the PDCA Cycle can be applied in the aeroviário routine, it was found that its application and obtaining great results is possible in all organizations. In addition, the results of the case study carried out in the investigated company show a significant improvement in performance, well above the established goal.
BIBLIOGRAPHIC REFERENCES
ABRANTES, José. Fazer monografia é moleza: o passo a passo de um trabalho científico. 2. ed. Rio de Janeiro: Wak, 2008.
ALENCAR, Joana França de. Utilização do Ciclo PDCA para Análise de Não conformidades em um Processo Logístico. Monografia (Curso de Engenharia de Produção), Juiz de Fora: Universidade Federal de Juiz de Fora, 2008. Disponível em: https://www.ufjf.br/ep/files/2014/07/2008_3_Joana.pdf. Acesso em: 27/11/2017.
ALVES, Vanessa de Castro. A utilização das ferramentas de qualidade para eficiência das organizações. Monografia (Pós-graduação em Administração de Qualidade). Rio de Janeiro: Universidade Candido Mendes, 2012. Disponível em: <http://www.avm.edu.br/docpdf/monografias_publicadas/K221407.pdf>. Acesso em: 27/11/2017.
BEZERRA, Felipe. Ciclo PDCA – conceito e aplicação (guia geral). 2017. Disponível em: <http://wiki.samae.com.br/images/1/16/Ciclo_PDCA_-_Conceito_e_Aplicacao.pdf.> Acesso em: 27/11/2017.
CENTRO DE ENGENHARIA DA QUALIDADE. Histograma. 2016. Disponível em: <http://cqequalidade.blogspot.com/2016/05/histograma.html>. Acesso em: 27/11/2017.
DALFOVO, Michael Samir; LANA, Rogério Adilson; SILVEIRA, Amélia. Métodos quantitativos e qualitativos: um resgate teórico. Revista Interdisciplinar Científica Aplicada, v.2, n.4, p.01- 13, Sem II. ISSN 1980-7031. Blumenau-SC, 2008.
FERREIRA, Alan Reis Damaceno. Melhoria contínua: importância e aplicação no processo produtivo de uma indústria de refrigerantes. TCC (Graduação em Engenharia de Alimentos). Cuiabá: Instituto Federal de Educação Ciência e Tecnologia de Mato Grosso, 2015. 29 f.
FIGUEIREDO, Leila; SATOSHI, Celso; ALVES, Uitan. As ferramentas da qualidade integradas ao método de solução de problemas para a melhoria dos processos de uma linha de produção de uma fábrica de produtos elétricos. XXXIV Encontro Nacional de Engenharia de Produção. Engenharia de Produção, Infraestrutura e Desenvolvimento Sustentável: a Agenda Brasil+10. Curitiba, PR, Brasil, 07 a 10 de outubro de 2014. Disponível em: <http://www.abepro.org.br/biblioteca/enegep2014_TN_STO_196_109_25362.pdf>. Acesso em: 27/11/2017.
GIL, Antonio Carlos. Como elaborar projetos de pesquisa. 4. ed. – São Paulo: Atlas, 2002.
IMAI, Masaaki. Gemba Kaizen. 6. ed. São Paulo: Instituto IMAM, 2005.
MACHADO, José Fernando. Método Estatístico: Gestão da qualidade para melhoria contínua. São Paulo: Saraiva, 2010.
MAGALHÃES, Juliano. As 7 ferramentas da qualidade. 2017. Disponível em: <https://siseb.sp.gov.br/arqs/9%20-%207_ferramentas_qualidade.pdf>. Acesso em: 27/11/2017.
MARCONDES, José Sérgio. Ferramentas da Qualidade: O que é? Conceitos e Modelos. 2016. Disponível em: <https://gestaodesegurancaprivada.com.br/ferramentas-da-qualidade-conceito-e-modelos/#:~:text=As%20ferramentas%20da%20qualidade%20s%C3%A3o%20t%C3%A9cnicas%20administrativas%20utilizadas%20com%20a,bom%20desempenho%20dos%20processos%20organizacionais>. Acesso em: 27/11/2017.
MARCONI, Maria de Andrade; LAKATOS, Eva Maria. Técnicas de pesquisa: planejamento e execução de pesquisas, amostragens e técnicas de pesquisas, elaboração e interpretação de dados. 3.ed. São Paulo: Atlas, 1996.
MINAYO, Maria Cecília de Souza. O desafio da pesquisa social. In: DESLANDES, Suely Ferreira; GOMES, Romeu; MINAYO, Maria Cecília de Souza (Org.). Pesquisa social: teoria, método e criatividade. 28. ed. Petrópolis, RJ: Vozes, 2009. p. 9-29.
OLIVEIRA, Cassiana de. Trabalho em Aeroportos. Revista Proteção, São Paulo, n. 38, abr./2008, p. 38-53.
PEREIRA, Eveline. Histograma. 2017. Disponível em: <http://static.sapucaia.ifsul.edu.br/professores/eveline/EST.%20QUAL.%20-%20T%C3%89C.%20PL%C3%81ST/2%C2%B0Sem/8%20Histograma.pdf>. Acesso em: 27/11/2017.
PMKB. Construção e montagem: histograma de recursos. Publicado em: 03/11/2014. Disponível em: <https://pmkb.com.br/artigos/construcao-e-montagem-histograma-de-recursos/>. Acesso em: 27/11/2017.
RIBEIRO, Karina. Excelência no Atendimento ao Público: um diferencial competitivo. Action Treinamentos. Publicado em: 11/11/2012. Disponível em: <https://administradores.com.br/artigos/excelencia-no-atendimento-ao-publico-um-diferencial-competitivo>. Acesso em: 27/11/2017.
TOLEDO; José Carlos de. Melhoria da Qualidade e MASP. 2017. Disponível em: <https://edisciplinas.usp.br/pluginfile.php/4564975/mod_resource/content/1/Apostila%20MELHORIA%20da%20Q%20e%20MASP%20-%20220808.pdf>. Acesso em: 27/11/2017.
VENTURA, Magda Maria. O Estudo de Caso como Modalidade de Pesquisa. Rev. SOCERJ. 2007;20(5):383-386 setembro/outubro. Pedagogia Médica. Universidade Estácio de Sá – Rio de Janeiro, 2007.
VERGARA, Sylvia C. Projetos e relatórios de pesquisa em administração. 3.ed. Rio de Janeiro: Atlas, 2000.
WERKEMA, Maria Cristina Catarino. As Ferramentas da Qualidade no Gerenciamento de Processos. Belo Horizonte: Editora de Desenvolvimento Gerencial, 1995.
WERKEMA, Maria Cristina Catarino. Ferramentas estatísticas básicas para o gerenciamento de processos. 1. ed. Belo Horizonte: Werkema Editora Ltda, 2006.
APPENDIX – FOOTNOTE
2. An aeroviário is a worker who, not being an aeronaut, performs a remunerated role in the land services of an Air Transport Company.
[1] Postgraduate in Quality Engineering.
Submitted: January, 2022.
Approved: April, 2022.