LOSILLA, Fabrício Aparecido Cano [2]
VALENTE, Carlos Magno de Oliveira [3]
LOSILLA, Fabrício Aparecido Cano; VALENTE, Carlos Magno de Oliveira. Inventory Management System Analysis Through ABC Curve and Cyclical Inventory: Case Study in an Industry in the Automotive Sector. Multidisciplinary Scientific Journal. Edition 08. Year 02, Vol. 03. pp 05-17, November 2017. ISSN:2448-0959
abstract
This research aims to present the implementation of the cyclic count and curve ABC in inventory control in an industry in the automotive sector showing the evolution of routine activities to improve inventory management. This is an exploratory work, using documentary history and working instructions of the department responsible, having as a research technique a case study. The greatest difficulty faced is related to the company's resistance to change and culture. On the other hand, the excellence in the improvement of the activities carried out to control and manage the inventory generated an improvement in the communication of managers and operators, as well as in the interaction between departments. In a way, it can be considered that the tools act in the cultural and organizational aspect of the company. The results of this implementation are linked to the strategic objectives of the company, which in this case, is to monitor the growth demand improving internal processes, therefore, the study provided knowledge of the effects of the implementation of an improvement tool incorporated into the work routine, as well as the repercussion of the benefits that the cyclic count and ABC curve contribute to the company that applies it, bringing excellence in process management, organizational culture and, in this case, inventory management.
Keywords: Cyclic Counting, Inventory Management, ABC Curve, Improvement, Inventory Control.
1. INTRODUCTION
Intense competition and impressive technological advances have required managers to quickly develop and implement short-term tools and strategies, taking responsibility for maximizing profits and minimizing costs by balancing these factors for organizational growth. Therefore, based on this context, the organizations are seeking to improve their techniques with the objective of a more efficient management, generating in addition to reducing costs and meeting the demand, planning, being able to reduce the uncertainties of the market, economy and of customers (VIEIRA et. al. 2016).
Inventory management, for Vieira et. al (2016), seeks, by means of planning, control and organization of the stocked goods, potentiate their capacity to meet the needs of the demand, aiming to adjust their inventory levels and also the costs involved, with the purpose of making investments in necessary items to the efficiency of the activities developed by the company.
For Silva and Boff (2013), companies must stick to inventory control in a thorough manner, verifying through internal control procedures, acting effectively and allowing the irregularities to be detected. According to Arnold (1999), there are two types of checks to detect these irregularities found within the companies considered basic, such as periodic inventory counts, generally performed annually and cyclical inventory counts, performed in daily item selection.
For Drohomeretski and Souza (2012), reliability in inventory information is essential for the correct sizing of inventory activities and planning. As a result, organizations are investing in making information more accurate and error-proof, reducing information errors not only in equipment and technology, but also in people. For this verification, companies usually use methods to control physical inventories, the practice to be used depends on the processes and the particularities of each segment of the organization identifying important points such as: type of stock material and its importance.
According to Silva, Mateus and Silva (2016) an efficiently managed stock is a dilemma for medium and large organizations, ie, avoiding material loss, buying the right amount so that there is no shortage are challenges for those in charge of this inventory control management , material handling, shipping and distribution.
In order for the company to be able to apply tools inside for inventory management, involving processes, it is necessary to overcome some adverse situations within each sector. That second, Thompson Junior, Strickland III and Gamble (2008), some difficulties are encountered by organizations to apply tools such as activities designated to departments that are not competent to develop or even the responsible of the sector does not help in the performance and development of these activities .
This work has as an application environment an industry in the medium-sized automotive sector, having as critical points within the control of inventories: the time spent to manage the materials that were already stored and the inventory conference with terms of 1 (one) year , generating delay in the replacement of materials and attendance to demand. To end these critical critics were implemented the tools cited, that is, daily cyclical inventory and ABC curve, resulting in greater control of stock materials and reliability in the systemic and physical inventory.
Given the above, the question to be answered in this research is: what changes from the ABC curve application and periodic inventories for stock control in an industry in the automotive sector?
Campos (2008), emphasizes that it is extremely important to periodically count inventories to identify the causes of probable errors. The origin of discrepancies found in the inventories is based on defects in material handling, loss, deterioration and theft, generating information mismatch with the company's system, and it is necessary to align this information in the periodic counts to ensure accuracy when it occurs the inventory.
The objective of this study is to apply the use of the Cyclic Inventory and the ABC Curve in an automotive industry in the interior of São Paulo, in order to classify the items of the stock according to their consumption, knowing their costs and sales and then suggest investments based on the forecast of these demands and the classification of items A, B and C.
Therefore, aiming at expanding knowledge about strategic and operational management, the research aims to expose the study of the implementation of the ABC curve and periodic inventories in stock control in an industry in the automotive sector with the objective of presenting the evolution of activities developed for improvement and control of inventory management. It is an exploratory work, using historical documentary manuals and work instructions, having as main technique the investigation on the case study.
2. LITERATURE REVIEW
In this section, the theoretical framework will be presented, aiming to provide a basis for the present study, so it will be divided into the following points: inventory management, inventory types and ABC curve.
2.1 Inventory Management
Manage stock, according to Vieira et. al (2016), requires actions directed at the organization related to quantity, timing and costs. Briefly, inventory management is an activity that requires planning and control of the accumulation of the usual resources through the supply, operations and process networks. Inventories should be periodically updated to avoid problems arising from sales growth and replacement time changes. Effective inventory management should design adequate levels to maintain a balance between inventory and consumption.
2.2 Types of Inventory
For Campos (2008) the inventory is defined as the periodic count of the existing materials for comparison with the inventories registered by the company, in order to prove its existence and accuracy with the information contained in its internal control.
Cycle counting, according to Drohomeretski and Souza (2010), is a procedure that aims to count all the inventory items at predefined dates and with items already defined, using a tool, for example, ABC classification as a parameter for their achievement. This type of counting is considered a continuous count of the items, where the dates for these will be defined in advance, and may be monthly, weekly or daily. The purpose of this count is to motivate employees to minimize errors in inventory records and identify them to correct them as soon as possible.
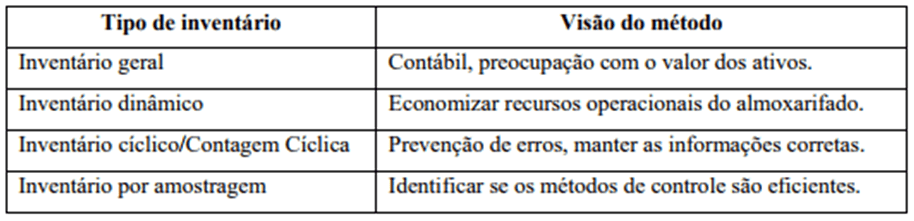
For Drohomeretski and Souza (2012) there are different methods of elaborating inventories, each one suitable for its purpose and necessity, so the first step is to know and define the best method to be applied. As already detailed physical inventory is the process of counting inventory items, they can occur once a year, or several times, depending on the management policy adopted, some vision definitions for each type of inventory are:
The cyclic count, the focus of the case study carried out, is done continuously, usually being defined dates, are usually used as standard selection of the items their popularity, or the definition of the ABC curve tool, for division of items.
2.3 ABC curve
Efficient inventory management represents a dilemma experienced by large and medium-sized companies. For Silva, Mateus e Silva (2016) to avoid the loss of materials, to buy the exact quantity so that it is not lacking, is considered a challenge, as they are responsible for inventory control, material handling, shipping and distribution. And so that we can have an effective control, we make use of administrative tools like the ABC curve, this tool classifies the materials of greater cost and movement indicates by the letter A medium cost and average movement and at last low cost and low movement.
The ABC curve is a method of classification of information in which it separates the items of greater importance, which are usually in smaller numbers, according to Godeiro et. al (2016) the ABC classification or Pareto curve is considered a method of differentiating the stocks according to their greater or lesser extent in relation to the determination of the factor, constituting in separating items by classes according to their importance.
Godeiro (2016) further defines that in the ABC method, class A items are high priority stocks, so they deserve more attention from the materials manager. It is estimated that around 20% of the variety of the items in stock correspond to 80% of the total value of the same. Class B items are considered economically valuable and receive moderate care. For classification B, it is estimated that 30% of the variety of items in stock corresponds to 15% of the value in stock. Class C items are not insignificant, because their lack may impede the continuity of processes, however, the classification criterion establishes that their economic impact is not dramatic, resulting in less managerial efforts. It is estimated that 50% of the items in stock correspond to 5% of the value in stock.
For Drohomeretski and Souza (2012) after defining the classification criterion to be used, it is necessary to establish the quantity of items to be counted and how often to perform the counts, so it is necessary to draw up a plan of score. To understand how this counting plane works, Figure 2 represents an example:

The ABC curve, as mentioned in the example above, is a tool that acts on inventory management and is very usual within cyclical counts, so for Vieira et. (2016), the ABC curve allows the stock manager to control its level according to the consumption of the items, making it possible to make decisions related to the issues such as: what, what and when to buy. Making investments free of probable risks, this being the intention of companies that aim to reduce costs and increase profits.
3. RESEARCH METHODOLOGY
As to the nature of this work, it can be characterized as a case study applied with the purpose of generating knowledge in the practical application of the topic to which it was proposed.
The study has as characteristic the use of methods of qualitative and interpretative research, with the aim of collecting information based on the reality of the studied company.
Thus, this study is classified as qualitative, making use of the bibliographic medium, to consolidate the information and knowledge required by books and articles even if they have already been explored, can still bring a new vision and knowledge about the researched topic. Another method also used is the case study, which consists of the analysis of the real conditions, with the purpose of bringing problems of everyday reality related to the theory and its possible solutions to the topics addressed.
Thus, a solution proposition is sought using the theory discussed here and the practice of the studied company, carrying out the collection of information in the field of study, about the inventory of an industry in the automobile sector, analyzing the management of this stock, and influence the inventory turnover and its optimization in order to increase its efficiency.
During the study, through data collection, the techniques of observation and data collection with the team involved in the process and their leaders were used during the study, through the qualitative approach of the information relevant to the study. The monitoring took place during the months of implementation of the ABC method, from the analysis of the project to the total implantation of the new counting system. A case study was made to obtain information to understand and study the main problems that occur in the matter of inventory movements.
A spreadsheet was used to control and observe the collected data, besides a physical inventory, to know the level of accuracy of the pieces in stock.
The following criteria were used to collect data:
- Follow-up of daily activities;
- Evaluation of inventory reports;
- Observations evidenced in the processes.
The analyzes used data obtained through company documents, records in archives and databases, considering that the author of this study is an active member and participant of the change in Inventory Management, being one of the responsible for the results obtained through the application of these methodologies.
The ABC curve was also developed to investigate the items that deserve more attention in its control. Next, the ruptures / faults by region of the ABC curve were analyzed in order to verify their impacts.
Data collection was obtained, therefore, by content analysis, and was carried out during the exploratory and documentary research. For the data collection, the materials used by the studied company were used, these being the indicators, produced by the collection of information in the physical and systemic count of the stock.
The data analysis also provided a comparison between the inventory accuracy indexes, from the period before the cyclic count implantation, to the index resulting from the counts after the cyclic counting.
Data Collection Instrument
- Direct observation
- Item count records
Data Analysis Tool
- Verification of change of accuracy indicators
- Verification of actions taken in the face of disagreements
Given the above, the solution in which it presented short-term results and generated organization in the physical and systemic inventory, was the application of cyclic inventories accompanied by ABC curve.
4. ANALYSIS OF DATA AND RESULTS
In this section the description of the case study will be presented, starting from the company description and its particularities in its inventory management, the management, control and inventory forms used prior to the implementation of the cyclic material count.
The company in which the study was destined has approximately 210 employees considered of great size, in the industrial segment of auto parts being located in the interior of São Paulo, serving in large part of Brazil in the metallurgical sector in the production of clutches. It has predominantly hierarchical traits and keeps large stock of products to meet the demand that tends to grow. For reasons of confidentiality the data will be proportional to the actual data and the company name will not be disclosed
Therefore, it was sought to evaluate the management conditions to attend to this growing volume. It was concluded that the management and control of inventories and internal procedures for inventory flow were generating problems, even if they were considered "common" but harmful, leading to delays in the replacement of certain items and subsequent delays in production, for that, it was possible to analyze that, the annual inventories were not behaving the turn of inventory of the current circulation of materials.
The planning of materials and the delay and stop of the factory and labor to make annual inventories made difficult the correction of the materials that were in disagreement with system, generating delays in the production and the solution of items in disagreement. And keeping the physical and systemic inventory within a standard requires that they be checked frequently.
For the company, the stock has the objective of supplying with materials all the processes that exist from spare parts for machinery (bolts, tools) to materials for production (clutches and their components). These materials are destined to all the processes of the factory environment, occurring what can be called simultaneous service, without the occurrence of requests or requests made in advance. This fact makes inventory management more complex, since any lack of material interrupts production and automatically the delivery of the final product.
Inventory management is carried out by means of a computerized system in which it controls the entire company, compiling its information for general planning and control management. This system therefore integrates all sectors of the organization.
The company works with an intense flow of demand and production services to supply it. The materials are stored in pallets and open cupboards, where the equipment is labeled and properly identified for better management. As shown in figure 3.

The counting method used was inefficient. The general inventory was carried out annually, and these counts were normally made in December and prepared for future audits.
A count was performed to verify the physical balance, where the data collected were compared with a systemic balance report, and after comparing the information the adjustments were made in the system of the company in which it is being studied.
Due to the percentage of information difference: Systemic vs. Physical, the situation had an impact on the level of service and costs of the company, and it was necessary to elaborate a plan for the implementation of the cyclic count of materials along with the ABC curve for material classification.
After acceptance of the inventory methodology among the participants, there was resistance regarding the dates for the counts, considering that it was defined, by the number of materials that moved per day, that the counts would be performed daily, having to intercalate with the routine functions . In this way, the following criteria were defined for performing the cyclic counts:
a) The counts would be made every day, according to daily agenda, and also with the reconciliation of the routine functions of the sector;
b) All the items were for initial counting, being later classified by the ABC curve;
The criteria used to carry out the counts were adapted to suit the particularities of the company, which is the best way to carry out the counts, and applied to all items of inventory.
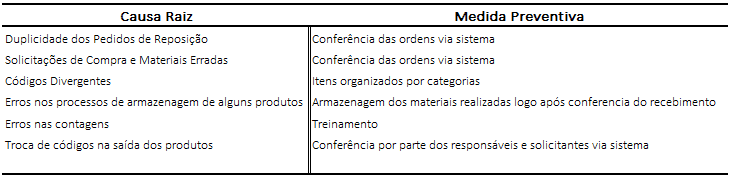
With the implementation of the cyclical count in 2014, it was possible to identify the causes were generating the divergences of inventory, some main causes identified:
- Duplication of replacement requests;
- Wrong Purchase Orders and Materials;
- Divergent codes;
- Errors in the storage processes of some products;
- Errors in counts, system was one value and the other physical;
- Exchanging codes on the output of products.
- 100% Conference of material inputs
After identifying the main causes, corrective measures and standardization of activities were applied so that errors could be reduced.
Figure 4 shows the procedures adopted for the causes of identified stock divergences.
The accuracy according to Drohomeretski and Souza (2012) can be defined as the relationship between the balances indicated by the system adopted by the company, and the actual physical balance of the products stocked, where the systems can be from advanced like ERP or control of chips.
The equation for measuring the accuracy data is:
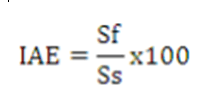
At where:
IAE: Inventory Accuracy Index;
Sf: Balances verified by counting (physical);
Ss: Balances verified through the company's management system.
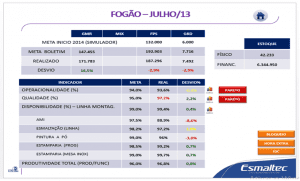
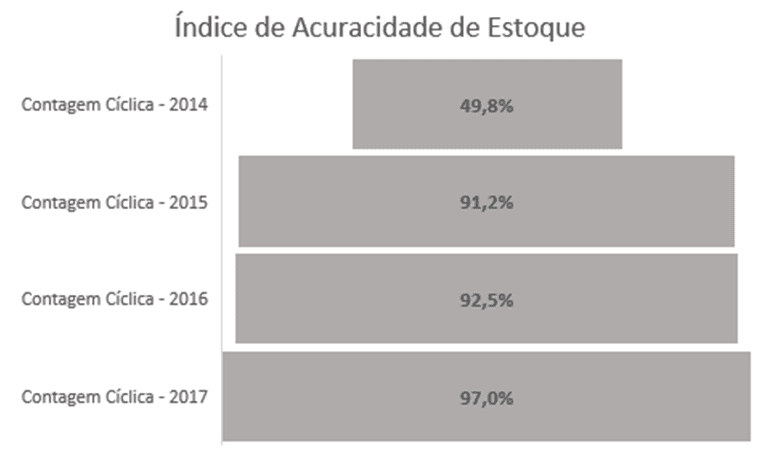
The previous method of annual inventory of material counts was inefficient for market demand, since the presented data indicated low accuracy, considering the inventory from the year 2014 presented the indices presented in figure 5.
The clear and progressive improvement of this indicator is due to the fact of the implementation of the cyclical inventory, and also by other controls adopted, such as:
- Control 100% of the inputs and outputs of materials
- Monitoring divergences of receipt
- Reduced inventory
Thus, it is possible to analyze that the application of the cyclical inventory generated changes in Inventory Management, but the method only became essential for these values to rise along the areas of support and commitment of the team responsible for material management.
Figure 5 is a representation to measure how much this tool applied along with other tools of inventory management have been efficient throughout its application, contributing financially, to improve the culture of the company that applies it.
In view of the representation it is possible to identify that the continuous progress of the tool, knowing that the objective is always to aim for the unanimity of the information, that is, 100% accuracy. In this way, Figure 6 depicts the growing and objective of the company that applies it being reached:
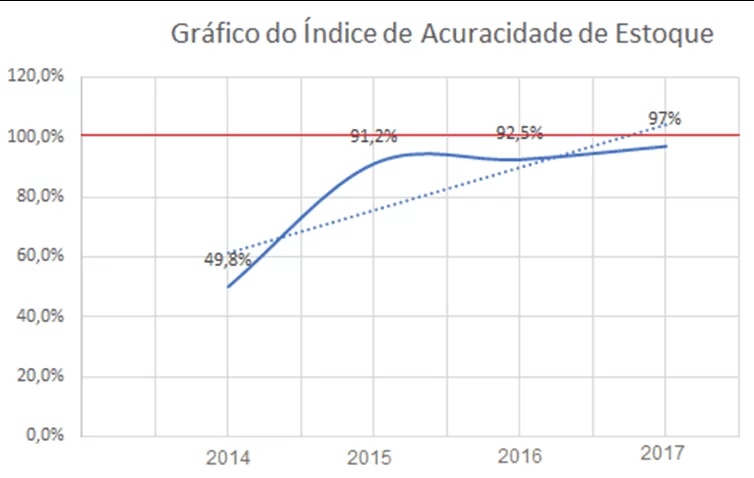
The graph depicted in figure 6 shows:
- in the red line: the goal to be reached for inventory accuracy;
- in the blue line: the evolution of accuracy over the years, after the implementation of the tools;
- in the dotted line: the increase in which is the evolution of the applied tools, and how close it is to the final objective.
It is possible to observe that after the implementation of the cyclic counts and application of the ABC curve the percentage of accuracy has increased, meaning that the systemic and physical values are closer, resulting in better results both for production and manufacturing of automobile parts and for the service of demand.
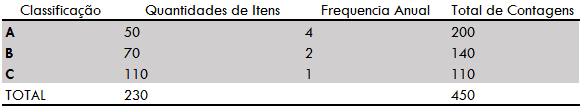
In the company studied, the items classified A are counted 4 times a year; the B items are counted twice a year and the C items are counted once a year, to better visualize the figure 7 it counts the counts:
This improvement brought several benefits for the industry and for the company, because with this achievement problems such as lack of materials and non-fulfillment of orders were reduced, as well as the organization in receiving and conferring in the receipt and control of storage of these materials, beyond this point, the company's interest is to maintain or increase the percentage, greater than 97% in the accuracy of the year 2018 onwards, and thus reduce costs with the divergences of balances and the benefits arising from such changes, as the change in the culture of the company.
CONCLUSIONS
The results of this case study allow us to evaluate the development of the impact of cyclical counting for stock control in a large manufacturer in the automobile parts manufacturing segment, in view of the implementation of inventory management tools. According to the last section it is possible to identify the possibility of implanting tools such as cyclic counting and ABC curve related to the life cycle of the company's materials.
The cyclic counting of materials along with the application of the ABC curve should be directly linked to the strategic objectives of the company, which in this case is to monitor the growth of demand, improving the internal processes so that the excellence of the final product begins in the planning and administrative process , being implanted in a consistent and embedded way, adds value to the company and consequently to the goals initially set.
The results obtained with the implementation of cyclic counting are mainly due to the process of identifying the causes of stock divergence within the organization, showing the benefits of the cyclic counting implementation, demonstrating the importance of implementing preventive measures to address the causes of errors . This can be verified in the case studied by pointing out the improvement in the percentage of accuracy, a result achieved with the measures adopted so that the errors did not re-occur again.
The increase in the percentage of accuracy was satisfactory, on the data presented in the inventory of September 2017. In other words, it changed from an accuracy index of 49.5% to 97%, showing that cyclic counting is an important method for improving inventory accuracy, since this measure can increase the reliability of stock balances, for in this case on a daily basis, making those involved in the processes become specialists in combating the causes of stock differences.
This case study provided the knowledge of the problems and benefits that the quality tools in inventories can contribute to the company that incorporates it, bringing excellence in management and culture, and in this case, Inventory Management. The results can be inspiration for improvement and constant evolution within companies. Deepening the process steps and studying varied solutions to improve and make processes more efficient and efficient, the organization provides time savings, internal organization and more and more interaction between the sectors, their managers and the board, making everyone work together always focusing on the same goal.
REFERENCES
ARNOLD, J. R. Tony. Materials management. São Paulo: Atlas, 1999
CREMONEZI, G. O. G. Basic Administration. 1st Edition, Campo Grande: Editora Life, 2015.
DROHOMERETSKI, E; SOUZA, J. A. Inventory Control: The Contribution of the Cyclic Materials Count in a Dentistry Institute. Industrial Management Journal. V.08, n.02: p, 98-113. Paraná, 2012.
GODEIRO, D. P. O .; PIRES, L. D .; DAMASCENA, F. R. O .; NASCIMENTO, R. S. S .; TRES, G. S. Inventory Management: The Case of a Medication Distributor. XXXVI National Meeting of Production Engineering. Paraíba, 2016.
LIMA, C. L. C .; REZENDE, A. C. T .; TORRES JUNIOR, H. M. Industrial Reorganization: Study of Cado in a Faction of Fitness Clothes. XXXVI National Meeting of Production Engineering. Paraíba, 2016.
SANTANA, A. F. L .; ALVES, C.F. BPMG – A Conceptual Model for Governance in BPM – Application in a Public Organization. Brazilian Journal of Information Systems. Rio de Janeiro, Vol. 9 nº 1. Pages 139-167, 2016. Available at: <http://seer.unirio.br/index.php/isys/article/view/5318/5042> Accessed on Aug 21. 2017.
SILVA, L. A; BOFF, C.D.S. Internal Controls of Inventories in a Metallurgical Industry of Caxias do Sul. Anais VII FSG Seminar on Scientific Initiation of Accounting Sciences. V.4, N.2. Rio Grande do Sul, 2013.
SILVIA, G. K.C.B; MATEUS, E.S; SILVA, S. L. G. Analysis of Inventory Systems by means of ABC Curve Analysis and Stock Turn: A Case Study in a Public Hospital Organization. XXXVI National Meeting of Production Engineering. Annals. Paraíba, 2016.
THOMPSON JUNIOR, A .; STRICKLAND III, J .; GAMBLE, J. E. Strategic Management. 15th Edition. Porto Alegre: AMGH Editora Ltda., 2008.
VIEIRA, M. G. C. S .; PIRES, A. V. S .; LIMA, A. C .; ARAÚJO, E. A. N .; FERREIRA FILHO, H. R. Joint Application of Stock Management Tools: ABC Curve and Sales Forecast at a Motorcycle Parts Resale Company of the City of Marabá. XXIII Symposium of Production Engineering – SIMPEP. São Paulo, 2016.
[1] Course Conclusion Paper, University of Araraquara, 2017.
[2] University of Araraquara (UNIARA)
[3] PhD in Mechatronics Engineering