ORIGINAL ARTICLE
CARDOSO, Elano [1]
CARDOSO, Elano. The stock sizing Just in time: A practical application of the Kanban tool. Revista Científica Multidisciplinar Núcleo do Conhecimento. 04 year, Ed. 05, Vol. 09, pp. 66-90 may 2019. ISSN: 2448-0959.
SUMMARY
In companies, stocks may be associated with cost-generating factors, intrinsic due to their maintenance, due to their lack of capital, and mainly by hiding the inefficiencies of the production process. In view of these aspects of relevance regarding inventories, this work aims to present the main theoretical concepts about the mathematical models available in the literature about the sizing of the Kanban. For the development of this work, a bibliographic-descriptive research was carried out, with both quantitative and qualitative approaches. Adopting a case study in the steel sheet stamping sector of a large company in the electrical appliances sector, such as descriptive research. Through the analysis of the results after a few weeks of implementation, there was a reduction in the inventory levels in the order of 16% and a reduction in the standings of the stoves factory due to lack of stamped parts, in the order of 3%. Therefore, it was possible to immediately observe the positive results of the implementation of the Kanban.
Keywords: Productive inefficiencies, Kanban, mathematical models, factory standings.
1. INTRODUCTION
In companies, stocks may be associated with cost-generating factors, intrinsic due to their maintenance, because of their lack, for paralyze the production process, due to excess of fixed capital and mainly by conceding the inefficiencies of the process Productive. These costs are unnecessary and do not add value to the final product from the point of view of the consumer, so a good management of materials should minimize the total capital invested in stocks. On the other hand, high inventory levels represent a protection for processes that are delegate, thus absorbing inefficiencies such as: no machine reliability, uncontrolled scrap rates, high setup times, and cycle times the disstandardized.
It is worth noting that in addition to demanding high costs, and hiding inefficiencies, maintaining inventory also represents a high risk of deterioration and losses due to obsolescence. In this way, determining the optimal quantity of items in stock is essential, thus promoting the reconciliation between supply and real demand, and in this case the value of the stock becomes unquestionable.
Given this aspect of relevance on the ideal levels of inventory, the case study of this work researched in the available literature three ways to calculate the size of the stock, considering the concepts of the methodology just in time, through the implementation of Kanban tool. In the second stage, real data from the company’s inventory levels were collected, to finally conceive a proposal for sizing the Kanban that generated a reduction of inventory in process and it was still possible to minimize the stoplines of the line of Assembly of stoves for lack of stamped parts.
2. EMERGENCE OF THE KANBAN MODEL
The Kanban was developed in Japan, in the decade of 60 in the Toyota Motor Company (Toyota), which sought an administration system that could coordinate the production of vehicles with the specific demand of different models and colors with minimum delay, making Simple and fast programming, control and monitoring activities of batch production systems.
Taiichi Ohno, at the time vice president of Toyota, believed that the mass production system was efficient in reducing unit costs of manufactured products, but in its view, the mass production system created a waste based on the system itself, Due to excess production. He thought the system was poorly equipped for periods of low growth, such as the oil crisis period, in the 70 decade. His theory says that everything that exists beyond the minimum required quantity of materials, parts, equipment and workers, to make a certain good or service, is considered a loss.
Then, on one of his travels to the United States of America, Taiichi Ohno observed the methodology used in the inventory management of American supermarkets, since they were considered highly efficient. According to Shingo (2002, p. 212) The supermarkets have several particular characteristics that could be adapted to the factory floor, then emerging Kanban, and they are:
- Consumers directly choose the goods and buy their favorites;
- Employees ‘ work is lower, as consumers themselves carry their purchases to cash registers;
- Instead of using an estimated refueling system, the establishment resets only what was sold, thus reducing inventories;
- Items 2 and 3 allow you to download prices; Sales rise and profits grow.
2.1 KANBAN SETTING
“Kanban is the Japanese word for card or sign. It is sometimes called an invisible belt that controls the transfer of material from one stage to another of the Operation “(SLACK, 2002, p. 494).
Second teaches Pace (2003, p. 7) the literal translation of the word Kanban is: visible record or visible plate. However, by interpreting the word according to its use, it can be affirmed that Kanban means card, which does not mean that it cannot assume the meaning of any other signal. These cards authorize the movement of the product between the producer Centre and the Consumer Centre, and also order the producer plant to produce a certain amount of product at a given time.
Smalley (2004, p. 107) defines Kanban as a system that combines control over material movement, geared toward both time and quantity, depending on the signals given by the flow process below. Thus, Kanban controls the production of a value, material, and information flow. In other words, you can define it as a flag device that provides instructions for the production and inventory control, regulating the movement of materials, and considering that the quantity of the production and timing of its realization should be Market demand.
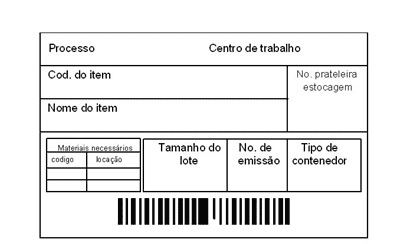
Traditionally, within a factory, the Kanban is a simple paper card, which must contain basic information such as the name of the part, its number, the supplier (internal or external), the quantity of part per container, the address of its supermarket and, in Certain times, a barcode may be printed, as shown in Figure 1.
Figure 01 – Kanban card.
To operationalize these cards, panels or signboards called the Kanban board are used. These tables are posted close to the place of storage for the purpose of signaling the movement of consumption of the items fixed in the table.
These storage points are called item supermarkets, as a result of the historical origin of the Kanban being associated with the Japanese adaptation of the replacement systems of existing products, at the time of its creation, in the American supermarkets (TUBINO, 1997, p. 200).
Currently, the Kanban tool is strongly associated with the phrase “pull”, which in simple terms means that an initial process should not produce a good or a service without the customer of a subsequent process requesting it. Although this rule is simple, in practice you can move away from the intended.
Figure 02 – pushed programming vs. pulled programming.
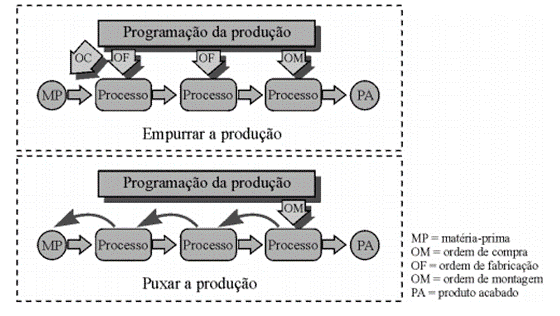
The main feature of this system, which makes it differ from the traditional control system, is that through it the production of a sector is pulled by the next sector, instead of being pushed by manufacturing orders. That is, the producer center only produces when the consumer center needs it. Traditionally, manufacturing orders are replaced by cards, hence the origin of the system name.
However, although it seems ideal to have a production system 100% pulled, without stocks, totally on demand, there is the need to maintain a minimum quantity, given that, within a factory floor the variables are many, as for example, the breakdown of Machines, quality problems, delays from suppliers and others. For this unpredictability Smalley (2004, p. 14) certisurates that a certain local stock is a powerful tool to protect it against oscillations of external demand as well as against the instability of internal processes. In view of this reflection of the author, it is verified the importance of a precise sizing, through a scientific method, to determine the optimal quantities of stock.
2.2 KANBAN OBJECTIVES
Through a general review of the available literature on the subject, it became possible to identify five main topics, in which the authors agree on the objectives of the Kanban:
- Avoid overproduction (reducing inventory and drives);
- Seek continuous improvement;
- Reduce the flow of information between sectors;
- Low inventory levels of in-process products;
- Inventory Control facilitated, since the packages used are standardized.
2.3 KANBAN TYPES
Traditionally there are three types of Kanban; Handling, production and supplier. The combined use of the first two is known as a “two-card Kanban system”, and is employed in situations where the supplier (producer center) is located away from its client (consumer center) forcing it to establish communication through the Drive card, usually operationalized by a third person. In sequence, the three types of Kanbans will be defined.
Whichever Kanban is adopted, using cards or through visual management, the principle is the same; When there is a firing, moving, producing or supplying a batch by an external vendor, it must occur according to the rules of producing only the required quantity at the required time. For this, Tubino (1997, p. 203) cites three basic rules:
- The Consumer Center (customer) must withdraw from the producer Center (supplier) only the items of your need at the time and quantities required.
- The preceding process (supplier) should only produce the quantities that are requested by the following (customer) process.
- Defective products should not be released to customers.
3. SIZING THE PRODUCTION KANBAN
Sizing represents the way to quantify the number of cards to be used, or the maximum quantity of products that must exist in the supermarket, the lot size, and the stock level that triggers the Kanban. This quantification can be accomplished through different mathematical equations.
The following three methodologies are presented to calculate the production Kanban, based on different authors.
3.1 DIMENSIONING OF THE PRODUCTION KANBAN BY SMALLEY (2004)
This study starts by gathering basic information about customer demand, which parts are processed in such a machine, the standard production times and the segregated material rates during the process. Based on these surveys, a study called machine data is carried out, as follows:
Table 01 – Machine data.
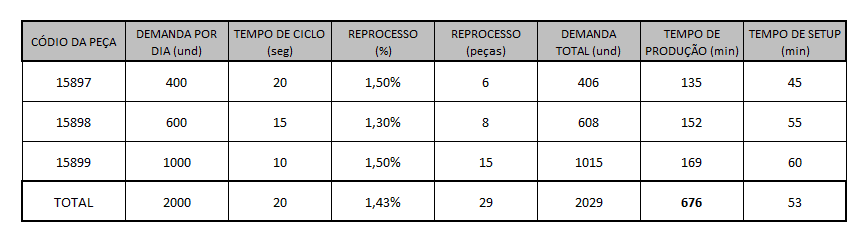
By surveying the machine data, we obtain the average daily demand of the parts processed in that machine (2,000 pieces) and the time required to meet this demand (676 min.). Then it is determined:
- Time available for setup;
- Establish the number of setups per day;
- Determine the size of the production lot;
- Specify a trigger point for the reset;
Table 02 – Time available for setup activities.
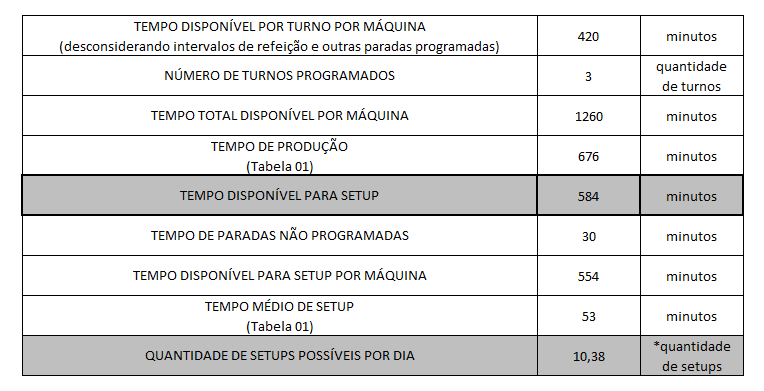
* Rounding down the whole number of setups
For a day of work on a machine that meets a demand of 2000 pieces/day, there is an available time of 554 minutes for non-productive activities, discounting an average time of downtime for various reasons, stops not Programmed and dividing this time by the standard average time of a setup, the number of possible setups per day was found for the respective machine.
3.1.1 BATCH CALCULATION
Given the maximum number of three setups per day, there are two ways to determine the size of the triangular Kanban batches, which are:
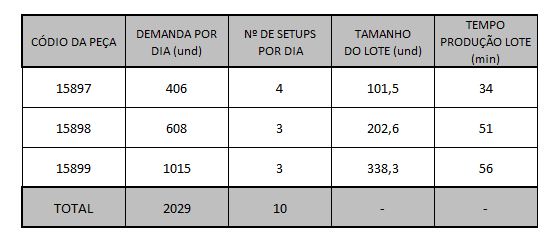
The fixed time method with variable quantity that standardizes the production at fixed demand intervals (batch). That is, as we determine the realization of ten setups per day, the fixed range of demand for each part model will be the reason for the demand for the number of setups of the part. Through the model of table 02, it is observed that this machine has capacity or machine load left to produce a larger variety of parts or meet a higher demand because, the amount of time available for setups is close to the amount of time to Produce.
Table 03 – Determination of batch size and production time in minutes.
The other method used to determine the triangular Kanban provides fixed quantities. In practice, this means dividing the time available on the day to produce by the number of parts that run on the machine. This result provides equal production times for all parts, resulting in mismatched stocks in relation to daily demand.
For Smalley (2004, p. 66) The first option produces batch sizes linked more strictly to customer demand and consequently smaller stocks. The second option, from fixed quantities, is easier to administer, because the setups standard is predictable, but the generated inventory levels are higher.
3.1.2 TRIANGULAR PRODUCTION KANBAN FIRING POINT
The firing point calculation is common for both methods, and to determine that two steps are required: Calculate the replacement lead time, that is, the time required to reset the batch, and the takt time of each part. Takt time is the time interval in which demand requests a new item from the said product.
Table 04 – Time required to supply 01 container.
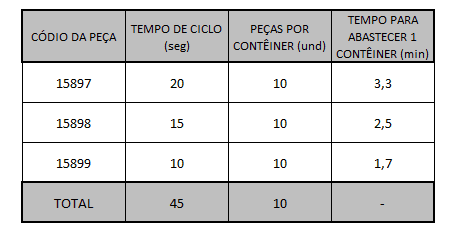
Table 05 – Replacement Lead time.
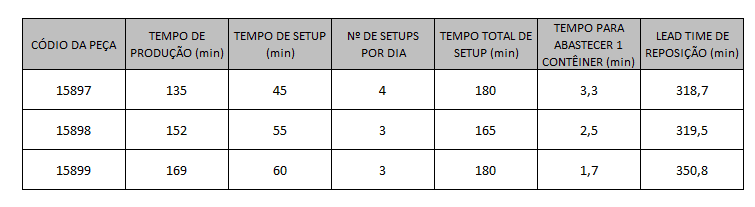
Each individual time assumes that no other product is running or waiting to be processed in the machine, which is not realistic. With three parts being processed in the machine, it is normal that each one is being produced, another is waiting for the signal to do so and the other is in the central supermarket, not yet fired. It is statistically unlikely that all three pieces are triggered at once, because there is always a time difference between them (SMALLEY, 2004, p. 67).
Therefore, the part that has the longest spare time will indicate the queue time of the others, and its queue time is determined by the second largest lead time, since a piece cannot be in front of itself.
Table 06 – Calculation of the takt time of the part.
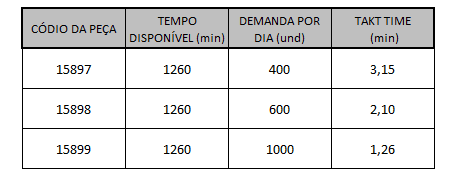
Table 07 – Calculation of the takt time of the part.
The firing point, the ratio between the lead time and the Takt time, indicates the exact moment when you must re-produce that particular piece, that is, in this model the safety stock is absorbing the setup time and a possible queue time of the part in production. When stock decreases to this level, the Kanban card must be moved to the machine by signaling replenishment. Using these simple formulas and rules comes to the size of the supermarket:
SUPERMARKET = LOT + FIRING POINT
3.2 PRODUCTION KANBAN BY PACE (2003)
The mathematical procedures used by this author coincide with the sizing methodology used by Tubino in his work Manual of production planning and Control published in 1997. Both authors foresee the total number of Kanbans in the system, including moving and production cards. For this the terms of the equation are:
C = quantity of Kanbans = quantity of containers
A = capacity of each container
U = demand (daily consumption of the product in question)
D = demand (daily consumption in n ° of containers)
Tp = Process time = production + reloading + Queue time
Te = Wait Time = consumption + transport
L = Lead time = Container period = Tp + Te
α = Safety factor
The equation to scale the amount of Kanbans in the circuit is determined from:
Quantity of Kanbans in the circuit = (daily demand) X (container period)
C = D x L
Replacing the terms of the equation, we have:
C = U/A x (Tp + Te)
To correct possible variations in efficiency between the producer center and the Assembly Center, the second member of the equation is added to the safety factor. This factor can range from 0 to 0.25 (PACE, 2003, p. 43).
So the equation that determines the total amount of Kanbans in the system will look like this:
C = U/A x (Tp + Te) x (1 + α)
During the process, each container will be time with move Kanban, time with the production kanban. The move Kanban will accompany the container during the waiting time, the production kanban will accompany during the process time. Therefore, it is possible to calculate the quantities for each kanban separately, unfolding the term (Tp = Te).
Thus, the calculation of the number of cards for the production Kanban is:
Cp = U/A x Tp x (1 + α)
According to Pace (2003, p. 45), before applying the terms Te and Tp to the above expressions, you must make them pure numbers. To turn Tp into a pure number, divide the times that compose it (production time + Reload time + queue time) for the total time used by the producer center to produce the average daily demand of the product.
3.2.1 TRIANGULAR PRODUCTION KANBAN FIRING POINT
Normally, a card is used in the red stripe, plus a third in the yellow stripe, and the remainder in the green stripe for each type of product. If there are only three cards in the sizing, it is adopted as a rule, a card in each track (PACE, 2003, p. 87).
3.3 PRODUCTION KANBAN BY SHINGO (2002)
The question of how many Kanbans to use is a basic question when administering a Kanban system. The answer corresponds to the number of pallets described in the point and order system. Thus, the number of Kanbans can be calculated as follows (SHINGO 2002, p. 215):
(1) where P. P is the order point calculated by the following equation:
(2) p. P = a x P + α
Replacing (2) in (1), we have:
3 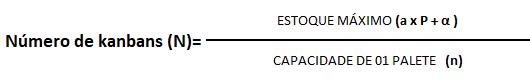
Still according to Shingo, in the Toyota production system, the determination of the number of Kanbans is far from being as important as the improvement of the production system to minimize (N). In other words, reducing the size of batches, reducing the setup lead time and eliminating the safety stocks are the most important factors in the Toyota production system.
3.3.1 FIRING POINT OF THE PRODUCTION KANBAN BY SHINGO
The Inventory Control technique using the order point is valid both from the point of view of manufacturing and from the point of view of the purchasing process, and can be determined by the following equation:
P. p = a x P + α
The elements of the order point formula are defined as well:
Daily Demand (a) – is the daily amount consumed. This value is determined by demand trends and ideally should be balanced as much as possible.
Lead Time (P) – is the spare time of the parts to be supplied. This is not simply the time required to produce the parts, it also includes the waits and times of transport and handling.
Shipping times must be recognised as an important factor when the external vendor is leased in another geographic region.
Safety Stock (α) – According to Shingo (2002, p. 2003) is defined as the minimum storage quantity. Functioning as a safety valve in the case of unforeseen variations in the production process.
These variations can be:
- Machine breaks;
- Demand fluctuations;
- Delay of suppliers;
- Labour absences.
3.3.2 CHART FOR THE ORDER POINT
The frequency of orders decreases when the batch size increases, similarly, small batches mean more frequent orders.
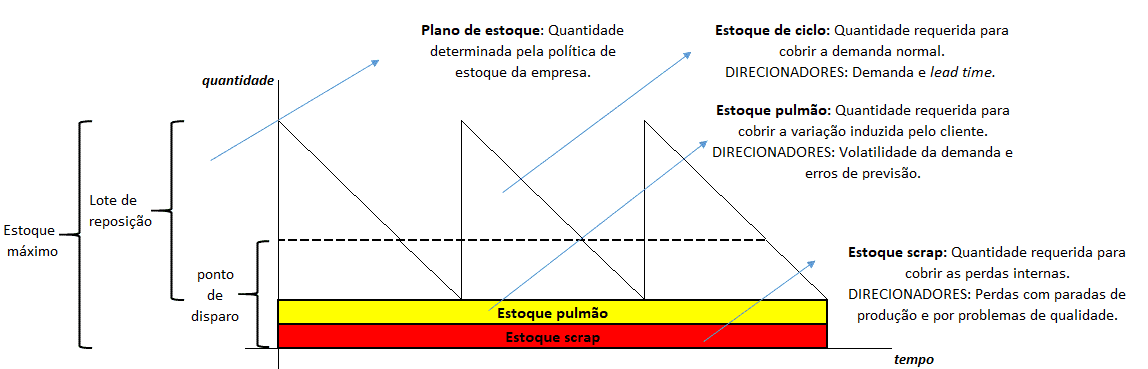
You can better represent the operation of the order point through the saw chart, as shown in Figure 16 below. In which, it consists of the cycle stock, the lung stock and the scrap stock, the last two composing the safety stock and finally the dashed line, which represents the time of the resupply request, determined according to the resupply lead time.
- Cycle Stock (Q) – Quantity of parts to be supplied. It can be determined by the product between the daily demand and the replacement lead time (A x P).
- Lung stock – Quantity required for possible variation of demand. It can be determined by the standard deviation of historical demand.
- Scrap stock – Quantity required through the scrap percentage.
Figure 03 – Order Point Chart.
4. CASE STUDY
4.1 COMPANY A
The company in which the case study was carried out operates in the segment of home appliances, with a focus on the white line, has a body of 2,500 employees and is located in the state of Ceará. In the year 2014 the company’s stamping sector was already serving 97% of the internal demand of stamped parts for the production of stoves. However, this high demand generated several problems for the team that managed the sector. Problems such as high stocks, cost of overtime payments, costs of downtime in the production process of appliances due to lack of components from this same sector, and storage costs because of super stocks.
4.2 MATERIALS MANAGEMENT IN COMPANY A
In the PCPM are carried out the activities of Master production plan, production scheduling, programming of purchase of raw materials, production scheduling of work in process and control of inventory levels for finished products and components.
This whole systematization of planning passes through the M.R.P. Integrating the functions of industrial planning, sales forecasting, planning of productive resources, master production plan, material requirements planning, production capacity requirements planning, purchasing and Cost accounting. The central point of the entire system is the gross requirements module, that is, the product of the master production plan multiplied by the bills of materials.
Once you have determined the raw requirements, they are consolidated for all common items that need components that are being planned. The following are discounted stocks, purchase orders for purchased items, and production orders for the internal production items. The balance of this equation is the net purchase or internal production requirement per period.
With MRP processing a report called the Material Requirements statement (DNM) is generated to meet the demand of the internal manufacturing items and purchased items. In possession of the DNM, the production programmer responsible for the stamping industry opens the production orders for the week. As production orders are opened by components, the stamping industry receives more than 200 orders in the week at a single time. Consequently, this becomes an obstacle to well done management and the results have become a problem, they are; Super-stocks or lack of components generating the palatalization of the assembly lines of stoves.
4.3 THE DIAGNOSIS OF THE STAMPING SECTOR BEFORE THE KANBAN
The steel sheet stamping sector of company A operates in three production shifts, consisting of 170 employees, being; One supervisor, three leaders, one production sharpener, six tool exchangers, three crane operators, three forklift operators, 124 machine operators and thirty production auxiliaries.
The production structure consists of fifteen large progressive presses, three progressive small presses and six manual presses. This manufacturing structure produced in 2014 approximately 400,000 items per day, to supply the production process of the company’s stoves factory.
The average in-process inventory for the stamping industry is approximately 1.3 million pieces of more than 200 different types of parts that constitute the stoves mix.
4.4 THE SIZING METHOD USED BY THE COMPANY
Analyzing the three mathematical procedures presented, it was perceived that the results achieved would be approximated, since the three authors cited take into consideration for the determination of the Kanban supermarket, variables such as: average demand, lead Production times and setup times. However, the calculation model demonstrated by SMALLEY (2004), with the methodology of the fixed time and the varied quantities, takes into consideration the study of load machine and prioritizes the reduction of stocks, thus becoming the best choice for the current scenario of the company That seeks to reduce costs, gain productivity and improve quality.
4.5 THE SIZING OF THE COMPANY’S KANBAN TO
Selected the mathematical procedure, we opted to scale the Kanban supermarket of the processed parts in the Gutman 150t Press as pilot for project implementation.
4.5.1 MACHINE DATA SURVEY
The procedure was initiated by identifying which parts are processed in the Gutman 150t Progressive Press and the demand for each piece. Through the production newsletter that contains the production plan of the month and the planned daily schedule, the average daily demand for each product is obtained. In possession of the product code, it takes out the structure report to identify its components and determine their respective daily demands.
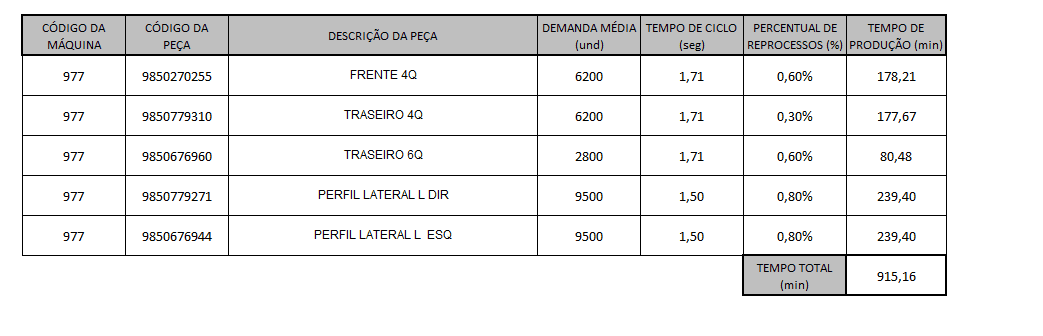
Table 8 – Daily demand for each piece of the Gutman 150t injector.
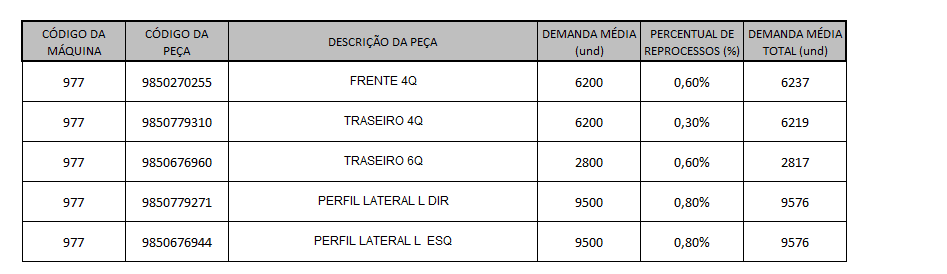
The following was determined the time required for production to meet the average demand, taking into account the percentage of losses with reprocess or scrap, for each of the processed parts.
Table 9 – Time required to meet average day demand.
With the necessary time of productive activities to meet the average daily demand it is possible to start the study of machine data. However, an additional variable was inserted in the calculation of machine data that was named machine availability as critical to the mathematical procedure exposed by the author SMALLEY.
The insertion of the machine availability variable has the purpose of assigning greater precision to the sizing, by the fact that no machine on a “factory floor” is 100% of the time available to produce. In other words, there will be unplanned downtime for maintenance, or the machine breakage itself. Thus, through the downtime report that records the history of equipment stoppages, an arithmetic average was calculated for all Gutman 150t presses that occurred in the last three months and it was found that this was 96% of the time Available to produce.
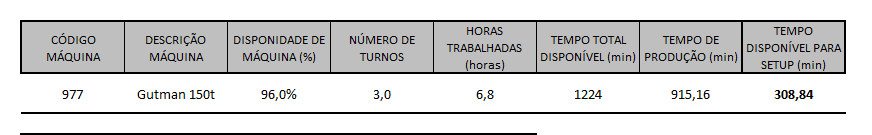
Table 10 – Time available for setup.

For a day of work of three shifts, totaling 1,224 minutes, in which 96% of this time the equipment and is available to produce, is obtained 915.16 minutes available in the respective machine, which meets a demand of 34,425 parts per day and requires 915.16 minutes To meet the average demand, it was found 308.84 minutes available to perform setups.
Thus, it became possible to determine the maximum amount of setups to be performed in a working day. For this, it was necessary to raise the average time of each setup. In possession of these data, you can calculate the maximum number of setups to be performed on the same day, through the split operation between the time available for setup and the average time for each setup, as shown in Table 12.
Table 11 – Number of possible setups.
In the respective machine there is an available time of 543.81 minutes for non-productive activities, discounting the availability rate of the machine and considering that this press works in three shifts of 6.8 hours uninterrupted found the number of 6 setups Possible per day.
However, the realization of 6 setups per day in a press that has the average time of each setup in 44.2 minutes, will generate a total downtime of 265 minutes, that is, there is a process with low efficiency. Thinking about it, Shingo (2002, p. 77) states that the use of the Fast tool Exchange method enabled the company H. Weidmann Co., with facilities in Switzerland, to achieve a reduction in the average time of setup in a press, from 2 hours and a half, to the current 6 Minutes and 35 seconds. This reduction allowed an increase of 2 hours and 20 minutes of production, allowing greater flexibility to the productive process, generating gains for the company.
4.5.2 PRODUCTION LOT DETERMINATION
According to Smalley (2004) There are two methods for calculating the batch size for the production kanban, they are: fixed time with varying quantities and varying quantities. The first option produces batch sizes that are more closely linked to customer demand and, consequently, leads to smaller stocks. The second option can be considered the most to administer, because the setups pattern is regular and predictable. However, as the main objective is to provide reduction of inventory levels, it was chosen to use the method with fixed time and varied quantity to determine the size of the lot, also betting that company A was prepared for the new challenge.
4.5.3 REPLACEMENT LEAD TIME
The replacement lead time is a composition of the times of; Production, setup and supply of containers.
Table 12 – Time to supply a standard container for each part type.
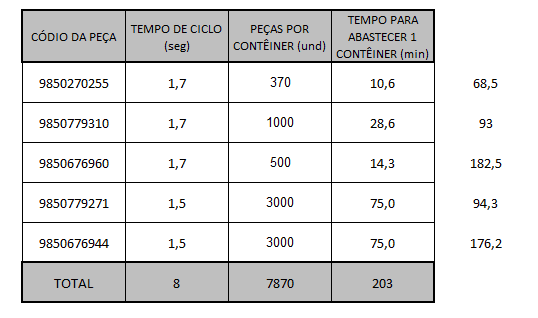
Table 13 – Replacement Lead time for each part type.
4.5.4 CALCULATION OF TAKT TIME
The takt time found for each part represents the speed at which the demand wants to receive the respective item.
Table 14 – Takt replacement time for each part type.
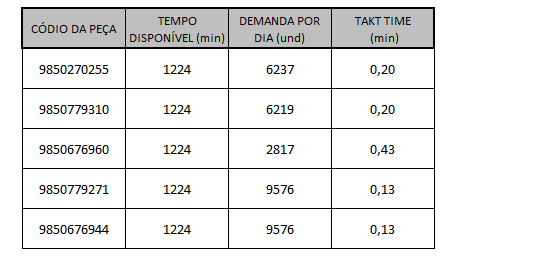
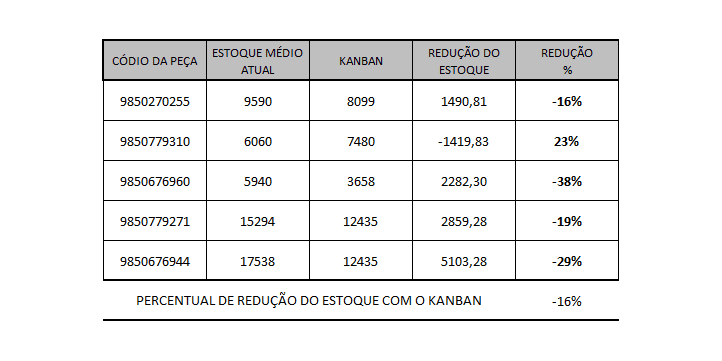
4.5.5 DETERMINING THE FIRING POINT PER ITEM
As the largest replacement lead time value found is for the lateral profile, it adopts its time as the queue time for the other four parts that run on the machine. Yes, the longest spare time will be the longest queue time possible for any other part that compets on the same machine. However, at least one part should have the second longest queue time, because the part with the longest queue time cannot be in front of itself.
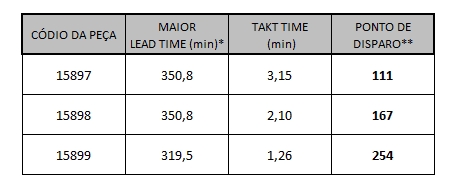
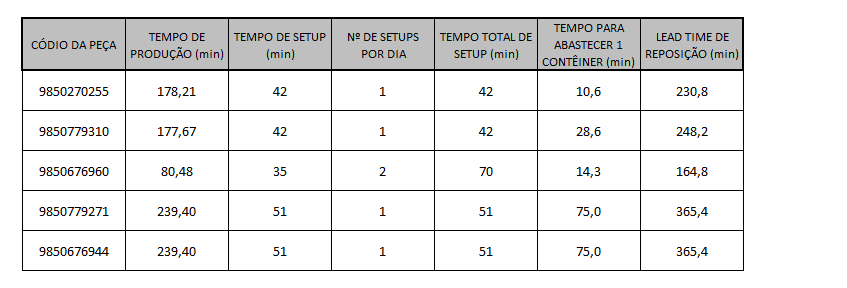
To determine the firing point, if two calculations are required, they are: replacement lead time and Takt time. In this way, the firing point was as shown in the table below:
Table 15 – Firing point for each part type.
The firing point, which indicates the time to replenish the stock, has been calculated
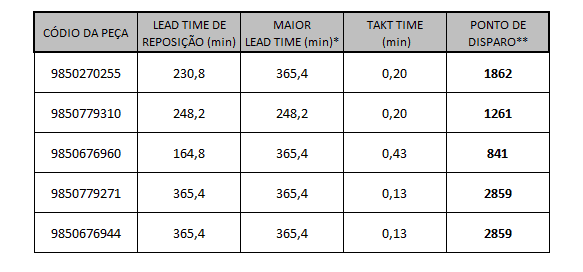
Completed the sizing of the Kanban for the parts processed on that machine.
Table 16 – Sizing the KANBAN for Gutman 150t parts.
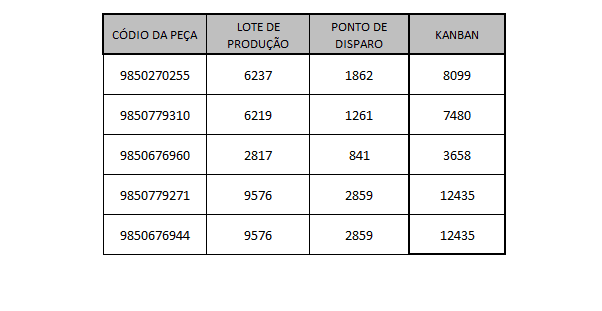
6 ANALYSIS OF EXPECTED RESULTS
According to the average inventory report of the stamping industry at company A the parts processed in Gutman 150t consolidated a total stock of 54,422 pieces before the implementation of the Kanban. With the implementation of the Kanban pilot in this single press, it was possible to achieve a reduction of 16% of the inventory level, as shown in table 18 below.
Table 17 – Reduction of stock for Gutman 150t parts.
This reduction percentage will be even greater over the course of time because, for the analysis of the results, the full Kanban was considered, which does not apply, since daily consumption and the supermarket will not remain static, further raising this rate of Inventory reduction.
Other points that have been highlighted with the implementation of the Kanban in company A, refers to the stock of the 9850779310 code part, in which, the inventory before the Kanban was below ideal. This wrong sizing of the inventory, with insufficient quantities, generated paralyzing in the assembly line of stoves. After the mathematical sizing and implementation of the Kanban, for the parts stamped in a single press, it was possible to reduce by 3% the indicator of stops of the assembly line by disfilling of stamped parts.
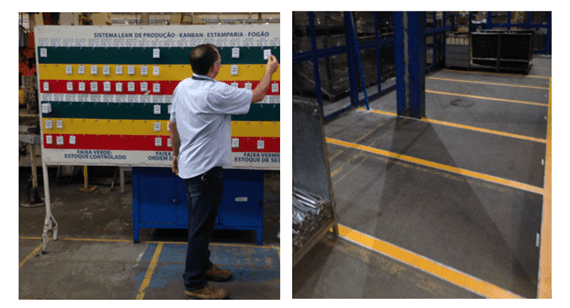
Adding to this, there was an evolution in the production schedule of the sector because, it started to occur without the need of production orders printed on paper, occurring only with the movement of the cards in the Kanban Management board, as figure below.
Figure 04 – Kanban Supermarket.
Finally, analyzing all the results, it was perceived that the use of the machine was smaller because, the realization of six setups represents 24% of the day available to produce. For this supposed reduction of the efficiency of the machine one can cite a widely used analogy in Lean philosophy, which says: “Reduce the level of water to appear the Stones”. In other words, as reduced the level of stocks identified a problem or analogous, a stone, which is the high setup time of approximately 44.2 minutes. In which, currently it is not considered as a problem, since excessive stocks mask it. However, still taking into account the time of 44.2 minutes for each setup, one could include another piece to run on this machine, since the implementation of the Kanban will enable the realization of six daily setups, and currently only five are required. In this way, there is time available to include another stamping tool.
6. FINAL CONSIDERATIONS
The objective of this work was to know the procedures for sizing Kanban supermarkets, considering as a crucial element to enable actions that can balize a broader study for the reduction of the fixed value in stocks and as Rationale for understanding the Kanban sizing of the parts processed in the Gutman 150t Press of the stamping sector of company A.
Some of the concepts discussed and addressed in the literature on the theme were presented, as a way to facilitate understanding and understanding for the process of implementing the Kanban tool. In this context, it was possible to identify how the company is positioned and how it is structuring to favor the implementation of the just in time concept.
Finally, the results obtained using the mathematical model for the sizing of the Kanban were analyzed. It was concluded that this pilot project for the implementation of the kanban provided a reduction of at least 16% in the inventory quantities of the five dimensioned parts and an initial reduction of 3% for the assembly line paralizations for lack of the same parts.
Other important points in the analysis of the results were, the finding of the high setup time for the tool exchanges and the optimization of the management model by the stamping Area supervisor, in which he proceeded to manage the production and the stock Through the Kanban board.
Therefore, it recommends for company A the systematic implementation of Kanban sizing for all parts processed in the stamping industry. Associated with this implementation it is important to disseminate the just in time concept, through training for employees, because the second step of this project can be given through the management of the Kanban by the operators.
REFERENCES
HUHNE, Leda Miranda. Metodologia Científica. 7 e.d. Rio de Janeiro: Agir, 2001.
PACE, João Henrique. O Kanban na Prática. 1 e.d. Rio de Janeiro: Qualitymark, 2003.
SLACK, Nigel; CHAMBERS, Stuart; JOHNSTON, Robert. Administração da Produção. 2 e.d. São Paulo: Atlas, 2002.
SMALLEY, Art. Criando o Sistema Puxado Nivelado. 1 e.d. São Paulo: Lean Enterprise Institute, 2005.
SHINGO, Shingeo. O Sistema Toyota de Produção. 2 e.d. Porto Alegre: Bookman, 1996.
TUBINO, Dalvino Ferrari. Manual de Planejamento e Controle da Produção. São Paulo: Atlas, 1997.
WOMACK, James P.; JONES, Daniel T. A Mentalidade Enxuta nas Empresas. 3 e.d. São Paulo: Campos, 2003.
[1] Post-graduation: MBA in people management from the integrated faculty of Ceará. Graduated in mechanical production engineering from Universidade Federal do Ceará.
Submitted: April, 2019.
Approved: May, 2019.