MELLO, Thiago [2]
MELLO, Thiago. The efficiency of the methodology 8 d Applied in an industry the automotive industry. Multidisciplinary Core scientific journal of knowledge. 07 Edition. 02 year, vol. 02. pp 97-116, October 2017. ISSN: 0959-2448
Summary
The success and competitiveness of companies today are directly related to the quality of its products or services. This requires, in the event of faults, the use of appropriate methodologies to resolve the non-conformity. The methodology 8 d problem-solving quest in the productive process, composed of eight steps. This study describes the deployment method 8 d in an automobile company. The results proved effective as the Elimination of non-conformities, answering customer expectations and provided financial return.
Keywords: 8d, elimination of non-conformities, Quality tool.
1. INTRODUCTION
As Berger et al. (2012) with the passage of time, since the quality has been shown to be important in the production process or in attendance, some connections have been dedicating to the development of procedures and tools, adapting them according to the need to ensure that the companies could offer better quality of their products and services. Among those names some apparent due to the increasing application of their tools over the years, each developing or enhancing a quality methodology, they are: Deming (continuous improvement), Juran (planning, control and improvement), Feigenbaum ( total quality control), Crosby (zero defects), Ishikawa (cause and effect diagram) and Taguchi (statistical process control).
About the term quality, Berger et al. (2012) recalls that conceptually was seen by expressing desirable features for a product or service, focused on customer satisfaction. However, the competitive market required a conceptual change, comprising in addition to characteristics of products and services to engage consumer requirements, coupled to cost and benefit considerations. To relate the competitive environment, the authors state that this is the factor that led to the changes in the business environment focused on quality, because organizations realize benefits in deployment of quality tools that have made possible improvements.
Fields et al. (2011) States that the quality of a product or service is related to the ability to meet requirements perceived as value, however, remember that each individual's perception differs from each other, on account of their needs and expectations. Still, bails that quality tools help companies improve the vision of its processes, prevent failures and non-conformities in the processes. However, there is a difficulty for companies to integrate these management tools and the cost of quality, which are the base requirements of continuous improvement of the production process to streamline the troubleshooting, seek better results using a methodology systematized.
When the environment of processes is the automotive market, which like the others involve a fierce competitiveness at a global level, of demanding consumers, packed with technological changes and insightful rules, the companies are driven the necessary continuous improvement of quality (CAMPOS et al. 2011). So it was not by chance that in the 80, within this environment is the methodology called 8 d or solution in 8 disciplines, developed by Ford Motor Company, and released on the MS 9000 manual Materials Management System Requirement to be used by the automaker's suppliers to assist them in solving the problems (GONZALES; MIGUEL, 1998).
The methodology 8 d aims to detect problems, involves 8 steps that comprise a sequence of actions in order to eradicate the possible problem of the productive process, they are: 1. Training of multidisciplinary teams to solve the problem; 2. Description of the problem; 3. Containment action; 4. Determining the root cause; 5. Definition of corrective actions; 6. Implementation of corrective actions; 7. Action to prevent recurrence; 8. Congratulate the team (GONZALES; MIGUEL, 1998).
On the above, and the use of the tool 8 d in an automobile company, this study seeks to answer the question: is there a possibility to analyze the company and improve your quality with this tool? This question leads to the purpose of the study, which is to check the efficiency of the tool 8 d in improvement of the quality of the production system of automobile industry, aiming at the reduction of non-conformity.
The study is justified on the premise that the speed and quick response of a company have been systematic and orderly capacity measures to solve problems. Similarly, the development of quality and competitiveness this increasingly demanding when answers to some non-conformities, generators due to the technological advancement. When a problem is identified by the customer, the quality areas and other areas related to it, are triggered to contain the problem both within the company as those involving the client. And in this context that the study on the tool 8 d.
The methodology applied in this study was a case study, using internal complaints documents and form generated from internal problems, as the nature of the research, is characterized as qualitative.
2. Concept and DEVELOPMENT of METHODOLOGY 8 d
The methodology 8 d began at the standard of quality MIL-STD 1520 Corrective Action and Disposition System for Nonconforming Material issued by the army of the United States of America, and introduced in the year 1974, being employed as a method to treat the non-conformities. The method had as main objective to identify the error, examine the root cause of the problem, the limitation of losses, prevent recurrences and reduce the cost of production by promoting an increase in quality (BEHRENS; WILDE, HOFFMANN, 2007).
Gonzales and Miguel (1998) credit the development of methodology to the company Ford Motor Company, and report that 80 us, after being presented, was supported by the senior management of the company and subsequently the German Associations of the Automotive Industry (VDA) published a version the method for suppliers in the automotive industry (BEHRENS; WILDE, HOFFMANN, 2007).
The method 8 d is also known as problem solution oriented team, or Team Oriented Problem Solving (TOPS) or Eigth TOPS Discipline process (8 d), employed in other areas, in addition to the automotive, that started your use, in other industries, leading to a high reputation among manufacturing companies as evidenced in the research of Campagnaro et al. (2008).
The methodology 8 d corresponds to a tool of continuous improvement of the quality of processes and products, employed to resolve the non-conformity, ordering thought, making it easy to the analysis and solution of a possible problem. Has your large-scale use within organizations because your simplicity and effectiveness, teamwork (GONZALES; MIGUEL, 1998).
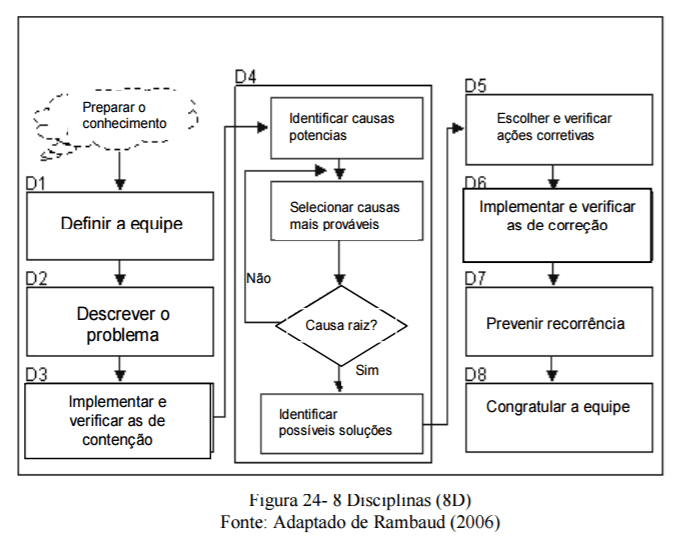
The methodology 8 d, on the assumption that the problem has already been identified, define a sequence of steps to be followed (Figure 1) when evidence of a problem, as demonstrated in the following flowchart:
Disbelieving every step, Tener (2008) features:
- D1-team Setting: this setting requires that team members have knowledge of process, product and solution of the problem. This first step requires the direction of a leader to direct the team;
- D2-problem description: problem specification occurs, which its origins through the questions: who, what, when, where, why and how?;
- D3-implementation of immediate containment action: requires immediate isolation of the causative effect of the problem until an effective corrective action is taken;
- D4-Root cause analysis: Consists in investigating the problem and identify your cause for subsequent taking of corrective actions. The objective of this step is to find out what problem occurred, why it occurred and how to prevent recurrence. Corresponds to the most critical phase of the methodology once her depends on the success of the implementation and continuity of next steps;
- D5 – choose and detection of possible corrective actions – corresponds to the choice of the solution: in this step is the choice of corrective action to be implemented for the Elimination of the root cause of the problem. It is the responsibility of the team a critical analysis, with the intention that the path to be followed is best suited for the Elimination of the problem, considering the resources available;
- D6-Proof of the effectiveness of actions: post rolling out corrective actions, the certification that no haverá́ recurrence of problem, long-term monitoring;
- D7-preventive actions: when effective action, if there is a need to change procedures, control plans, methods, work instructions or quality system documents. Also identified the need for training and the scope of actions for other products and processes;
- D8-Closing analysis: requires recognition by the efforts of those involved, congratulating all members of the team and sharing the lessons learned with respect to the method.
2.1 quality tools
By tools comprises the set of "devices, graphic, numeric, or analytical procedures, practices, operating schemes formulations, operation mechanisms, anyway, structured methods to enable the deployment of Total quality", aimed at support to achieve total quality (PALADINI, 1994, p. 66).
In the year 1968, aiming to facilitate the studies Kaoro Ishikawa of professional quality organised a set of quality control tools (mosque; VALDEZ, 2009) showing the importance of seven tools: Pareto diagram, cause and effect diagram, histogram, check sheet, scatter charts, flow charts, control Charts (LINS, 1993).
Lins (1993) says that for educational purposes the tools are divided into two groups: auxiliary and Basic. The basic aid in problem analysis and are: flow chart, check sheet, Pareto chart, cause and effect diagram, histogram, trend chart, control chart and the scatter plot. In the second group, the auxiliaries, support the use of complementing them, and basic are: brainstorming, nominal group technique, presentation diagrams, analysis of field forces, checklist and the analysis of process capability. Coutinho et al. (2010) corroborates with Lins (1993) in saying that the main purpose of the application of the tools is to identify problems through appropriate analysis, seeking your best resolution, in addition to maintaining and improving results, collect, process, and dispose the information required.
According to Lins (1993) the tools can be used in isolation, however, when applied in conjunction best results are obtained with a systematic approach to troubleshooting. The author presents the basic tools, which are called "rice and beans of the quality engineering":
–Function Flowchart describing the process. Understand processes-if the combination of equipment, methods, people, tools and raw material that generates a product or service with certain characteristics. "The flowchart describes the sequence of the work involved in the process, step by step, and the points at which decisions are taken." (LINS, 1993, p. 153-154). Its main activity elements, decision, reply and start/end, represented with geometric figures;
–Verification sheet or checklist, corresponds to a frame to release the number of occurrences of a particular event. Relates the observation of phenomena, that is, after observing a number of occurrences of a particular problem or an event notes your frequency in the sheet of simplified form;
–Pareto, developed by Vilfredo Pareto, represented graphically by ordering bars the frequencies of occurrences. Shows the curve of cumulative percentage, making viewing and understanding (mosque; VALENCIA 2010). "Every question is quantified in terms of your contribution to the problem and placed in descending order of influence or occurrence." (LINS, 1993, p. 155);
–Diagram of cause and effect or Ishikawa diagram or diagram "herringbone", by your graphic format, developed by Kaoru Ishikawa, used to identify the causes of a problem, allows, "from the basic groups of possible causes, deploy such causes until the levels of detail appropriate to the solution of the problem. " (LINS, 1993, p. 155);
-Trend Chart describes the behavior of a variable over time or due to other reference variable. Identifies behavioral tendencies, facilitates the identification of events or understanding of the problem;
–Histogram identifies the typical behavior and usually feature allows viewing of certain phenomena, revealing the frequency with which they occur;
–Letter or letter of Shewhart, developed in the 1920 by Walter Shewhart, is used for monitoring processes;
–Scatter chart allows you to show the correlation between two variables.
Mosque and Vasconcelos (2010) a short presentation of the tools used for development of quality control:
–Brainstorming: a group technique, where members meet and discuss about a particular subject, based on their experiences, seeking to add new ideals to the subject and generate innovative solutions.
–Histogram: frequency distribution, or as it is also known graphically represents in columns or bars tabulated data (mosque; Vasconcelos, 2010). "Enables to meet the characteristics of a process or a product allowing an overview of changes in a DataSet. The way these data are distributed and contributes in a decisive way in the identification of data. " (RENO, 2015, p. 6);
–Checklist: aims to generate frames with given making viewing and objectives (MESQUITA; VALENCIA 2010);
–5W1H: resembles a check-list following the ideology of six steps and is in the planning of all actions necessary to achieve a desired result. O
Godfrey (2001), former President and CEO of the Juran Institute Inc. cites that only a few companies have an understanding of the diversity of methods and tools for solving critical problems, and this lead him to warn about the need of the choice of approach (methods, techniques and Tools) suitable for solving the most important problems.
Despite the wide availability of tools, Moore (2007) argues that companies can not always achieve the desired levels and improvement, don't select the right tools for your specific case, although initially the job these tools show if successful, but are not supported. For the choice of suitable tool Moore (2007) suggests considering the following issues to achieve efficiency and effectiveness in the application:
- establish the conditions under which the tools become incompatible;
- analyze the advantages and disadvantages of each tool;
- establish the tools they need to maximize the other results;
- set the conditions for the application of each tool.
The study in question, using the tool of improvement of manufacturing processes called Poka-Yoke, based on error detection.
-Poka-Yoke: Method was considered a physical device used to prevent the errors could occur. Currently has a broader meaning, being defined as a tool error proof, "a quality control technique or a philosophy of quality. The basic principle common to these strands is the prevention of errors. " Originated in the experiments of Toyota Motors Company, in the pursuit of zero defect in both the production and disposal of quality inspections. (VIDOR; SAURIN, 2011)
Second Resende and Fonseca (2002) to reduce the reliance on statistical quality control was one of the reasons that led the company Toyota to spread internally the poka-yoke, since this method accepts margins of error that are incompatible with the goal of zero. However, this argument has limitations, as the authors themselves relate:
(a) the poka-yokes cannot replace the statistical process control in 100% of cases, is the impossibility of technical design the poka-yoke or by the nature of the quality characteristic to be inspected (e.g. mechanical strength of components, which verification may require destructive tests);
(b) the poka-yokes are also subject to failures, since they often are made up of components with less than 100% reliability (e.g., sensors);
(c)[…] the statistical control can subsidize the project of poka-yokes, pointing where they are a priority. (RESENDE; FONSECA, 2002).
The application of poka-Yoke is not limited to lean prod[3]uction, which can be inserted in various contexts such as logistics, health, construction, information technology (RESENDE; FONSECA, 2002). Among its features, Walnut (2010) lists your use a 100% inspection regime; It requires the permanent attention of the operator with respect to the product in the process; reduction or elimination of defects through immediate corrective actions; and for simplicity and low investment.
Nogueira (2010) still has that poka-yoke systems enables the execution of three functions considered basic prevention of defects: warning, control and stop. These functions are performed in different situations, which are: "the error is to occur" where occurs the alert on the occurrence of an anomaly; "the error has already occurred, but did not result in malfunction" occurs the control; "the error caused a defect"-scaling process occurs, preventing the flow of defects.
Consul (2015) relates that the poka yoke enables 100% inspection at source, with rapid feedback which eliminates the loss arising from the manufacture of defective products. So, your role in the production line is of detention of the entire system, which occurs through immediate signaling when it detects a fault.
To Womack and Jones (1998), the meaning of lean manufacturing is linked with the search for a better way to manage a company's relationships with its customers, supply chain, product development and operations, with the main aim to achieve more results with fewer resources. According to Gandhi and Son Fernandes (2004), currently coexist different definitions for lean manufacturing, among them that the lean manufacturing as a strategic and integrated management model, which aims to give support to a company achieve their performance objectives related to quality and productivity.
3. RESEARCH METHODOLOGY
From the point of view of the goals, is characterized in exploratory research, based on literature review. As for exploratory research, provides further elaboration on the subject, facilitating the delimitation of the topic researched, guides the objectives and the formulation of hypotheses (PRODANOV; FREITAS, 2013). This type of research usually takes the form of bibliographical research and case studies. This involves bibliographical search time; interviews with people who have had practical experience with the problem researched; analysis of examples to stimulate the understanding (PRODANOV; FREITAS, 2013).
3.1 methodological Characteristics
For the field study, primary techniques were used for data collection. This is a study of a quantitative nature, that has as main characteristic the interrogation of people on the subject researched.
The company is a subsidiary of a multinational organization in the sector of auto parts, is located in São Paulo, produces products for torque transmission for light and heavy vehicles. The Group has four more units in Brazil, subsidiaries in several countries and Germany-based array.
The brazilian subsidiary has annual revenues of R $600 million per year (base year 2012) and approximately 550 employees. As the company has 70% of components or services of the group units and 30% of suppliers of various localities.
3.2 operational procedures
An analysis was carried out with the quality supervisor, which allowed to measure non-compliance generated by the lack of quality. Inside information was collected by means of indicators. The quality of the engineering company provided data about the current quality index.
According to the production department, the cell works with only 2 of the 3 shifts available, resulting in 14 hours a day, in 24 days in the month and the account with just 8 operators in your process. Time spent with setup is 20.75 hours/month.
The daily production of the cell is based on 180 piece time.
An Assembly cell of subcomponents called Pre-damping is responsible for supplying this line of production, where they work on average producing 90 operators 3 set of pré-amortecimento per hour.
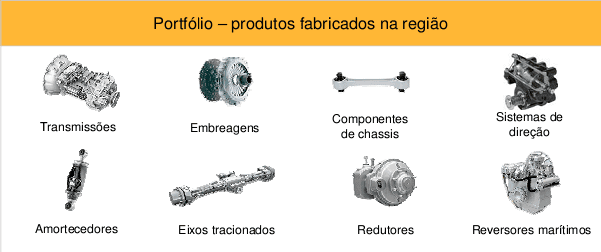
Main products
The main products manufactured by the company in the various regions in which it operates are set out in Figure 2.
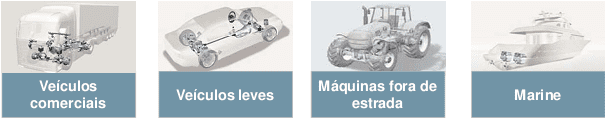
Your application (Figure 3) involves the transmission and suspension in all automotive segments.
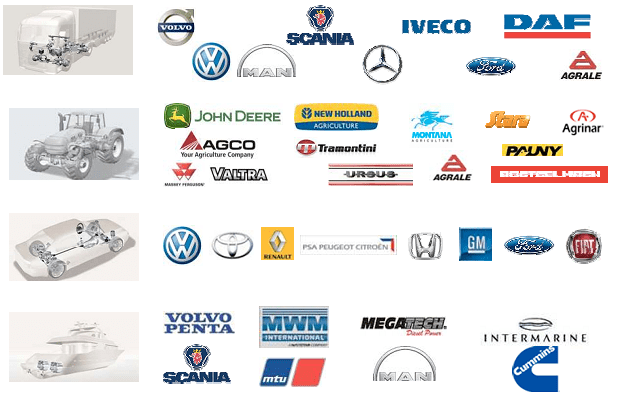
Main clients of the company
-OE Segment (Overall Equipment) or original equipment for automakers.
-AM: (After Marketing) or aftermarket. For this market the company adopts the criterion of wholesalers of autoparts and have coverage in all the national territory.
-Exports: South America and Central America.
Figure 4 presents the main customers.
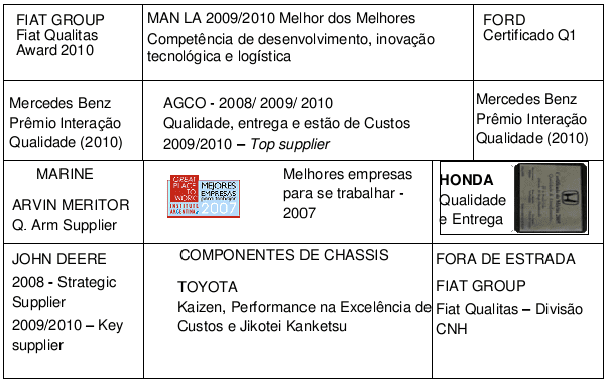
Awards and certifications
The main certifications and awards won by the Organization were issued and/or delivered by the bodies responsible for quality, environment, occupational health and safety and original applications and clients: ISO TS 16949 after-sales, ISO 14001, OHSAS 18001, IQA, AUTO TOP OF MIND. The awards won are listed in Figure 5.
3.3 description of the nonconformity
Figure 6 displays the most important parts of the clutch disk.
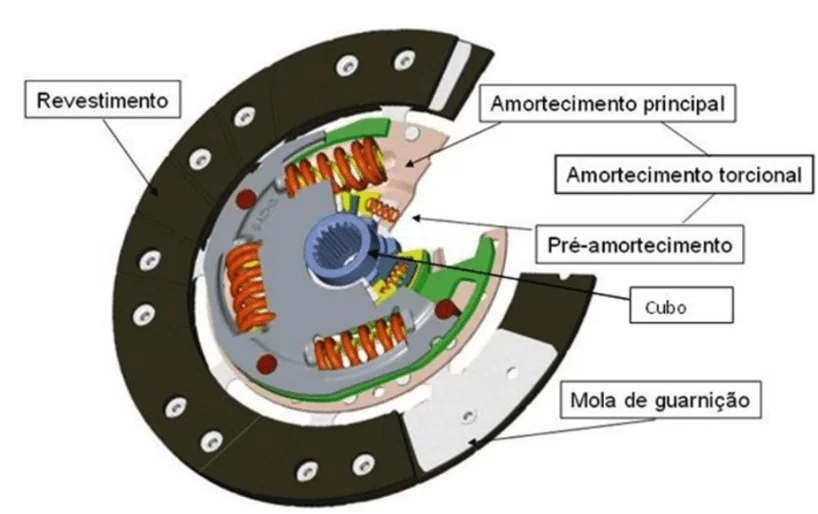
In Figure 6, describing the piece, it is observed, the coatings are riveted on the trim springs or cushion springs. The clutch disc incorporates the torsional damping and pré-amortecimento whose basic function is to reduce the vibrations that are generated by the torcionais irregularities in the internal combustion engine. The vibrations are transmitted to the Exchange, which can not only cause wear and tear on the gears or generate an uncomfortable level of noise to the occupants of the vehicle.
As Drexl (1998) the pré-amortecimento system of a clutch disc functions isolate the fluctuation of the engine when idling, in this condition, the vibrating simplified system basically consists of two masses: the engine and parts of the transmission that revolve around him. With the pré-amortecedor the system can be calibrated in such a way that the resonant frequency is between 7 to 15 Hz, that is, below the idle. Turns out, the problems encountered in idle are resolved by reducing resonance spin until it is below the rotation of idling. This is possible with strongly typed values between 0.1 to 0.6 Nm/°.
Thus, the pré-amortecimento acts to reduce vibrations at idle and main damping is used to decrease vibrations torcionais in regular use of the automobile. Already the disc, as the primary torque transmission and as secondary function attenuation of these vibrations torcionais (DREXL, 1998).
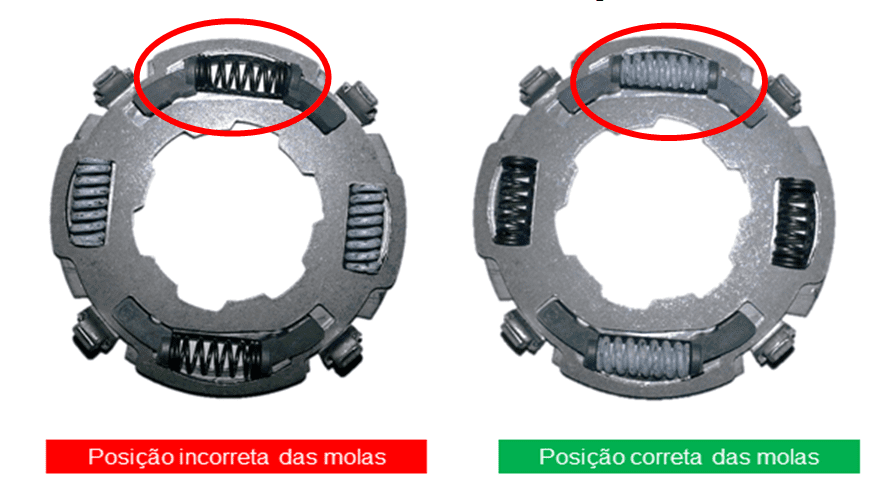
Current map: During the test the vehicle there was a non-compliance on the client, thus generating a formal complaint, where he was checked on company X a clutch disc noise. The set was analyzed by the quality engineering that identified an inversion in the Assembly of the pré-amortecimento Springs, as shown in Figure 7.
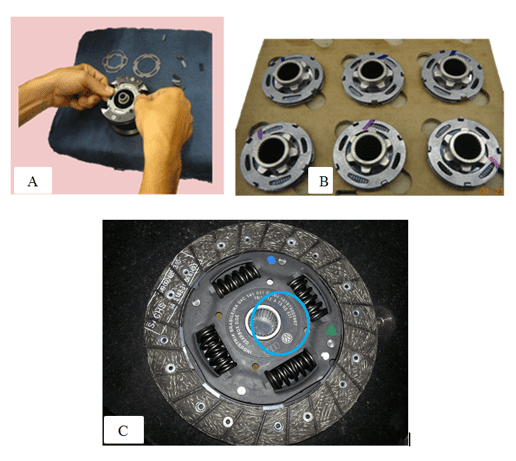
Current state: the pré-amortecimento is completely assembled in a single operation and by a single operator with the use of a mounting device that serves only for support of the components for the final Assembly of the pré-amortecimento.
Pré-amortecimento Assembly torque transmission system: This device is inserted disc 1, disc 1, 2 torsion springs, 2 torsion spring and damping damping pads 4. After this Assembly process of pré-amortecimento, the same is stored in a hive, awaiting the set to finish the Assembly of the clutch disk pré-amortecimento.
The fact that there is no a Poka-yoke, takes the possibility that this Assembly be done backwards. This consequently makes the process vulnerable to failures, leading in this case, the Assembly of the component in the incorrect position.
Opportunities for improvement raised in current state and problem solution:
To eliminate this problem, the tool was used 8 d, following all the steps to achieving success. They are:
STEP 1-the beginning, with the convocation of all involved in the process. Were called the quality supervisor, production supervisor, processes and quality analysts, logistics supervisor, industrial operator, operator of rework, industrial Manager and HR advisor, understanding that for the resolution of the problem it is necessary to presence of all.
STEP 2 – the description of the problem: it was verified the client X clutch disc noise during testing in the vehicle. The set was analyzed by engineering the day 17/01/16, identifying a reversal in the Assembly of the pré-amortecimento springs. This same step, we analyzed all the information given by the client as a means to describe in detail the problem, such as part number, quantity and traceability, turn.
STEP 3-containment Action: this stage secrete all items mounted given the cutting point through traceability, so redoing inspection on all suspects. This procedure took place in 7 steps:
Table 1-Steps from step 3
| Steps | Date | Ação | Proceedings | Results |
| step 1 | 21/01/2017 | Reject and inspect internal stock | 988 disk arrays and segregated 950 pré-amortecimentos. | Not found any pré-amortecimento mounted incorrectly |
| step 2 | 21/01/2017 | Inspect clutch stock in the plant of the supplier X | Were inspected 1,023 clutch disc sets | Segregated 3 disks to be evaluated. The 3 presented problem |
| step 3 | 22/01/2017 | Visually inspect | 100% pré-amortecimento sets. | Were inspected 950 pré-amortecimento and 12 presented with reversed spring. |
| step 4 | 22/01/2017 | Identification of item inspected | Identify with green dot, all inspected | Were identified with green dot, 991 records. |
| step 5 | 22/01/2017 | Ensure that no pré-amortecimento be mounted incorrectly | Auditor perform 100% inspection until the implementation of the solution and guide through the alert | The 100% inspection and passed the alert to the operators |
| step six | 22/01/2017 | Guide operators | Quality alert for all operators are interados with the problem | All operators involved in the process have been alerted |
| step 7 | 22/01/2017 | 100% inspection | Conduct by the Auditors of quality during Assembly of the clutch disk pré-amortecimento inspection | No pré-amortecimento mounted incorrectly |
Source: survey data.
STEP 4 – Ishikawa Tool: the main problem and the noise in idling vehicles, checked through the Ishikawa diagram. The diagram permitted structure hierarchically (graphically and synthetic, allowing a better view) the potential causes of a given problem or opportunity for improvement, as well as their effects on the quality of the products: the results showed that the method was the only cause of non-compliance. (Pre-damping mounted with inverted spring).
STEP 5-5 Why: in this step the default question of the problem, taking advantage of the 5 whys to reach the root cause.
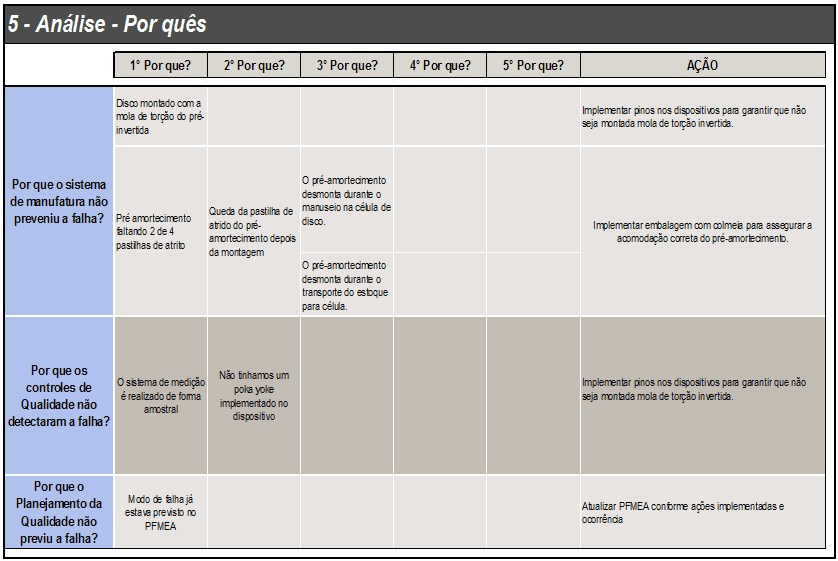
STEP 6-root cause – validation: in this step in general consensus, defined the root cause of the problem based on the previous steps.
-Root cause: installation operation failed pré-amortecimento manual, the torsion springs were mounted inverted.
-Validation: the set that introduced noise was disassembled and evidenced the incorrect mounting.
7-STEP plan of action Stipulated time limit for the general implementation of actions with the status that will be accompanied by the leader of the work.
Table 3 – General action plan
| ACTION | RESPONSIBLE | DEADLINE | STATUS |
| Implement pins on the devices to ensure that is not mounted torsion spring reversed. | Joao-OAE | 27/01/2017 | 1 |
| Implement pré-amortecimento segmented Assembly. | Jose-OAE | 14/02/2017 | 1 |
| Implement packaging with hive to ensure proper accommodation pré-amortecimento. | Felipe-OAE | 20/01/2017 | 1 |
| Update PFMEA as actions implemented and occurrence | John-OAE | 30/04/2017 | 2 |
Source: survey data.
STEP 8-validation and Congratulate the team: from 30/04 the quality and production supervisor validated the effectiveness of 8 d, where accompanied all the actions implemented and they had full conviction through the instances of non-compliance that the effectiveness of the 8 d was given as 100% effective. So the whole team was congratulated for the excellent work done and the effort of everyone in solving the problem.
4. ANALYSIS OF THE DATA AND RESULTS
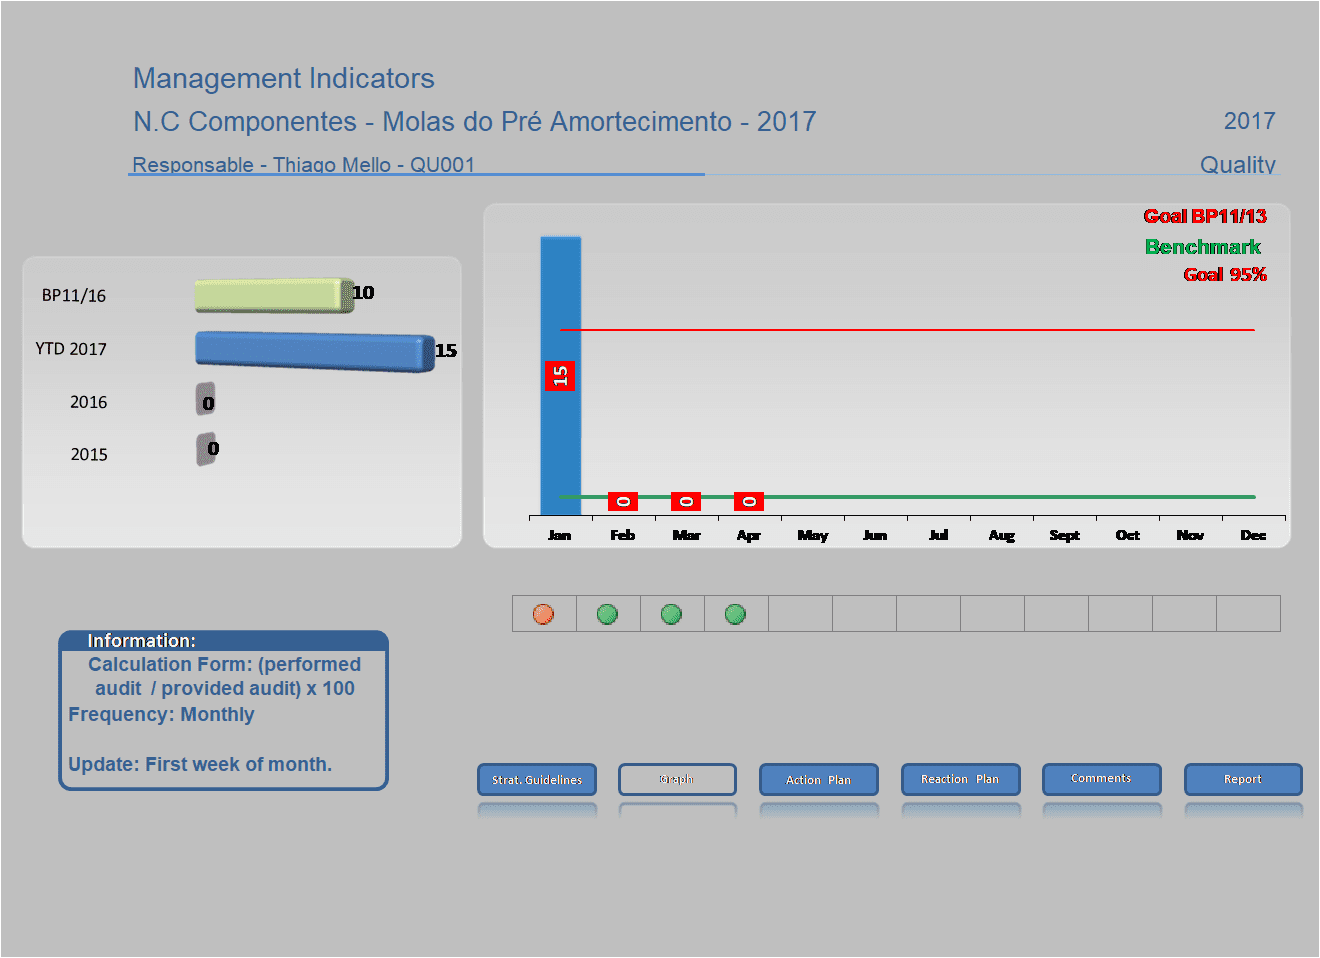
After completion of all steps of the 8 d and implementation of all actions described, the performance of the tool is fully effective, and can be seen through the quality indicator. So in January where the problem occurred, we had an index of 15 issues found, and after the implementation of the 8 d from February noted a fall to 0 problems in subsequent months
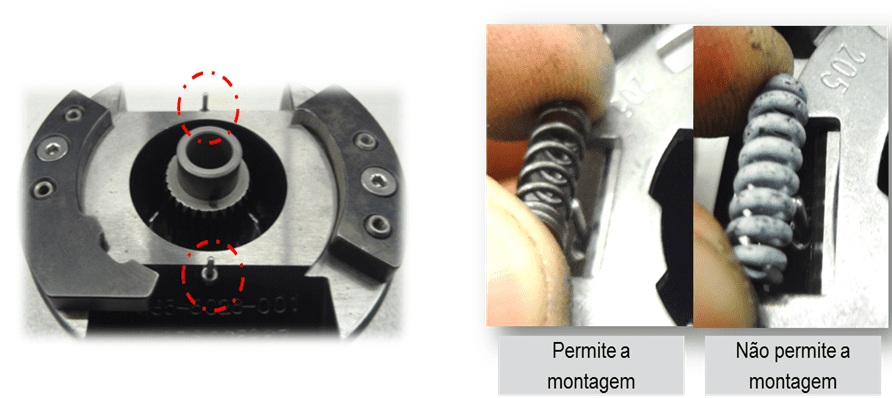
The figure below shows the Assembly device with the implementation of the action, thus making it an error-proof device for mounting of the pré-amortecimento, which ensures that the pré-amortecimento spring is not mounted incorrectly.
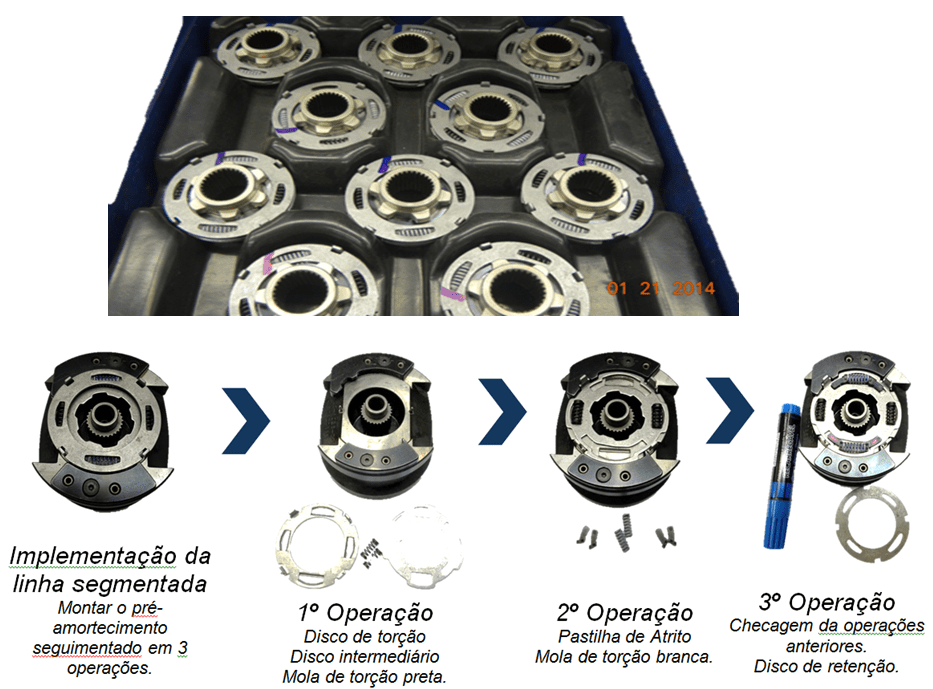
The figure below shows the pré-amortecimento accommodated in a cot with the highest amount of support, so in this way preventing the same risk of dismantling the displacement to the cell.
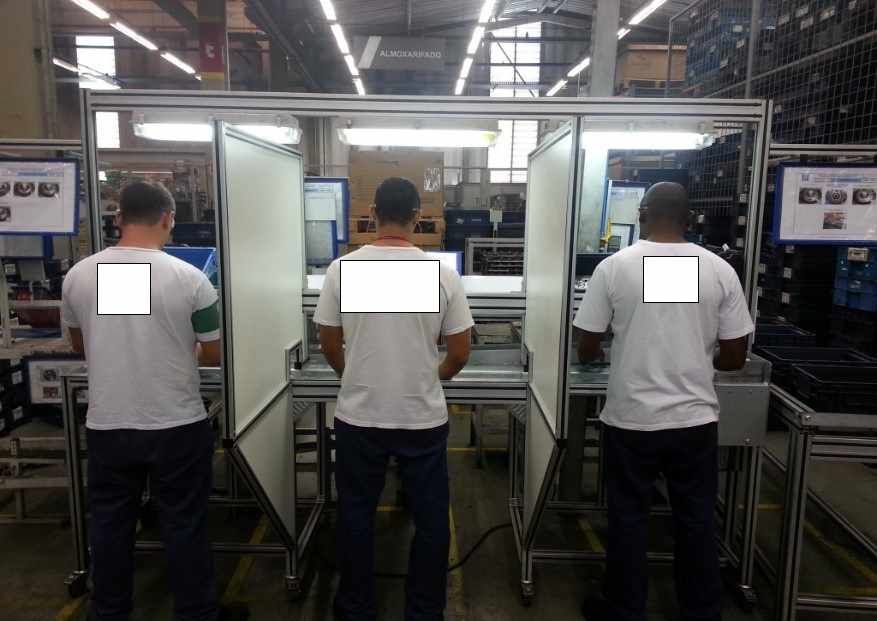
Also note in the figure below, the pré-amortecimento segmented assembly line was implemented, so we have 3 pré-amortecimento mounting operations, where the greater security of the Assembly due to having the third operation being only for the checking of the mounts earlier.
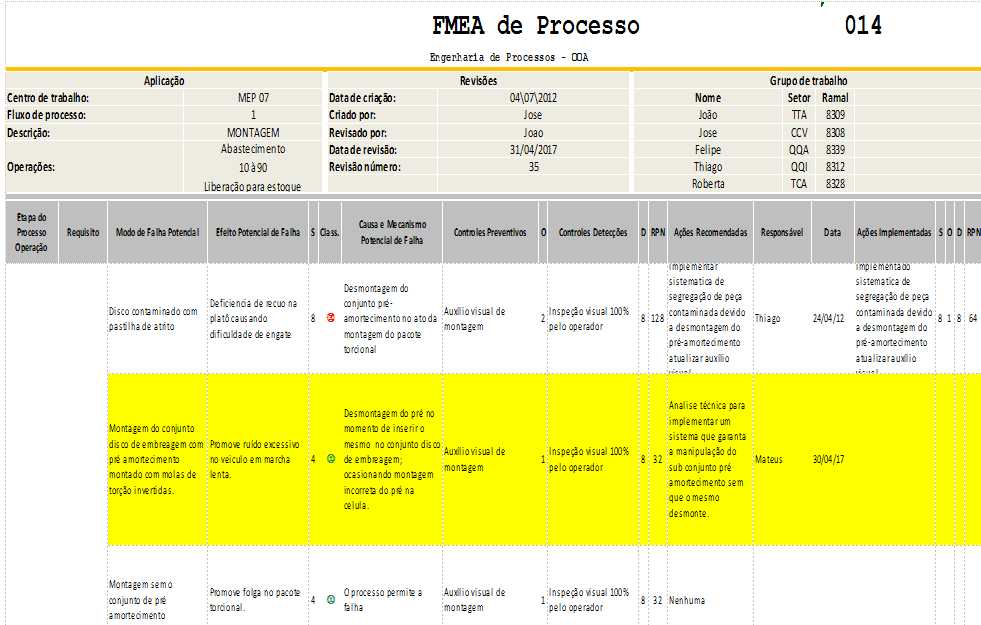
After all actions are completed, we had to update the FMEA process, so adding this new failure mode with their causes and their recommended actions.
In this way the FMEA is updated.
CONCLUSIONS
The application of the methodology 8 d, managed to show the paths to be followed for the solution of the problem, which was the main goal of the company, thus proposing via this method, a quick and effective solution. With the implementation of the tool 8 d produced a very high quality index. It is important to stress that the work reached your goal was to eliminate the problem, reaching the expectation of the company and the client.
Thus we conclude that the effectiveness of this tool aimed at troubleshooting will be used within the company, as a way to solve problems of different areas within the company.
REFERENCES
BEHRENS, R., WILDE, I,; HOFFMANN, m. Complaint management using the extended 8 d-method along the automotive supply chain. Production Engineering, Amsterdam, v. 1, n. 1, p. 91-95, Aug. 2007.
BERGER, d. r. et al. 8 d methodology as a tool for troubleshooting: a conceptual approach. In: INTERNATIONAL FORUM ECOINOVAR-Strategy And INTERNATIONALIZATION Of COMPANIES. 1, 2012, Santa Maria/RS. Anais … Santa Maria/RS: UFSM, 2012. p. 1-14. Available in:< http://ecoinovar.com.br/cd/artigos/eco045.pdf="">. Access in: 20 Apr. 2017.
CAMPAGNARO, c. a. A study on methods of analysis and troubleshooting (Masp) in the supply chain of automotive assemblers. In: NATIONAL MEETING OF PRODUCTION ENGINEERING: the integration of productive chains with the approach of the sustainable manufacture. 28, 2008, Rio de Janeiro, RJ. Anais … Rio de Janeiro, Enegep, 2008. p. 1-14. Available in:< http://www.abepro.org.br/biblioteca/enegep2008_tn_sto_070_501_10707.pdf="">. Access in: 20 Apr. 2017.
Fields, S. T. C. C. et al. Strategy to review and implement continuous improvement of the quality in the production process. In: SYMPOSIUM Of EXCELLENCE In MANAGEMENT And Technology. 8, 2011, Rio de Janeiro. Anais … Rio de Janeiro: Aedb, 2011. p. 1-14. Available in:< http://www.aedb.br/seget/arquivos/artigos11/60014709.pdf="">. Access in: 20 Apr. 2017.
Consul, j. t. application of Poka Yoke in boiler processes. Production magazine, São Paulo, v. 25, n. 3, p. 678-690, Sept. 2015. Available in:<><http: www.scielo.br/scielo.php?script="sci_arttext&pid=S010365132015000300678&lng=en&nrm=iso">.</http:> Access in: 20 Apr. 2017.
COUTINHO, m. et al. Contribution linked to the integrated application of quality tools: the PDCA cycle as the basis for solving problems in production processes. In: SYMPOSIUM on PRODUCTION ENGINEERING, 17, 2010, Bauru, SP. Anais … Bauru: Simpep, 2010. p. available at: 1-7< http://www.simpep.feb.unesp.br/anais_simpep.php?e="4">. Access in: 20 Apr. 2017.
DREXL, h. j. Motor vehicle clutches: function and design. 2. Ed. Landsberg/Lech: Verl. Moderne Industrie, 1998.
GODFREY, A. B. The science of quality. Banas Quality Magazine, São Paulo, v. 10, n. 112, p. 114, set. 2001.
GANDHI SON, M.; Fernandes, f. c. f. lean manufacturing: a review which ranks and analyzes the work of future research perspectives-pointing. Management & production magazine, São Carlos, v. 11, n. 1, p. 1-19, 2004. Available in:< http://www.scielo.br/pdf/gp/v11n1/a02v11n1.pdf="">. Access in: 6 jun. 2017.
GONZÁLEZ, J. C. S.; MARTIN, p. a. c. a contribution to the interpretation of QS 9000. In: NATIONAL MEETING of ENGINEERING PRODUCTION. 18., 1998, Niterói, RJ. Anais … Rio de Janeiro: supported by Abepro, 1998. p. 1-7. Available in:< http://www.abepro.org.br/biblioteca/enegep1998_art017.pdf="">. Access in: 20 Apr. 2017.
LINS, b. f. and basic quality tools. Information science, v. 22, n. 2, p. 153-161, may/Aug. 1993. Available in:< http://basessibi.c3sl.ufpr.br/brapci/_repositorio/2010/03/pdf_2a2179ce6e_0009019.pdf=""> </> . Access in: 20 Apr. 2017.
MARSH, A. M.; Vasconcelos, d. s. c. Use the PDCA cycle and of quality tools in the development of a standard operating procedure (POP). In: SYMPOSIUM on PRODUCTION ENGINEERING, 16., 2009, Bauru, SP. Anais … Bauru: Simpep, 2009. p. 1-12. Available in:< http://www.simpep.feb.unesp.br/anais_simpep.php?e="4">. Access in: 20 Apr. 2017.
MOORE, r. Understand the manufacturing problems before selecting the right tool to fit It. Plant Engineering, Illinois, Chicago, n. 1, p. 17-18. 2007. Available in: < http://www.plantengineering.com/single-article/understand-the-manufacturing-problems-before-selecting-the-right-tool-to-fit-it/725cec707378e9844ea26af72986ec7e.html="">.</ > Access in: 20 Apr. 2017.
NOGUEIRA, l. j. m. Quality Improvement through poka-yoke systems. 2010. 51 f. Dissertation. (Master in metallurgical and materials Engineering)-Faculdade de Engenharia da Universidade do Porto Porto, PT Inapal Plásticos S.A., 2010. Available in:< https://repositorio-aberto.up.pt/bitstream/10216/59614/1/000141304.pdf="">. Access in: 20 Apr. 2017.
PALADINI, e. q. total quality in practice: implementation and evaluation of total quality systems. São Paulo: Atlas, 1994. 211p.
RENO, g. w. s. Application of quality tools for reduction in breakdown of clothespins in a plastic injection. NATIONAL MEETING of ENGINEERING PRODUCTION. 35., 2015, Fortaleza, CE. Anais … Fortress: supported by Abepro, 2015. p. 1-14. Available in:< http://www.abepro.org.br/biblioteca/tn_sto_207_231_26362.pdf="">. Access in: 9 APR. 2017.
TERNER, g. l. k. evaluation of the application of methods of analysis and troubleshooting in a metalworking company. Porto Alegre, 2008. 55 f. Dissertation (master in production engineering)-Graduate program in production engineering, Federal University of Rio Grande do Sul, 2008.
VIDOR, G.; SAURIN, t. a. concepts and features of poka-yokes systems: a literature review. Production Magazine Online, Florianópolis, SC, v. 11, n. 2, p. 344-368,/jun. April, 2011.
WOMACK, J. P.; JONES, D. T. The lean mindset in organizations – eliminate waste and create wealth. Rio de Janeiro: Campus, 1998.
[1] Work supervised by Prof. André Vincent Ricco Lucato. Final project, University of London, 2017.
[2] University of London (UNIARA)