ORIGINAL ARTICLE
MAZZEI, João Roberto Fortes [1], FREIRE, Estevão [2], SERRA, Eduardo Gonçalves [3], MACEDO, José Ronaldo de [4], OLIVEIRA, Angélica Castanheira de [5], BASTOS, Lucia Helena Pinto [6], CARDOSO, Maria Helena Wohlers Morelli [7]
MAZZEI, João Roberto Fortes. Et al. Multiresidue Method for Analysis of 240 Pesticides in Soils of Tomato Planting by Ultra Performance Liquid Chromatography Coupled to Mass Spectrometry. Revista Científica Multidisciplinar Núcleo do Conhecimento. Year 06, Ed. 01, Vol. 08, pp. 34-67. January 2021. ISSN: 2448-0959, Access link: https://www.nucleodoconhecimento.com.br/environmental-engineering-en/multiresidue-method, DOI: 10.32749/nucleodoconhecimento.com.br/environmental-engineering-en/multiresidue-method
ABSTRACT
In this work, an analytical method for the determination of residues for the pesticides-focus was optimized: Azoxystrobin, Boscalide, Carbendazim, Chloranthranilprole, Clothianidin, Diafentiuron, Difenoconazole, Dimetomorfe, Espinetoram, Espinosade A, Espinosade D, Fenurox, Metalaxyl M, Methoxyfenozide, Tiametoxan in soil derived from tomato planting, in order to compare the levels of contamination of these compounds in soil samples. The modified QuEChERS extraction method and Ultra Performance Liquid Chromatography coupled with Sequential Mass Spectrometry were used, with ionization source by Electronebulization in ESI mode (+/-). The method consisted of extracting 15.0 g of soil with 15 ml of saturated calcium hydroxide solution pH 12.3 and 15 ml of acetonitrile, with a consequent partition in the “salting out” effect through 6.0 g of sulfate of anhydrous magnesium and 1.5 g of sodium chloride. The phases were separated by centrifugation at 3700 rpm for 7 min. The extracts were diluted with MeOH licrossolv® grade and injected in a chromatograph. The method was validated based on the parameters of linearity, LOD, LOQ, precision and accuracy. Linearity between 0.2 and 20.0 µg L-1, determination coefficients greater than 0.99. The LOQ values for the method were 13 µg kg-1 for Spinosad and 7.0 µg kg-1 for the other pesticides. The method showed good precision, with RSD values <20%, and accuracy, with recoveries between 70 and 120% for the vast majority of the analyzed compounds. The analytical curves were prepared with reference white soil extracts, in order to minimize the Matrix Effect. The method was considered adequate for the analysis of pesticide residues in soil, since it satisfies the validation parameters of chromatographic methods (European Commission, 2018). After validation, the method was used to analyze the residues of these pesticides in soil samples from conventional, organic and sustainable tomato plantations. Making it possible to compare the levels of environmental impacts generated. In addition to validating the analytical method for the pesticides-focus of the study, it was also possible to validate 240 more compounds, between authorized and unauthorized for use in tomato planting.
Keywords: Contaminants in soils, pesticide residues, QuEChERS, UPLC-MS / MS.
INTRODUCTION
Tomato cultivation is susceptible to the appearance of insect pests and diseases. Data from Carvalho’s research (2017) cite that tomato cultivation is vulnerable to diseases caused by insect pests, being the whitefly (Bemisia), one of the main pests that affect tomatoes. Bemisia argentifolii and Bemisia tabaci, are the two main species of whitefly responsible for causing damage to the cultivation of the fruit. In the author’s work, tomato farmers in the municipality of Cambuci (Rio de Janeiro) were interviewed, in which it was observed that about 60% of planters perform up to two applications of pesticides weekly. In 2% of the cases, the planters described that, depending on the situation, such as: if diseases arise or the weather is rainy, there is a need for a greater number of applications, which can reach three times a week.
Morphologically, there is no difference between the two species. However, the first is more aggressive, since, in addition to presenting greater resistance to adverse environmental conditions and to some conventional pesticides, it has a higher reproduction rate, affects a greater number of host plants and manages to complete its entire life cycle in the tomato. For this reason, it is necessary to use various pesticides to control these and other pests that affect tomato plantations (ESALQ, 2017).
In this work, we chose to use the terminology guided by Brazilian legislation – pesticides – considering that this term, despite not covering in essence all the products used, encompasses the largest number of attributes necessary to describe the substances that make up this universe and adds more transparency and ethics for the reader, the user and the consumer of the products in which such compounds are used (SOBER, 2018).
According to the review of the Brazilian pesticide legislation published on 06/28/2018 (MAPA, 2018):
The term pesticide is not used by any other country or international organization that deals with the topic. The Codex Alimentarius Commission, the international reference organization for food in the World Trade Organization (WTO) Agreement on the Application of Sanitary and Phytosanitary Measures, uses the English and French term “agrotoxic” and the Spanish “plaguicida”. Thus, it is necessary to change the term pesticide to pesticide, in order to align Brazilian legislation with international practices.
The tomato was chosen as the object of this study because of its specific characteristics, that is, plantations such as tomato (Solanum lycopersicum L. = Lycopersicon esculentum Mill), require frequent attention regarding the infestation of pests and weeds, which implies the need to apply pesticides with great frequency.
When in contact with the soil, pesticides are subjected to physical-chemical processes that cause their action in the environment to worsen. Due to the need for rational use of agricultural inputs to minimize the environmental impacts of agriculture, many studies have been carried out with the aim of understanding the behavior of these products in the soil. However, little is known about the behavior of these pesticides in tropical soils.
CONTAMINATION OF SOILS BY AGROTOXIC
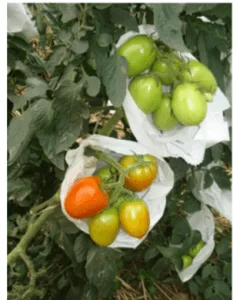
According to the studies by Azevedo (2018), even with greater control over the application of pesticides, the soil is the final destination of chemicals used in agriculture, whether they are applied directly to the soil, to the aerial part of plants or even to fruits bagged. When in contact with the soil, pesticides and herbicides are subject to physical-chemical processes that increase their action in the environment. According to the author, due to the need for rational use of agricultural inputs to minimize the environmental impacts of agriculture, many studies have been carried out with the aim of understanding the behavior of these products in the soil.
The soil acts as a filter, retaining many of the impurities that are poured into it. In this way, its quality can be altered by the accumulation of atmospheric pollutants, use of pesticides / fertilizers, solid waste, toxic and even radioactive materials. When the pollutant reaches the surface of the soil, it can be adsorbed; carried by the wind or runoff waters, or even leached by infiltration waters, reaching the lower horizons and reaching the water table. Once groundwater is reached, these contaminants can be taken to other regions (CETESB, 2020).
The CONAMA provision (2009) informs that the chemical properties of the soil, such as pH, nutrient content, ion exchange capacity, electrical conductivity and organic matter, together with biological activities, are responsible for adsorption, chemical fixation, oxidation and neutralization of these pollutants.
PESTICIDES AND TOMATO CULTURE
The tomato is a fruit native to South America. Historical data indicates that for more than 100 years the tomato was already cultivated by the Incas and Aztecs in high regions of Peru and Mexico. The first countries to cultivate the product were Peru, Mexico, Bolivia, Ecuador and Chile, according to (CURRENCE, 2013). The world’s largest tomato producers today are: China, Brazil, United States, India, Turkey, Egypt, Italy, Iran, Spain and Mexico, according to the FAOSTAT report (2018).
IBGE data (EPAG, 2019), show that Brazil produced 4,084,910 tons in 2018 and that, in January 2019, the production was 4,333,609 tons of the fruit. The regions of greatest production in 2018 were: southeast with 1,689,558 tons (São Paulo produced 811,100 tons) and central-west, with 1,369,014 tons (Goiás produced 1,334,500 tons).
For Junior (2019), there is no tomato resistant to most pests and diseases. For this reason, the most common way to control these infestations continues to be the application of fungicides and insecticides, which causes a risk of contamination of the workers involved, pesticide residues in the fruits, impacts on the environment and higher costs.
In Brazil, ANVISA references (2018) authorize about 500 active ingredients for agricultural, household cleaning, non-agricultural purposes, aquatic environments and wood preservatives. Of this amount, 119 pesticides are authorized for application in the tomato plantation. The same active ingredient can be marketed under the labeling of many formulations and trade names, and a mixture containing more than one ingredient in the same product is common.
Carvalho (2017), in his research, mentions that pesticides are used in the planting of tomatoes with the objective of primarily combating the whitefly, late blight fungi [8], hollow stalk, bacterial wilt, leaf miner, large fruit borer, black spot, bacterial spot and small fruit borer. According to this research, in order to combat such pests and diseases, several applications of pesticides are necessary. The author mentions that the producers referred to 53 different commercial brands and an average of 12 types of pesticides per crop. Insecticides and fungicides are the products most used by the farmer in planting tomatoes, due to a disease called late blight, according to this research.
DESTINATION OF PESTICIDES IN THE ENVIRONMENT
The use of pesticides in conventional tomato cultivation raises constant concerns due to the damage caused to the environment, especially in biotic and abiotic environments. In addition, a number of effects are observed among field workers: weakness, nausea, dizziness, cancers, liver damage, allergies, among others. Thus, it is very important to analyze the fruits, soil and water for the purpose of quantification to verify that they are within the maximum residue limits (MRL[9]) authorized by Anvisa, according to (RIBAS and MATSUMURA, 2009) .
DEVELOPMENT
METHODOLOGY – PREMISES, HYPOTHESES AND STAGES OF WORK
PREMISES
This work started from the following premises:
- There is no tomato resistant to most pests and diseases;
- The soil is the final destination of a large part of the residues from the application of pesticides in the planting methods in which they are applied;
- There is likely contamination of the soil by the application of pesticides in agricultural plantations that can generate environmental impacts in biotic and abiotic environments;
HYPOTHESES
- The pesticides in use in Brazilian agriculture are not environmentally friendly with regard to contamination of fruit and soil;
- Conventional planting with intensive use of pesticides may not be environmentally friendly;
- There is a gap in agriculture, which is the absence of a validated and reliable method for determining and quantifying pesticides in soil, according to the maximum residue limits (MRLs) specified by Anvisa;
- It is possible to use pesticides for planting and keep the fruit at levels of concentration that meet the requirements of the legislation in force in the country;
The knowledge of residues and contaminants in the soil is important for the development of actions to improve handling and control in agricultural production to reduce such contaminants.
STAGES OF WORK
a) Conducting research: application of a questionnaire mix of open answers and multiple choices. This research was applied to the planters in the areas where the samples would be collected and made it possible to survey the main products used in their plantations. These pesticides were identified as “Pesticides-Focus” of the work.
b) Collection of soil samples in areas of three types of cultivation: conventional; organic and sustainable;
c) Collection of blank reference test samples – Samples of soils that have not been subjected to any treatment with the pesticides of interest in this work;
d) Characterization of the soil in terms of texture, fertility and chemical composition – Stage carried out in partnership in EMBRAPA SOLOS-RJ laboratories;
e) Preparation of samples for extraction – the samples must have a 30 mesh (fine earth) granulometry, suitable for chemical extraction – step performed at EMBRAPA SOLOS-RJ laboratories;
f) Analysis of real soil samples collected in the field.
This stage was divided into:
- Soil Characterization – Performed at EMBRAPA SOLOS Laboratories;
- Determination of organic matter – Stage performed at EMBRAPA SOLOS Laboratories;
- Chemical Analysis to determine soil micro-nutrients – Stage performed at FERTIMOVEL Laboratory (EMBRAPA SOLOS);
- Extraction, Clean-up, adequacy and optimization of the QuEChERS Method for determination of pesticide residues in soil samples, through Ultrasonic Liquid Chromatography coupled with Sequential Mass Spectrometry – Step Performed at INCQS laboratories – FIOCRUZ.
g) Calculations, statistical evaluation and plotting of the results obtained.
PESTICIDES SELECTED FOR THE STUDY
In the research carried out with the planters it was observed that the main products used in their plantations were: Abamectin, Acibenzolar-S-Methyl, Azoxystrobin, Ciromazine, Diafentiuron, Mandipropamida, Pimetrozina, Tiametoxan. Thus, it was decided to adapt the analytical method, initially, for the determination of residues of these “pesticides-focus” in soil from the cultivation of tomatoes. The research was carried out with planters from the northern region of fluminense (Rio de Janeiro), a large tomato producer distributed by the three cultivation systems studied in this work (conventional, organic and sustainable).
THE EXTRACTION METHOD (QUECHERS)
The QuEChERS extraction method (Quick, Easy, Cheap, Effective, Rugged and Safe) researched and brought to the scientific community by ANASTASSIADES et al. (2003), aims to eliminate the practical limitations of the multi-waste extraction methods that existed until then. The method has as its main differentials, the fact that it is fast, easy, economical, effective, robust and safe, as the name QuEChERS abbreviates. Diéz et al. (2006) point out that this method was developed for samples that contain more than 75% water.
BIBLIOGRAPHIC SURVEY ON THE QUECHERS METHOD ALLYED TO CHROMATOGRAPHY FOR THE DETERMINATION OF PESTICIDES – CHRONOLOGICAL EVOLUTION
Lesueur et al. (2008) researched changes to QuEChERS in analysis of 105 pesticides by gas chromatography coupled to mass spectrometer (CG-EM) and 46 pesticides by Ultra Performance Liquid Chromatography coupled to Sequential Mass Spectrometry (CLUE-EM / EM) after extraction by QuECheRS method in four matrices (grape, lemon, onion and tomato).
Drożdżyński et al. (2009) researched 3 ecological insecticides (azadiractin, spinosad and rotenone) in soil, cabbage and tomato samples using the modified QuEChERS method, with subsequent determination of the levels by CLUE-EM / EM.
Chen et al. (2010) performed a modification of the QuEChERS method to determine procymidone in soil and leek samples, complementing the work through quantification by GC-MS.
Rashid et al. (2010) analyzed 19 pesticides from the group of organochlorines in soils, applying a modified and clean-up QuEChERS method consisting of liquid-liquid partition with n-hexane. The procedure was validated for the determination of 19 organochlorine pesticides, hexachlorobenzene (HCB), α-HCH, β-HCH, γ-HCH, heptachlor, heptachlor epoxide (trans), aldrin, dieldrin, chlordane (trans), chlordane (cis ), oxychlordane, α-endosulfan, β-endosulfan, endosulfan sulfate, endrin, p, p’-DDT, o, p’-DDT, p, p’-DDD ep, p’-DDE.
Shi et al. (2010) proposed a modified QuEChERS method for the analysis of oxadiargyl residues in soil, water, rice and rice straw samples, with quantification by GC-ECD.
Pinto et al., (2010) researched an even more simplified version of the QuEChERS method in order to analyze three organo-chlorinated compounds (hexachlorobenzene; 1,2-dichlorobenzene and chloroform) in soil samples, followed by quantification by GC-µECD. In the work, the authors used three different types of soils: garden soil, with a high degree of organic matter; a Vertisol, with a high clay content; and a certified reference sedimentary material (clay soil).
Martins (2010) used the QuEChERS method – determination of pesticide residues in irrigated rice crop soil, using quechers modified with saturated solution of calcium hisdroxide and LC-MS / MS for the determination of residues of Clomazona, Fipronil, Imazapique, Imazetapyr, Propiconazole, Thiametoxam and Trifloxystrobin.
Ramos et al. (2010) developed a modified QuEChERS method for the determination of 11 pesticides in three types of soil (forest, ornamental and agricultural). A modified version of the QuEChERS method was developed for the determination of organophosphate pesticides (etoprofos, dimetoate, diazinon, malaoxon, chlorpyrifos-methyl, fenitrion, malation, chlorpyrifos, fenamiphos and fosmet) and a pesticide of the thiadiazine class (buprofezin), determining the levels by GC-NPD.
Drożdżyński et al. (2011), determined 160 pesticides in wines using dispersed solid phase extraction in mixed mode and CG-EM.
Costa (2012) carried out a study of the QuEChERS method for multi-residue determination of pesticides in peaches in syrup. The LOQs of the pesticides in this study varied between 1.0 and 10.0 μg.kg-1 and was based on the curve to monitor the performance of the method and the linearity. According to the author, the analytical curves showed values of r greater than 0.99; with recovery values for drained peaches between 83.4 to 120.4% with RSD less than 14.9% for most analytes, and 68.6 to 124.6% with RSD less than 19.8 %.
Studies by Tsipi et al., (2015) address the quantification of residues of the 2,4-D metabolites, by liquid and gas chromatographies coupled to the mass spectrometer.
Ramos et al. (2016) cite that the QuEChERS method was used only 8 times in the extraction of pesticides in soils, and that in most cases, gas chromatography with Mass Spectrometry (CG-EM) detection was applied, except in three cases, where gas chromatography with Electron Capture detectors (CG-DCE) was applied; Nitrogen and Phosphorus (CG-DNF) and Micro Electron Capture Detection (CG-DμCE).
Dong et al. (2017) determined residues of metaflumizone in soil and cabbage samples, applying the QuEChERS method. The authors report that recovery values between 77.6 and 87.9% were obtained for metaflumizone in soils and cabbage, with a relative standard deviation (RSD) of 3.5 and 7.9%. The LOD and LOQ values of the method for the same samples were 0.001 mg.kg-1 and 0.004 mg.kg-1 respectively.
According to Iglesias (2016), the process of coupling Liquid Chromatography to Mass Spectrometry occurred very slowly, due to the incompatibility between the high flow rates used in the HPLC part, which made it difficult to carry the chromatographic column eluent directly into the source of the spectrometer. , which works in high vacuum. Having resolved these difficulties, Liquid Chromatography with a Mass Spectrometry coupling interface (LC-MS) has been increasingly used as an excellent technique for the determination of various analyte residues.
Ogihara (2018), employed the QuEChERS method and ultra-efficient liquid chromatography coupled with sequential mass spectrometry in the determination of multi-residue pesticides in soil. In their work, the three versions of the QuEChERS method, “Original”, “Acetate” buffer and “Citrate” buffer, were evaluated in the absence and presence of the clean up step in the extraction of pesticides from the soil and the UHPLC-MS / MS with addition internal standard of Triphenylphosphate in their quantification and confirmation. The method developed aimed to correlate certain physical and chemical properties of 20 pesticides selected by the author with their respective time to dissipate them in the environment in the presence and absence of light.
All of these researches ended up in the conclusion that the classic methods for the determination of pesticides in soils are not cost-effective, as they are procedures that require many steps, usually based on the exhaustive extraction of the matrix, with subsequent stages of clean-up for the removal of co-extracted materials, before instrumental analysis.
CHOICE OF SAMPLES FOR THE VALIDATION STEP
The samples used for the validation stage were those from white soil that were not subjected to any treatment with pesticides before and during planting. After chromatographic determination, these samples were free of pesticides, showing no chromatographic signal at retention times similar to those of compounds of analytical interest.
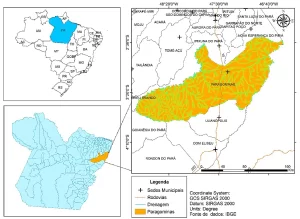
The soil used in the studies was classified as Eutrophic Arenic Hydromorphic Planossolo, belonging to the mapping unit in the municipality of Tanguá, in the municipality of Rio de Janeiro. The region presents a flat to gently undulating relief with a substrate of recent alluvial sediments.
The physical and chemical properties of this soil are: pH water (1: 1) = 4.8; P = 6.0 mg L-1; K = 120 mg L-1; clay = 26%; M.O. = 2.3%; Ca = 5.0 cmolc L-1; Mg = 2.0 cmol L-1; Al = 1.7 cmolc L-1 and SMP index 5.1
REAGENTS, SOLVENTS AND GASES
Acetone P.A .; Acetonitrile – UHPLC; Anhydrous Magnesium Sulfate; Sodium chloride P.A .; PSA – UHPLC; Distilled water; Ultrapure water, purified in Milli-Q-Plus system; Synthetic air 99.9% pure; C18 – Cartridges for SPE; Sodium chloride; Dichloromethane – Ultra Resi-Analyzed; Ethanol-UV-IR-HPLC; Extran neutral; ace argon, analytical, used as collision gas in the CLUE-MS / MS system; Nitrogen gas, used as a desolvation gas in the electrospray source; Methanol– UV-IR-HPLC; Bondesil PSA sorbent, with particle size of 50 μm;
EQUIPMENTS
Marconi Shaker Model M227; Fanem Greenhouse Model F 330; Vortex Shaker IKA Model MS 3 Digital; Precision analytical balance; Metler Toledo; Model XP205; serial number B018030980; Precision analytical balance; SARTORIUS Model SARTORIUS – serial number 71205517; Centrifuge; Eppendorf, Model 5810R; Eppendorf automatic micropipetizers with variable capacity; pH meter Metler Toledo S 220; Milli-Q water purification system manufactured by MilliPore; Liquid chromatograph Waters Acquity Ultraperformance LC; Four Premier Model XE Sequential Mass Spectrometer.
OPTIMIZATION OF THE METHOD – CHROMATOGRAPHIC AND MASS SPECTROMETER CONDITIONS
The analysis was performed using an Acquity UPLC® system coupled to Quattro Premier XE® (Waters Corp., Ma, USA).
Acquity UPLC® system composed of a binary pump, automatic sampler and column oven.
Chromatographic separation was performed on the Waters Acquity BEH UPLC® C18 column (100 x 2.1 mm ID, 1.7 µm). Compositions of the mobile phase A (5 mM ammonium format + 0.01% formic acid, pH 4.00) and mobile phase B (acetonitrile: mobile phase A, 95: 5), gradient: 0-1 min (10% B); 1 to 5.5 min (55% B); 5.5 to 10.5 min (100% B); 12 min (10% B). The flow rate used was 0.3 mL min-1, the oven temperature of the column was 30 ° C, the temperature of the autosampler was 25 ° C. The injector was adjusted for full loop injection of 10 µL and the total execution time was 12 min.
The Quattro Premier XE® mass spectrometer was operated with an electrospray ionization source in positive mode (ESI +). The operational parameters were adjusted for the following conditions: capillary voltage: 3.5 kV; ion source temperature: 120 ° C, desolvation temperature: 450 ° C; cone gas flow (N2): 20 L.h-1; flow of desolvation gas (N2): 500 L.h-1; collision gas flow (Ar): 0.15 mL.min-1. The cone stresses, the collision energies and the quantification and confirmation transitions for each analyte were established from the direct infusion of a solution of 1 µg.mL-1. The infusion of analytes was performed with mobile phases A and B (1: 1), with a flow rate of 0.1 mL.min-1 in full scan mode. After adjusting these parameters, the method for monitoring multiple reactions (MRM) was used, used to identify and quantify analytes.
The choice of the mobile phase, ionization mode (positive ESI), quantification and confirmation transitions were made according to the literature (Aguilera-Luiz et al., 2011; Rubensam et al., 2011) and the chemical characteristics of the analytes. Some of the parameters used in the Quattro Premier XE® system, such as capillary tension; ion source temperature; Desolvation temperature, among others, were established during the calibration of the instrument by the manufacturer. The precursor ions of each analyte were observed by direct infusion. In most cases, the protonated ion [M+ H]+ was observed.
ANALYTICAL STANDARDS
The Analytical Standards of the studied pesticides and Preparation of working solutions (fortification stock solutions)
The analytical standards for the pesticides used were acquired from the AccuStandart Company. Table 1 shows the degree of purity (%) and the class of solid analytical standards used for the development of this work.
Table 1 – Solid analytical standards used at work
| AGROTOXIC | PURITY (%) |
| Azoxystrobin | 99,4 |
| Boscalida | 95,5 |
| Carbendazim | 98,7 |
| Chlorantraniliprole | 98,4 |
| Clothianidin | 96,5 |
| Diafentiuron | 99,9 |
| Diphenoconazole | 100 |
| Dimetomorfe | 98 |
| Espinetoram | 96,8 |
| Spinosad | 96,6 |
| Fenuron | 98 |
| Imidacloprid | 99,5 |
| Indoxacarb | 97,3 |
| Metalaxyl M | 98 |
| Methoxyfenozide | 99,5 |
| Thiamethoxam | 100 |
Source: AccuStandart in New Haven, Connecticut, USA – 2018
With these standards, the stock fortification solution containing the analytes was prepared. This solution is valid for only one month and must be carefully stored in an amber flask, with a bung and a Teflon cap at a temperature of -18ºC, in ultra-cold.
All glassware used in the preparation of solutions and analyzes, such as pipettes, volumetric flasks, beakers, etc., was duly calibrated and identified to avoid volumetric errors in the determinations.
Initially, 10 mL of 1000 mg.L-1 stock analytical solution of each pesticide were prepared. The standards were dissolved in 0.02% Methanol in glacial acetic acid which are the same components of the mobile phase adopted in the liquid chromatography that will analyze the compounds and the stock solutions were stored in amber flasks at a temperature of -18 ºC.
Using the method of successive dilutions, individual analytical solutions were prepared for each pesticide under study, at a concentration of 100 mg.L-1, with the same solvents. From these solutions, a mixture was prepared at a concentration of 10 mg.L-1 containing all pesticides. Finally, from the standard solution 10 mg.L-1, a mixture was prepared at a concentration of 0.200 mg.L-1 containing all the pesticides.
Starting from the 1.0 mg L-1 intermediate mixture, the analytical working solutions were prepared in concentrations of 0.4; 2.0; 4.0; 10.0; 20.0 and 40.0 µg.L-1 containing all pesticides in each concentration for the preparation of the calibration curve of the liquid chromatograph. For injection in the UHPLC-MS / MS system, dilutions were made in the proportion 1: 1 (v / v) of these solutions in mobile phase Methanol / water, so that the final concentrations of the evaluated working solutions were 0.2; 1.0; 2.0; 5.0; 10.0 and 20.0 µg L-1 for all pesticides that make up the fortification stock solution. The dilutions of the analytical solutions in the acidified mobile phase aim to improve the ionization efficiency of the analytes, improving the chromatographic signal, the shape and symmetry of the peaks. These working solutions were used to study the linearity of the method. All solutions were stored in amber bottles and stored at -18 ºC.
VALIDATION OF THE METHOD
The parameterization adopted for the validation of the analytical method consisted of performance verification. Thus, parameters such as: analytical curve and linearity, detection limit, quantification limit, accuracy (recovery) and precision (repeatability and intermediate precision) have become a reference for obtaining reliable results.
DETERMINATION OF THE WHITE REFERENCE SOIL
Due to the complexity of the matrix and the low concentration levels in which the pesticides are found in the soil (order from ppm to ppb), the preparation of the sample was essential to obtain reliable results.
The most difficult step was to obtain a sample of white soil, free of pesticides and that could serve as a zero reference for the studies. This soil was intended to make contamination with pesticides to follow the optimization through the QuEChERS method.
For the verification of white soil, the soil sample coded as A1BR05 was used in two treatments:
TREATMENT 01
In 5 tubes of 50 mL Falcon centrifuge, 15g of soil were weighed and treatment 01 was carried out, based on the original QuEChERS Method: 15g soil + 5 mL H2O; vortex 30 sec, 1 mL Surrogate (Propoxur 1.0 µg / mL); vortex 30 sec; 15 min wait; 15 mL UHPLC grade ACN; Vortex 30 sec; 6g MgSO4 + 1.5g NaCl; Centrifugation (7 min); extraction of the supernatant and dilution with methanol RP 1: 1 for injection in the liquid chromatograph.
The Propoxur 1.0 µg.mL-1 solution (Surrogate) was used as a marker. If the white chromatogram appeared without peaks, it was necessary to ensure that the system showed sensitivity to the compounds, and propoxur was the compound that brought that certainty.
TREATMENT 02
It was also tested a treatment with the modified method with Calcium Hydroxide solution with pH = 12.6, in order to obtain a better backgroud of the samples with respect to the soil matrix as follows:
In 5 tubes of 50 mL Falcon centrifuge, 15 g of soil were weighed and the treatment was carried out 02 – 15 g soil + 5 ml H2O; vortex 30 sec; 1 mL Surrogate; vortex 30 sec; 5 mL of Ca(OH)2 pH 12.6 solution; 5 min wait; 15 mL UHPLC grade ACN; vortex 30 sec; 6g MgSO4 + 1.5g NaCl; centrifugation (7 min); extraction of the supernatant and dilution with methanol RP 1; 1 for injection in the liquid chromatograph.
The soil samples A1BR05 were shown to be free of pesticides in both treatments. From this stage, the sample A1BR05 became the reference white soil of this work.
The two previous treatments were used for soil samples named with the fortification solution containing the analytes of interest.
The method was initially optimized for the extraction of pesticides-focus: Azoxystrobin, Boscalide, Carbendazim, Chloranthranilprole, Clothianidin, Diafentiuron, Diphenoconazole, Dimetomorfe, Espinetoram, Espinosade A, Espinosade D, Fenuron, Imidacloprido, Methoxyzone soil samples from tomato cultivation, followed by determination by UHPLC-MS / MS (Ultra Performance Liquid Chromatography), which requires the matrix to be clean, minimizing background interferences (matrix effect – backgroud). Thus, treatments 1 and 2 were the starting points for extracting these pesticides from the soil matrix.
In both treatments the extracts were very clear. Even so, fractions of each of the aforementioned tests were tested in a dispersive clean-up stage. In this stage, a dispersive extraction in the solid phase of the cleaning of the PSA was tested, generating 4 more treatments, totaling 8 different tests.
The extract was filtered through a PTFE membrane and then 1 ml of extract was transferred to a volumetric flask, dissolved with 1 ml of Methanol and this final solution was transferred to a chromatographic flask. From this point on, 5 microliters of each sample were injected in duplicate into the ultra performance liquid chromatograph coupled to the mass spectrometer. The tests were performed in duplicate and the results are plotted in table 2
Table 2 – Results of treatments 1 and 2 of the analysis of pesticides-focus by ultra-performance liquid chromatography
| Active principle | Recovery Factor without clean-up (%) | Recovery factor after clean-up (%) | ||
| Treatment 01 | Treatment 02 | Treatment 01 | Treatment 02 | |
| Abamectin | 88/115 | 65/70 | 97,5 | 115 |
| Diafentiuron | 43/37 | 67/72 | 53 | 81,2 |
| Azoxystrobin | 101/100 | 93/94 | 162,5 | 160 |
| Pymetrozine | 30/28 | 81/75 | 30 | 120 |
| Acibenzolar-S-Methyl | 138/131 | 36/38 | 162 | 47,5 |
| Mandipropamide | 108/109 | 110/102 | 180 | 162 |
| Ciromazine | 60/61 | 81/80 | 95 | 125 |
| Methomyl | 108/116 | 107/105 | 177 | 225 |
| Pymetrozine | 30/28 | 81/75 | 45 | 120 |
| Acetamiprido | 103/104 | 99/103 | 167 | 155 |
| Buprofezina | 98/97 | 96/96 | 167 | 166 |
| Lucifenuron | 68/67 | 64/63 | – | – |
| Thiamethoxam | 104/98 | 70/69 | 165 | 112 |
Source: Authors’ elaboration
Treatment with calcium hydroxide solution (pH = 12.3) showed better recovery factors for most analytes, except for Acibenzolar-S-Methyl, which did not recover well in any of the treatments. This is possibly due to the methylation of the sulfur compound structure, which makes it difficult to extract it in acetonitrile. Thus, the validation continued based on treatment 02.
FORTIFICATION TESTS FOR ASSESSING THE ACCURACY OF THE METHOD
For the study of the accuracy of this analytical method, fortification tests were carried out with the objective of verifying the recovery factor of the compounds under study. Thus, five fortifications of the “reference white” samples were carried out at two different levels of concentration, totaling 10 tests.
Each level of fortification was injected twice, totaling an n = 10 (5 extractions x 2 injections).
For the extraction procedure of the modified QuEChERS method, 15.00 g of homogeneous soil were weighed in polypropylene tubes (Falcon type), with a screw cap (50 mL capacity). Then, each sample was moistened with 5 ml of Milli-Q water and stirred vigorously for 30 seconds in Vortex. Fortification was added at both levels, using calibrated pipettes of 0.5 mL and 1.0 mL, in concentrations: 0.200 µg.mL-1 for all pesticides contained in the fortification solution.
After fortification, the samples were homogenized by vortexing for 30 seconds and maintained at 20 ºC for 15 minutes. Research by PINTO et al. (2010), indicate that it is essential that there is enough time for the sample with the analytes for the solvent to evaporate and, thus, there is greater interaction between the compounds and the matrix. According to the author, this step brings the test closer to the reality of interaction that occurs with samples in the field.
Then, with the aid of a volumetric pipette, 5 mL of saturated calcium hydroxide solution, pH 12.3, in each tube, and after closing them, vortexing was performed for 30 seconds. Letting it react for 10 minutes, at rest. Then, 15 ml of Lichrosolv grade acetonitrile (for residue analysis) was added to each tube and stirred again for 30 seconds.
1.5 sodium chloride (NaCl) and 6.0 g of MgSO4 (anhydrous magnesium sulfate) were added to each tube and vortexed for an additional 30 seconds, in order to obtain the greatest possible interaction between the extract liquid and solid reagents. Finally, the tubes were taken to centrifugation for 7 minutes at 3000 rpm.
In a vial with a capacity of 2 mL, a 1: 1 (v / v) dilution was performed, in which 1.0 mL of the extract obtained after extraction and 1.0 mL of the mobile phase were added, followed by analysis by LC-MS / MS.
Finally, dilutions of the final extracts were carried out in the proportion 1: 1 (v / v) in mobile phase (ultrapure water). Compound recovery was evaluated at concentrations of 1 and 2 µg.kg-1 of soil for all pesticides in the fortification solution.
The recovery results were interesting in both treatments. However, treatment 02 proved to be more effective in extracting a greater number of pesticides, with recoveries in the range of 64 to 110%, with the exception of Acibenzolar-S-Methyl, whose recoveries were more expressive in treatment 1.
The results of the experiments to evaluate the best extraction and cleaning method are shown in Table 1 – Tests carried out to optimize the extraction step.
The clean-up stage did not show any significant improvement in results. Thus, it was decided to proceed to the validation stage using treatment 02 without the clean-up stage.
OPTIMIZATION OF THE METHOD
The extraction method was optimized according to the Analytical Quality Assurance Guide. The values established in this manual meet the requirements of Decision 2018/657 (European Commission / SANTE, 2018).
The following parameters were evaluated: selectivity; matrix effect; linearity; recovery; detection limit (LOD); limit of quantification (LOQ) and repeatability. The calculations were performed using MassLynx® and Microsoft Excel® software. In the proposed method, selectivity was evaluated through the analysis of five replicates of the sampling extracts of tomato soils. The linearity assessment involved plotting an analytical solvent curve from the MIX 1 working solution containing the 295 analytes, with five points corresponding to 0, 0.5, 1.0, 1.5 and 2.0 times the MRL established for each analyte. The Cochran test was used to assess the homogeneity of the variations obtained for each concentration level. The calibration data were evaluated by common linear regression in case of homoscedasticity or weighted linear regression in case of heteroscedasticity.
For the extraction of the samples, the same reference soil from the initial tests was used. In the proposed method, selectivity was assessed by analyzing five replicates of the sampling extracts from the tomato plantation soil. In 10 centrifuge tubes, type Falcon, 15 g were weighed and 1mL of the working solution was added. In tubes numbered 1 and 5, 1mL of the fortification solution was added with level 1 working solutions in each tube, and in tubes numbered 6 to 10, 1mL of the fortification solution was added with level 2 working solutions. in each tube, in addition to a blank test tube, without fortification, with propoxur quality control. The 11 tubes received all the steps that were used in treatment 2, and afterwards, 1 ml of the extract was transferred to a flask and 1mL of MeOH (component of the mobile phase) was applied. Then, 5µL was injected into the Ultra Performance Liquid Chromatograph coupled to the sequential mass spectrometer, under the same conditions adopted for tests 3 and 4 of treatment 2. Each sample was injected in quintuplicate, as recommended in Guia Sante (2018) for validation of chromatographic methods.
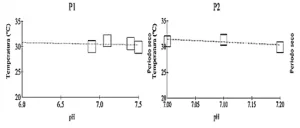
The matrix effect was evaluated by comparing the slope of the analytical curve in the matrix extract with the slope of the analytical curve in the solvent, using the F test (Fisher Snedecor). Then, the Student’s t-test was applied to determine the statistical equivalence between the slopes of the analytical curves in the solvent and in the matrix.
The LOD and LOQ were calculated using the signal / noise ratio of the equipment. LOD was the concentration equivalent to three times the noise and LOQ was the concentration equivalent to six times the noise. The recovery and repeatability of the method were performed with soil samples with peaks of two levels: 0.5 to 1.0 equivalent to 5 times the MRL of each analyte, with five repetitions for each level. Mean recovery and relative standard deviation (RSD) were calculated for each level. Sample analysis. The field samples were kindly provided by producers in the state of Rio de Janeiro, Brazil, and were analyzed using the validated method.
The QuEChERS method modified with calcium hydroxide showed better recovery results than the original QuEChERS method for most analytes, mainly for Abamectin, Acetamipride, Azoxystrobin, Buprofezine, Diafentiuron, Mandipropamide, Pymetrozine, Cyromazine, Metomil, Pimetrozine, Luciamenuron and. With the modified method (QuEChERS method with Ca (OH) 2), the recovery values obtained were within the acceptable range of 70-120% (ANVISA, 2018). Treatment 2 had only one recovery result outside the acceptable range of 80-110%, Acibenzolar-S-Methyl (37%). The clean up step with dispersive SPE did not promote significant improvements in recoveries. The SPE cleaning step ended up not being necessary because the first extract obtained was clear and presented acceptable recoveries for the compounds of interest, as shown in Table 2.
Therefore, the extraction method chosen to follow the validation process was the method based on treatment 2 (QuEChERS with calcium hydroxide) without the SPE clean up step, using MgSO4, PSA and C18.
The accuracy was calculated using the following Equation and was expressed as a percentage of recovery (INMETRO, 2007):
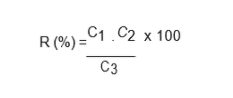 Where:
C1 = Concentration determined in the fortified sample;
C2 = Concentration determined in the non-fortified sample;
C3 = Concentration used for fortification.
There was no interference in the same m / z and retention time of the analytes in the five repetitions performed with the matrix extract. Thus, it was possible to obtain the selectivity of the method. The worksheet for the evaluation of the analytical curve – Validation of the multiresidue method by CLUE-EM / EM is shown in Figure 1.
Figure 3 – Data on the evaluation of the analytical curve – Validation of the multiresidue method by CLUE-EM / EM

The performance characteristics of the optimized method, the working range, the values of the Coefficients of correlation (r) and determination (R2) for analytical curves obtained for each analyte are shown in Table 3.
Table 3 – Summary of evaluation results – Correlation (r) and determination (R2) coefficients
| Substance | VALIDATION OF THE ANALYTICAL CURVE | |
| r | R2 | |
| Azoxystrobin | 0,9995 | 0,9989 |
| Boscalida | 0,9982 | 0,9964 |
| Carbendazim | 0,9996 | 0,9993 |
| Chlorantraniliprole | 0,9996 | 0,9991 |
| Clothianidin | 0,9963 | 0,9925 |
| Diafentiuron | 0,9993 | 0,9986 |
| Diphenoconazole | 0,9988 | 0,9975 |
| Dimetomorfe | 0,9991 | 0,9982 |
| Espinetoram | 0,9973 | 0,9947 |
| Spinosad | 0,9987 | 0,9974 |
| Fenuron | 0,9986 | 0,9973 |
| Imidacloprid | 0,9995 | 0,9990 |
| Indoxacarb | 0,9981 | 0,9961 |
| Metalaxyl M | 0,9998 | 0,9997 |
| Methoxyfenozide | 0,9969 | 0,9939 |
Source: Authors’ elaboration
The matrix effect was not evaluated for soil validation, being considered significant for all studied pesticides.
All the analyzed substances presented a homoscedastic behavior in the working range of 0.0032 to 0.0500 µg / mL.
It is observed that for most analytes, the determination coefficients (r2) were close to one, showing good linearity, indicating a homoscedastic dispersion profile (constant variation of experimental errors for different observations) for most analytes, allowing that the standard curves were evaluated by linear regression using the method of ordinary least squares. The weighted linear adjustments (1 / x) were made using the MassLynx® software. The Student-t values calculated for the matrix effect were within the values required by the SANTE Guide for most analytes. Thus, the curve in the matrix extract was used to quantify the samples, including analytes in which the matrix effect was not observed. The values obtained for LOD and LOQ, as well as the signal / noise ratio (Table 4), met the criteria established by the National Health Surveillance Agency (ANVISA, 2018) for these analytes, confirming that the optimized method is adequate to comply with current legislation in Brazil. However, in order to comply with European legislation, the LOD and LOQ obtained need to be revised, as they are very close to the maximum level established (EUROPEAN COMMISSION, 2018).
Table 4 – Substances validated in the soil matrix, with the respective quantification limits and the corresponding signal / noise ratio
| Substance | VALIDATION OF THE ANALYTICAL CURVE | |
| LOQ (mg/kg) | Razão Sinal/Ruído | |
| Azoxystrobin | 0,0066 | 538,39 |
| Boscalida | 0,0076 | 30,11 |
| Carbendazim | 0,0055 | 166,53 |
| Chlorantraniliprole | 0,0075 | 276,84 |
| Clothianidin | 0,0064 | 496.4 |
| Diafentiuron | 0,0038 | 72,37 |
| Diphenoconazole | 0,0077 | 38,83 |
| Dimetomorfe | 0,0072 | 27,62 |
| Espinetoram | 0,0074 | 10729,08 |
| Spinosad | 0,0078 | 1757,72 |
| Fenuron | 0,0080 | 1630,64 |
| Imidacloprid | 0,0132 | 207,19 |
| Indoxacarb | 0,0062 | 171,61 |
| Metalaxyl M | 0,0072 | 1104,23 |
| Methoxyfenozide | 0,0074 | 327,56 |
Source: Authors’ elaboration
It was possible to establish the LOQ for substances at the validated fortification level, as they had a signal / noise ratio greater than 10.
ACCURACY (RECOVERY RATE) AND ACCURACY (REPETIBILITY)
For the study of the rate of recovery and repeatability the soil sample A1BR05 was fortified with different volumes of the stock solution of fortification, composing a mixture of the pesticides of interest, in five replicates, after the extraction the volume of 1 mL was removed and diluted 1: 1 with methanol (MeOH) for further chromatographic analysis by UHPLC-MS / MS. This concentration of fortification corresponds to the theoretical concentration of LQ. Each replicate was injected twice.
Injection concentrations:
– Level 1: 0.00323 µg / mL, which corresponds to 0.0067 mg / kg,
– Level 2: 0.00625 µg / mL, which corresponds to 0.0133 mg / kg,
The results obtained from the accuracy – recovery are described in Table 5.
Table 5 – Results obtained from accuracy – Recovery
| Substance | VALIDATION OF THE ANALYTICAL CURVE | ||||
| Level 1 | Level 2 | ||||
| Conc. (mg kg-1) | Rec. (%) | Conc. mg kg-1) | Rec. (%) | ||
| Azoxystrobin | 0,0066 | 95,4 | 0,0142 | 106,3 | |
| Boscalida | 0,0076 | 111,5 | 0,0149 | 110,5 | |
| Carbendazim | 0,0055 | 80,4 | 0,0125 | 94,2 | |
| Chlorantraniliprole | 0,0075 | 109 | 0,0153 | 114 | |
| Clothianidin | 0,0062 | 92,1 | 0,0146 | 109,9 | |
| Diafentiuron | 0,0038 | 53,7 | 0,0042 | 32,5 | |
| Diphenoconazole | 0,0077 | 112,2 | 0,0148 | 111 | |
| Dimetomorfe | 0,0072 | 105,4 | 0,015 | 111,5 | |
| Espinetoram | 0,0074 | 103,5 | 0,0149 | 111,5 | |
| Spinosad | 0,0078 | 114,4 | 0,0159 | 118,9 | |
| Fenuron | 0,008 | 115,9 | 0,016 | 119,4 | |
| Imidacloprid | 0,0063 | 92,1 | 0,0143 | 106,4 | |
| Indoxacarb | 0,0062 | 90,3 | 0,0135 | 101 | |
| Metalaxyl M | 0,0072 | 105,1 | 0,0155 | 116,6 | |
| Methoxyfenozide | 0,006 | 88,1 | 0,0146 | 109,6 | |
Source: Authors’ elaboration
The recovery results are within the acceptable range (70-120%). The method showed good repeatability for most of the studied compounds, with RSD values below 20%.
All compounds studied met the criteria recommended by the European Commission (2018), except the pesticide Diafentiuron, because it did not provide recovery in the acceptable range (70% to 120%) at either level, making its validation impossible.
After validation, the method was used for the quantitative determination of the pesticide content in soil samples collected in the regions where the tomatoes are planted. The results obtained are plotted in Table 6 below:
Table 6 – Summary of the results of the actual soil samples collected in the tomato planting areas (mg / kg of soil)
| Pesticide | P1 | P2 | P3 | P4 | P5 | P6 | P7 |
| 1. Azoxystrobin | 0,003 | 0,0025 | 0,009 | 0,06 | |||
| 3. Boscalida | Traços | ||||||
| 4. Carbendazim | Traces | 0,0085 | |||||
| 5. Clomazone* | |||||||
| 6. Chlorantraniliprole | 0,036 | X | 0,071 | 0,223 | |||
| 7. Clothianidin | 0,027 | X | 0,0185 | ||||
| 8. Diafentiuron | 0,0255 | X | |||||
| 9. Diphenoconazole | 0,003 | 0,038 | 0,0285 | ||||
| 10. Dimetomorfe | 0,0105 | 0,48 | 0,096 | 0,0275 | |||
| 11. Espinetoram | X | X | |||||
| 12. Spinosad A | 0,002 | ||||||
| 13. Spinosad D | X | X | |||||
| 14. Fenuron | X | Traces | X | Traces | X | X | |
| 15. Imidacloprid | X | Traces | 0,008 | 0,006 | |||
| 16. Indoxacarb | 0,0235 | 0,0015 | |||||
| 17. Metalaxyl M | Traces | Traces | 0,0085 | 0,024 | 0,001 | ||
| 18. Methoxyfenozide | 0,1415 | 0,0105 | |||||
| 19. Thiamethoxam | 0,0315 | 0,0225 | 0,0255 |
Note: P1 to P6 (Tomato Planting Areas) Source: Prepared by the authors.
Pesticide residues were found in Table 6. The pesticide fenuron was found in all soil samples, except in areas P1 and P2. This pesticide is one of those excluded or not registered in Brazil, as shown in table 7. However, the concentrations of this compound found in the samples were classified as traits, that is, below the detection limit by the analytical method.
Regarding the pesticides azoxitrobin and carbendazim, the situation in areas 6 and 7 is worrying, especially since these pesticides are not authorized by ANVISA for application in tomato planting, as shown in Table 7.
Table 7 – Concentrations of UNAUTHORIZED pesticides for application to tomatoes found in the analyzed soils
| Pesticide | P6 | P7 | ||||
| 5-10 | 10-20 | 10-20 | 0-5 | 5-10 | 10-20 | |
| 1. Azoxystrobin | 0,0090 | 0,0035 | 0,006 | 0,060 | 0,012 | 0,003 |
| 2. Carbendazim | 0,0065 | 0,0065 | 0,0045 | 0,0085 | 0,003 | 0,002 |
Source: Authors’ elaboration
The optimized multiresidue method proved to be selective and precise in the studied range, allowing the simultaneous analysis of the substances: Azoxystrobin, Boscalide, Carbendazim, Chloranthraniliprole, Clothianidin, Diphenoconazole, Dimetomorfe, Espinetoram, Espinosade A, Espinosade D, Fenuron, Imidacloprido, Indalaxide, Indalaxide M, Methoxyfenozide, Tiametoxan, with their respective limits of quantification (LOQ), included in the official Brazilian tomato monitoring program, as shown in Table 8
Table 8 – LOQS for pesticides-focus: µg kg-1
| Pesticide | LOQ (µg kg-1) |
| Azoxystrobin | 7,0 |
| Boscalida | 7,0 |
| Carbendazim | 5,0 |
| Chlorantraniliprole | 7,0 |
| Clothianidin | 7,0 |
| Diafentiuron | 7,0 |
| Diphenoconazole | 7,0 |
| Dimetomorfe | 7,0 |
| Espinetoram | 7,0 |
| Spinosad | 7,0 |
| Fenuron | 7,0 |
| Imidacloprid | 13,0 |
| Indoxacarb | 7,0 |
| Metalaxyl M | 7,0 |
| Methoxyfenozide | 7,0 |
Source: Authors’ elaboration
FINAL CONSIDERATIONS
The QuEChERS method, with minor alterations, was suitable for the extraction of multi-residues from the analytes in soils from the planting of, with clear extracts and free from interference. Ultra-resolution liquid chromatography coupled with sequential mass spectrometry (UPLC-MS / MS) was adequate for the detection and quantification of these analytes in the matrix, with recovery values between 70 and 120% standard deviation less than 20%, limits of quantification between 7 and 13 µg.L-1 and quantification limits between 2 and 4 µg.L-1, appropriate to comply with current legislation. The results of the field test showed that the method is suitable for quantitative analysis of pesticides evaluated in soils derived from tomato planting within the working range.
The validated method is in accordance with the values suggested in the literature for the analysis of pesticide residues by chromatographic methods (EUROPEAN COMMISSION, 2018). The determination of the pesticides under study by UHPLC-MS / MS was satisfactory, allowing the performance of a qualitative analysis, obtained from fragments of mass characteristic of each analyte, and quantitative, through the MRM acquisition mode. The chromatographic conditions optimized for determination by UHPLC-MS / MS allowed the identification and quantification of the compounds under study, in an analysis time of less than 15 min, which contributes with a great gain as an analytical tool and for society as a whole.
In general, all samples showed concentrations of pesticides allowed by ANVISA monographs. However, the results obtained for conventional planting, despite being within the required conformities, are higher than the values obtained for plantations of the sustainable and organic system. However, it serves as an alert for the presence of pesticides on society’s table.
The use of pesticides Azoxystrobin and Carbendazim (unauthorized pesticides) for application in tomatoes brings concrete concern with something that was normally expected, deliberate use of pesticides to increase production, regardless of what the Laws recommend.
If, on the one hand, it is worrying to find unauthorized pesticides in the samples, on the other hand, this demonstrates that the method validated by this work is highly effective, due to the ability to quantify even pesticides not authorized for use.
In addition to achieving quite satisfactory results for the pesticides-focus, this work proved to be capable of determining residues for 240 pesticides, between authorized and unauthorized by ANVISA in Brazil, with determination coefficient values greater than 0.99; LOQ values of 13 µg kg-1 for Spinosad and 7.0 µg kg-1 for the other pesticides. The method showed good precision, with RSD values <20%, and accuracy, with recoveries between 70 and 120% for the vast majority of the analyzed compounds.
REFERENCES
AZEVEDO, E. de – Alimentos Orgânicos: ampliando conceitos de saúde humana, ambiental e social, Livros G.Play, 2018.
ANASTASSIADES M, Lehothay S.J, Stajnbaher D, Schenck F.J. Fast and easy multiresidue method employing acetonitrile extraction/partitioning and “dispersive solid-phase extraction” for the determination of pesticide residue in produce. J. AOAC Int. 86: 412-431, 2003.
ANVISA – Agência Nacional de Vigilância Sanitária. Disponível em: <http://portal.anvisa.gov.br> 2014. Acesso em: 11 de outubro de 2018.
ANVISA – NOTA TÉCNICA 02/2017 – Posicionamento da Anvisa referente à Recomendação 028/2016 aprovada em Reunião Plenária do Conselho, 2017
CARDOSO, Maria Helena Wohlers Morelli; GOUVÊA, Adherlene Vieira; NÓBREGA, Armi Wanderley da; ABRANTES, Shirley de Mello Pereira – Validação de método para determinação de resíduos de agrotóxicos em tomate: uma experiência laboratorial – Ciência e Tecnologia de Alimentos, Campinas, 30 (Supl.1): 63-72, maio 2010.
CARVALHO, C.R.F., PONCIANO N.J.; SOUZA P.M. de. – Viabilidade econômica e de risco da produção de tomate no município de Cambuci/RJ, – Ciência Rural, Brasil, 2014.
CETESB (Companhia Ambiental do Estado de São Paulo) – Qualidade do solo, 2020. Disponível em: https://cetesb.sp.gov.br/solo/poluicao/ – Acessado em 09/2020.
COMMISSION DECISION No. 657/2002. Implementing Council Directive 96/23/EC concerning the performance of analytical methods and the interpretation of results. Off. J. Eur. Commun. L 221: 8-36.
COMMISSION REGULATION (E.C). No. 1881/2006. Setting maximum levels for certain contaminants in foodstuffs. Off. J. Eur. Commun. L364: 5-24.
CONAMA – Resolução nº 420/2009 – Disposição sobre critérios e valores orientadores de qualidade do solo quanto à presença de substâncias químicas e suas providências. Disponível em: < http://www.mma.gov.br/port/conama/legiabre.cfm?codlegi=620> Acesso em: 02 jan. 2019.
CURRENCE, T.M. Tomato breeding. I. Species, origin and botanical characters. Handbuch der Pflanzenzuchtung, p. 351-369, 2013.
DIEZ, C.; TRAAG, W. A.; ZOMMER, P.; MARINERO, P.; ATIENZA, J.; J. – Extraction and chromatographic analysis of the cadusafós nematicide, chromatography, 1131, 1135 – 2006.
DONG, H.; XIAO, K. – Modified QuEChERS combined with ultra high performance liquid chromatography tandem mass spectrometry to determine seven biogenic amines in Chinese traditional condiment soy sauce – Food Chemistry, Volume 229, Pages 502-508 – Elsevier, 2017.
DROŻDŻYŃSKI, D.; KOWALSKA, J. – Rapid analysis of organic farming insecticides in soil and produce using ultra-performance liquid chromatography/tandem mass spectrometry, Springer, Talanta, 2009.
DROŻDŻYŃSKI , D.; WALORCZYK, S.; GNUSOWSKI , B – Multiresidue determination of 160 pesticides in wines employing mixed-mode dispersive-solid phase extraction and gas chromatography–tandem mass spectrometry, Volume 85, Issue 4, Talanta – Elsevier, Pages 1856-1870, 2011.
ESALQ – Simpósio de defensivos agrícolas: tópicos relevantes e principais desafios, ESALQ / 2017
EUROPEAN COMMISSION – Directorate General for Healph and Food Safety, 2017.
EUROPEAN COMMISSION – Directorate General for Healph and Food Safety, 2018.
EMBRAPA – Manual de Procedimentos de Coleta de Amostras em Áreas Agrícolas para Análise da Qualidade Ambiental: Solo, Água e Sedimentos, 2016.
EPA (Environmental Protection Agency) – Pesticide safety for farmworkers, 2017.
FAOSTAT – Food and Agriculture Organization of the United Nations – Produtividade Mundial, 2018. Disponível em: <http://faostat.fao.org/site/340/default.aspx>. Acesso em. 28 de novembro de 2019.
FERNANDES V.C, LEHOTAY S.J, GEIS-ASTEGGIANTE L, KWON H, Mol H.G.J, van der Kamp H, MATEUS N, DOMINGUES V.F, DELERUE-Matos, C. Analysis of pesticides residues in strawberries and soils by GC-MS/MS, LC-MS/MS and two dimensional GC-time-of-flight MS comparing organic and integrated pest management farming. Food Addit Contam. 31: 262-270, 2014.
IARC. INTERNATIONAL AGENCY FOR RESEARCH ON CANCER. WHO. World Health Organization. IARC Monographs on the Evaluation of Carcinogenic Risks to Humans. 82: 183-193, 2002.
IBAMA-Ministério do Meio Ambiente: Avaliação do Potencial de Periculosidade Ambiental (PPA) de Agrotóxicos e Afins. Disponível em: Acesso em: abr. 2020.
IBGE – Indicadores / Estatística da Produção Agrícola Levantamento Sistemático da Produção Agrícola 2017-2018, 2019.
IGLESIAS, Hoshi A. – Introdução ao Acoplamento Cromatografia Líquida – Espectrometria de Massas Waters Technologies do Brasil, Barueri, SP, 2016.
INMETRO. Instituto Nacional de Metrologia, Qualidade e Tecnologia. Orientação sobre Validação de Métodos Analíticos – DOQ-CGCRE-008. Rev. 07, 28 f, jul 2018.
JUNIOR, J.C.L, – Manejo integrado de pragas na cultura do tomate: uma estratégia para a redução do uso de agrotóxicos – Extensão em Foco (ISSN: 2317-9791), 2019.
LESUEUR, A. B; KNITTL P. A ; GARTNER, M. A; MENTLER A. C, FUERHACKER M.B.- Analysis of 140 pesticides from conventional farming foodstuff samples after extraction with the modified QuECheRS method – Science Direct, 2008.
MALDANER L, JARDIM ICSF. O estado da arte da cromatografia líquida de ultraeficiência [The art state of ultra performance liquid chromatography]. Quim Nova. 32: 214-222. Portuguese, 2009.
OGIHARA, Camila Honda – Desenvolvimento e validação de método para a determinação de multirresíduos de agrotóxicos em solo empregando o método quechers e a cromatografia líquida de ultra alta eficiência acoplada à espectrometria de massas sequencial – UNICAMP, 2018.
ORTELLI, D; COGNARD, E; JAN, P; EDDER, P. Comprehensive fast multiresidue screening of 150 veterinary drugs in milk by ultra-performance liquid chromatography coupled to time of flight mass spectrometry and Chromatography. 877: 2363–2374, 2009.
PINTO, C.G., Martín, S.H., PAVÓN, J.L.P., CORDERO, B.M., A simplified Quick, Easy, Cheap, Effective, Rugged and Safe approach for the determination of trihalomethanes and benzene, toluene, ethylbenzene and xylenes in soil matrices by fast gas chromatography with mass spectrometry detection. Anal. Chim. Acta, 689, 129-136, 2011.
PRESTES, O.D. ; Friggi, C.A.; ADAIME M.B, ZANELLA, R. QuECheRS – QuEChERS-a modern method of sample preparation for multiresidue determination of pesticides in food by chromatographic methods coupled to mass spectrometry]. Quim Nova. 32: 1620-1634. Portuguese, 2009.
RAMOS, A. M. et al. Evaluation of a modified QuEChERS method for the extraction of pesticides from agricultural, ornamental and forestal soils. Analytical and Bioanalytical Chemistry, v. 396, p. 2307-2319, 2016.
RASHID A., NAWAZ S., BARKER H., AHMAD I., AND ASHRAF M., Development of a simple extraction and clean-up procedure for determination of organochlorine pesticides in soil using gas chromatography-tandem mass spectrometry. J. Chromatogr. A, 2010, 1217, 2933-2939
RIBAS, P. P.; MATSUMURA, A. T. S. A química dos agrotóxicos: impacto sobre a saúde e meio ambiente. Revista Liberato, 2009, 10, 14, 149-158.
RUBENSAM G, Barreto F, HOFF RB, KIST TL, PIZZOLATTO, TM. A liquid–liquid extraction procedure followed by a low temperature purification step for the analysis of macrocyclic lactones in milk by liquid chromatography–tandem mass spectrometry and fluorescence detection. Anal Chim Acta. 705:24-29, 2011.
SOBER – Revista de Economia e Sociologia Rural (RESR) – Relatório – 1º Trimestre 2019, MAPA, Brasil, 2019
TSIPI, D.; BOTITSI, H.; ECONOMOU, A. Mass Spectrometry for the Analysis of Pesticide Residues and their Metabolites. New Jersey: John Wiley & Sons, 2015.
VEIGA, Denise Piccirillo – O impacto do uso do solo na contaminação por agrotóxicos das águas superficiais de abastecimento público – USP, São Paulo, 2017
APPENDIX – FOOTNOTE REFERENCES
8. Late blight, caused by Phytophthora infestans, is a highly aggressive disease in tomato culture, capable of decimating whole crops in a short period of time.
9. Agronomic parameter established by ANVISA regarding recommendation 028/2016 approved by the National Council for Food and Nutritional Security (CONSEA) – constitutes one of the components for calculating exposure and assessing risk, which is a prerequisite for registration or authorization of a pesticide in new crops.
[1] Doctor in Environmental Sciences and Engineering from the Federal University of Rio de Janeiro/ Polytechnic School of Chemistry/ Environmental Engineering Program (UFRJ/POLI/PEA); Master in Environmental Science and Engineering from the Federal University of Rio de Janeiro/ Polytechnic School of Chemistry/ Environmental Engineering Program (UFRJ/POLI/PEA); Specialization in Chemistry Teaching (FIJ); Degree in Licentiate in Chemistry from the State University of Rio de Janeiro (UERJ).
[2] Advisor. PhD in Engineering from the Mining, Metallurgical and Materials Engineering Program at the Federal University of Rio Grande do Sul.
[3] Advisor. PhD in Ocean Engineering from Coppe / UFRJ; Associate Professor at the Polytechnic School of the Federal University of Rio de Janeiro, and Pro-Rector of Undergraduate Studies at UFRJ.
[4] Advisor. PhD in Sciences by the Center for Nuclear Energy in Agriculture / CENA – from the University of São Paulo.
[5] Master in health surveillance in health (FIOCRUZ / INCQS).
[6] PhD in health surveillance in health (FIOCRUZ / INCQS).
[7] PhD in health surveillance in health (FIOCRUZ / INCQS).
Submitted: December, 2020.
Approved: January, 2021.