ORIGINAL ARTICLE
LIMA, Leandro Jose Barbosa [1], HAMZAGIC, Miroslava [2]
LIMA, Leandro Jose Barbosa. HAMZAGIC, Miroslava. Strategies for the energy transition: literature review. Revista Científica Multidisciplinar Núcleo do Conhecimento. Year. 07, Ed. 06, Vol. 08, p. 96-120. June 2022. ISSN: 2448-0959, Access link: https://www.nucleodoconhecimento.com.br/environmental-engineering-en/energy-transition, DOI: 10.32749/nucleodoconhecimento.com.br/environmental-engineering-en/energy-transition
ABSTRACT
Due to the need to search for energy sources that generate less greenhouse gases and, consequently, have a lower impact on the environment, several energy transition strategies emerge. In this context, this article aims to answer: what are the energy transition strategies? Therefore, the objective is to present some strategies in progress for the energy transition process, approaching the subject on three main aspects, namely: energy efficiency; renewable energy; and carbon capture and sequestration. For this, the methodology used was the bibliographic research followed by the critical analysis of the literature found. As a result, it was noted that the strategies presented allow the reduction of greenhouse gas emissions, such as carbon dioxide, which has been affecting the planet’s climate. Finally, it is concluded that the strategies presented in the energy efficiency category were: labeling programs; use of recycled material; automation and use of artificial intelligence; and management of methane emissions. In the renewable energy category, the following strategies were identified: ethanol; biodiesel; biomethane; the biogas; natural gas; the hydrogen; solar, wind, hydroelectric, geothermal energy; and energy storage. At the end, the strategy for capturing, using and storing carbon was presented. It is also worth mentioning that this is a very vast area of opportunities for research and innovation, being in full development and demanding many other works that deal with energy efficiency, carbon capture and renewable energies.
Keywords: climate change, energy transition, air pollution, carbon dioxide.
1. INTRODUCTION
Currently, we live in a world of remarkable climate change, where 4.2 million people die every year due to air pollution (WHO, 2021). These polluting gases allow the passage of sunlight towards the planet, as they retain heat, raising the temperature, which, consequently, increases pollution and contributes to the worsening of the greenhouse effect. The consequences of this process are: climate change, such as: greater droughts, reduction of drinking water reserves, sea level rise, reduction in food production (NATIONAL GEOGRAPHIC, 2017b); and health problems such as heart, respiratory and cancer diseases (NATIONAL GEOGRAPHIC, 2017a).
Greenhouse gases (GHGs) come from natural fires and volcanoes, but most emissions come from anthropogenic activities such as energy generation and agriculture (NATIONAL GEOGRAPHIC, 2017a). GHGs include: Carbon Dioxide (CO2), Methane (CH4), Nitrous Oxide (N2O), CCF-12 and HCFC-22, with C02 (CO2) being the most important, given the impact due to its volume. Due to the participation of CO2 in the greenhouse effect, these are quantified in CO2 equivalent, ´CO2eq´ or carbon equivalent (BABARINDE and ADIO, 2020). They are also classified according to their potential impact on global warming (Global Warming Potentials, GWP), since each of them has a capacity for heat accumulation and a specific lifespan (BABARINDE and ADIO, 2020).
Therefore, in response to the impacts already observed on the planet and with the objective of creating global policies to prevent the greenhouse effect, the countries came together for the first time (after the end of the Cold War), in an event dedicated to the discussion of the theme, between June 3 and 14, 1992, in Brazil. Despite the creation of a common agreement, not all countries followed the established goals. The same happened later in other meetings, such as the Kyoto (1997) one and the Copenhagen (2009) negotiations. Finally, in 2016, a more comprehensive agreement was reached, the so-called Paris Agreement, where greater “climate maturity” already existed. This agreement made each country reach its own commitment to contribute globally to a goal of limiting global temperature rise to 2 degrees Celsius by 2050. In addition, some key points discussed were: limiting the indiscriminate use of fossil fuels; create a growing economy, promoting job creation; economic sustainability; low carbon emission; improvement of agriculture; and combating deforestation (TV BRASILGOV, 2016).
As an example of the commitments and goals of this agreement, the United Kingdom created laws that oblige energy producing companies to reduce CO2 emissions by 80%, based on 1990 emission levels (BABARINDE and ADIO, 2020).
However, it is noteworthy that to achieve this goal it is necessary to have technologies. In this regard, studies indicate that 25% of the ‘CO2e’ reduction will come from existing technologies, 35% from technologies under development and 40% from technologies that have not yet been commercially tested (BAKER HUGHES, 2021a).
It is in this scenario that the energy transition emerges, as a phenomenon that is occurring in response to the need to seek energy sources that generate less greenhouse gases (GHGs) and, consequently, have less impact on people and the environment. However, what are the energy transition strategies?
To answer this question, the present article aims to present some strategies in progress for the energy transition process, approaching the theme on three main aspects, namely: energy efficiency; renewable energy; and carbon capture and sequestration.
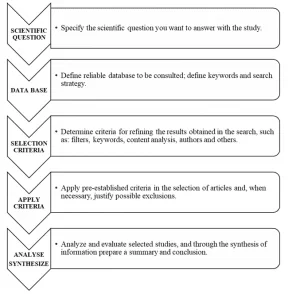
For this, a bibliographic research was carried out in order to understand and explore the theme. This was an exploratory research, which sought to decipher some existing strategies in the midst of the energy transition, highlighting the need for future researchers to carry out new research, to increase knowledge within this field and contribute to a low carbon economy, with less environmental and climate impact.
2. LITERATURE REVIEW
According to information from the International Energy Agency, CO2 emissions have been growing very rapidly in developing countries, while in the United States and Europe there is a slight downward trend (INTERNATIONAL ENERGY AGENCY, 2021). In this context, the energy transition is something necessary for countries to grow without impacting the environment.
Accordingly, Graph 1 shows the total energy required and the intensity of CO2 emissions, taking into account the goals established between the countries (INTERNATIONAL ENERGY AGENCY, 2021).
Graph 1 – Total energy required and intensity of CO2 emissions.
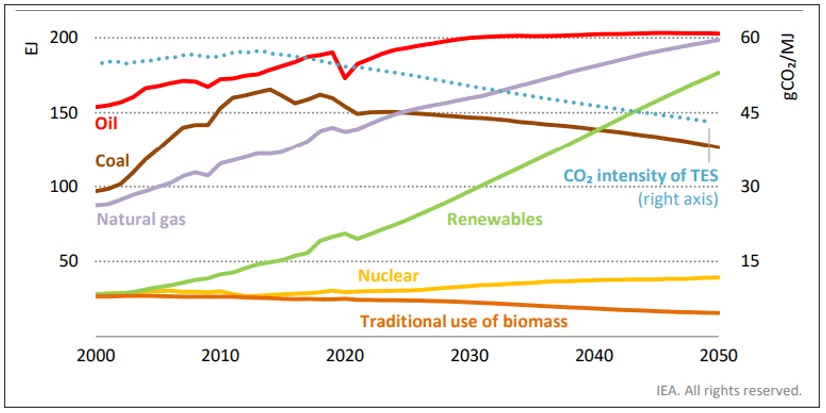
As seen in Graph 1, there is a trend in the growth in demand for: oil, natural gas, renewables and nuclear, while there is a drop in demand for the traditional use of biomass and coal. It is also verified that despite the call for the reduction to zero of fossil fuels, this reality is still not possible due to the lack of sufficient means to deliver the energy required for the growth of consumption.
In order to address some ongoing strategies for the energy transition process, 3 categories were selected, namely:
- Energy Efficiency: which covers strategies related to waste elimination, with application in construction, transport, energy generation and distribution technologies, vehicles and design concepts (BABARINDE and ADIO, 2020);
- Renewable Energy: which covers strategies related to the use of renewable energy, such as: geothermal, solar, wind and hydro, and the substitution of energy generation by sources that emit more carbon for sources that emit less carbon (natural gas vs coal, ethanol vs gasoline) (BABARINDE and ADIO, 2020);
- Carbon Capture and Sequestration: which covers strategies related to carbon capture processes before its atmospheric emission (and the carbon capture process released into the atmosphere), which is broken down into four main parts: capture, transport, geological storage (or use in industry) and monitoring (BABARINDE and ADIO, 2020).
2.1 ENERGY EFFICIENCY
When it comes to energy efficiency, the main objective is to reduce emissions with maximum use of the energy produced, resizing and/or leak control. In this context, the following are some strategies for the energy transition, aiming at greater efficiency, namely: Labeling Programs, the use of recycled material, automation and artificial intelligence, and the management of methane emissions.
2.1.1 LABELING PROGRAMS
Labeling Programs have helped several countries around the world in initiatives to reduce energy consumption and, consequently, reduce the ‘carbon footprint’. In Brazil, this type of program began in 1993. In 2007, the label was applied to 21 product categories. In this period, savings of 3.7 TWh were estimated. This challenge forced the industry to evolve and produce more efficient products, such as the electric induction motor, which consumes 29% of all energy produced in Brazil. At the end of 2007, with the labeling program, savings of 428 GWh were achieved (CARDOSO et al., 2009).
In Brazil, this Program is currently undergoing a review, focusing, for example, on refrigerators, aiming at the production of goods that further reduce energy demand in the country, in the medium and long term, resulting, consequently, in lower emission of CO2 (FONTES, 2021).
In 2009, another Labeling Program was implemented in Brazil, the Automobile Labeling Program. It brought not only information on CO2 consumption by type of fuel, but also information related to energy consumption, normalized, per kilometer, giving consumers options to choose better products and forcing automakers to seek greater efficiency. In monitoring the actions of this Program, it was noted that subcompacts and compact SUVs had reductions of 7% and 8% in fuel consumption, consequently leading to a reduction in GHGs emissions (BALES et al., 2015).
This Program, as demonstrated by Cella; Guarda and Domingos (2020), can also be applied in commercial buildings, since the electrical consumption in service buildings, in Brazil, exceeds the percentage of 21% of the national consumption, being considered, by the governments, a great opportunity for the reduction of emissions of GHGs.
Another sector that should receive attention from Labeling Programs is incandescent lamps, as these lamps consume 82% more energy and last 50 times less than current LED technology. Furthermore, the exchange would bring benefits related to less waste generation, also reducing the need for energy consumption in production processes. In addition, LED lamps are 70% more efficient in consumption than fluorescent lamps and have a simpler, safer and more economical recycling process (SANTOS et al., 2015).
2.1.2 RECYCLING
Another alternative is the use of recycled material. A model presented by Alcoa (2020) highlights the 30% reduction in greenhouse gas emissions with the production of aluminum from recycled material.
In the steel production chain, 75% of carbon dioxide emissions come from the production of pig iron. To produce 1 kg of steel in a blast furnace using iron ore and scrap, approximately 2.5 t CO2 is emitted. However, when recycled material is used, which can go into an electric oven, the same volume emits approximately 462 kg of CO2, that is, 81% less CO2 into the atmosphere (MELO et al., 2021).
2.1.3 AUTOMATION AND USE OF ARTIFICIAL INTELLIGENCE
New sensors for monitoring the properties of lubricating oils operating in conjunction with the internet in the clouds and algorithms have also served as a way to determine the exact moment to change fuel oil. With this, the waste of liters of lubricating oil in the order of 44 tons of CO2 per vessel has been avoided. In this context, it is highlighted, therefore, that similar predictive maintenance solutions can reduce amounts of maintenance and other interventions that also generate GHGs emissions. It is also verified that several artifices related to the reduction of GHGs emissions are emerging with Industry 4.0 (PARKES and HUGHES, 2020).
2.1.4 MANAGEMENT OF METHANE EMISSIONS
Despite being cleaner than coal, both in terms of CO2eq emissions and other chemical elements harmful to health, natural gas is a source of methane (5-10% of global emissions), which can leak and contribute to the worsening of the effect greenhouse 24 times larger than CO2 (THOMAS; KUMAR and KUMAR, 2020).
However, it is worth noting that the emission of methane is not limited to the case of leaks in the use of natural gas. It also occurs: when the gas flaring is not complete, which can happen during the flaring process, which is a way to contain excess pressure in the gas line or in the compression of natural gas (OGWU; OLUWAFERANMI and JOHNSON, 2021); incomplete burning of biomass (depending on the type of biomass); in the decomposition of organic matter from garbage; in processes related to agriculture (the rice crop, which accounts for 20% of methane emissions worldwide) and livestock (92-98% of emissions occur during the rumination process). Added to this are the emissions from the manure of these animals, which can also be natural, which includes wet land (25% of global emissions), termites, vegetation, ocean, wild animals, among others (THOMAS; KUMAR and KUMAR, 2020).
The natural process of methane production occurs by methanogenesis, which occurs in an anaerobic environment where the compound C6H12O6 is decomposed by bacteria into 3CO2 plus 3CH4. These bacteria are naturally present in rice fields, forests and watery soils (THOMAS; KUMAR and KUMAR, 2020).
Therefore, some solutions for the management of methane emissions are: the monitoring of emissions measurements, whether by sensors, drones or even by satellite, which is an important way of recognizing and mapping risk areas; Flare flame monitoring, which can increase flare efficiency up to 98%; use of hermetic compressors to avoid leaks in the compression process; more modern pipes that do not allow gas diffusion; or, still, remediation processes of post fracking formations. As seen, the production of biomethane can also be a solution for cases involving the decomposition of garbage, manure and organic matter in general (THOMAS; KUMAR and KUMAR, 2020).
Another way of controlling emissions in agriculture is related to changing the irrigation strategy. In this context, different soil care practices can be used, such as, for example, the application of sulfate doses and other soil acidification controls. In livestock, emissions can be controlled through food control, using, for example, protein-rich feed. Furthermore, in mining, drilling methane relief wells before the mining process starts can contribute to controlling emissions during this process (THOMAS; KUMAR and KUMAR, 2020).
2.2 RENEWABLE ENERGY
Currently, there is a search for the use of energy defined as clean, such as: hydrothermal, solar, wind and hydraulic, replacing energy produced by sources that emit more carbon. Other important substitutions, known as less carbon energy, are: natural gas vs coal, ethanol vs gasoline. Therefore, in the following subtopics, different solutions and innovations are presented that are references in the areas of renewable energies and that contribute to the energy transition.
2.2.1 ETHANOL
Ethanol emerged in Brazil as an alternative to gasoline, given the global oil crisis of the 1970s. In the beginning, there was a focus on emphasizing Brazil’s nationalism and protagonism, as this fuel is important for the decarbonization process, since it uses the carbon that is captured by plants during their life and that in burning is released again, thus closing the cycle (FREITAS; ROSEIRA and SAMPAIO, 2020).
Ethanol can be used in two ways for combustion engines: anhydrous ethanol, which serves as an additive to gasoline; and, hydrated ethanol, which is used directly in the fuel tank in a completely autonomous way (ZANARDI and COSTA JUNIOR, 2016).
It is estimated that the use of ethanol has led Brazil to avoid the emission of 566 million tons of CO2 since 2003, which would be equivalent to the combined annual emissions of Argentina, Venezuela, Chile, Colombia, Uruguay and Paraguay (ARAUJO, 2021).
Furthermore, by way of comparison, 720 g of CO2 are emitted per real spent on gasoline, while 142 g of CO2 are emitted when the same vehicle is fueled by Ethanol per real spent (FERREIRA, s.d.). Considering the average for the productive sector, the use of ethanol compared to gasoline prevents the emission of: 2.564 kg of CO2/liter of anhydrous ethanol and 1.722 kg of CO2 /liter of hydrated ethanol (EPE, 2005).
There is a third use of ethanol under development: mixed with water, in a proportion of ~50%, to power a fuel cell and, with that, the cell produces hydrogen that can be used as an electrical source for the vehicle. This technique has the main advantage of enabling the use of hydrogen, which is a cleaner source, in addition to avoiding the need for batteries in cars, as the fuel distribution logistics matrix is already prepared to feed vehicles equipped with this technology (SILVA et al., 2004; FIUZA et al., 2012; TORRES, 2021).
2.2.2 BIODIESEL
Another renewable fuel option that can be used to replace fossil fuel is ethyl biodiesel and methyl biodiesel. Both can come from castor bean, palm or soy, for example. This fuel is obtained through a chemical reaction between triglycerides or fatty acids and an alcohol and, in cases of concentrations of 100% of biodiesel, the avoided emissions can reach: 2.76 kg CO2eq/liter for the Ethyl Biodiesel of Palma; 2,537 6kg CO2eq/liter for Soy Ethyl Biodiesel; and 1.7676 kg CO2eq/liter for Castor Ethyl Biodiesel. In all cases, the complete production cycle is considered (EPE, 2005).
2.2.3 NATURAL GAS VAHICLES (NGVs), BIOGAS (CNG) AND BIOMETHANE
It is known that Natural Gas Vahicles (NGVs) emits 20% less CO2 than gasoline. In this way, it contributes to reducing pollution (COPPE/UFRJ, 2011). However, when compared to coal, CO2eq emissions are 42% lower (CAMIOTO and REBELATTO, 2014).
Biogas (CNG) provides the opportunity to eradicate a source of methane gas emission, by treating the putrefaction, in natura, of biological waste (DREGER, 2017). In addition, its combustion is neutral, as it comes from organic matter that absorbs CO2 in its life cycle (SALATI, 2021).
CNG can be directly replaced by NGVs (ZANK et al., 2020), since this is already available to the consumer, is cheaper (3.99/4.15 reais/m3) and allows a range of 30 km greater for the same volume in the cylinder (CARDOSO, 2021).
Furthermore, it is noteworthy that it is possible to produce biogas from the biomass of ethanol production, making its cycle even more efficient (EPBR, 2020), which is also capable of supplying 17% of Brazil’s electricity in 1 year (SALATI, 2021).
Biomethane is produced through the purification of biogas and it is estimated that it can replace around 34% of the annual consumption of diesel. In Brazil, in 2020, diesel consumption was 57.4 billion liters and, in 1 km of diesel journey, 1,229 thousand g CO2eq are emitted. However, if this same kilometer is covered by a truck powered by biomethane, the emission would be 72 g CO2eq (SALATI, 2021).
2.2.4 HYDROGEN
Hydrogen is produced through the hydrolysis of water, which requires energy consumption. In its conversion, it has a higher calorific value with a lower molecular weight, that is, more energy with less mass. Furthermore, it is storable, which means that when combined with other forms of clean energy, such as solar, geothermal, hydraulic or wind power, it produces the so-called green hydrogen, which is accumulated in abundance. Later, this gas can be converted into energy and, instead of producing CO2 and other toxic elements, the burning of hydrogen will produce water and electricity. It can also be combined with natural gas leading to cleaner burning (EPBR, 2020).
Depending on the type of energy used for its production, hydrogen can be classified in colors: black or brown, when produced through coal; gray and turquoise, when produced using natural gas; yellow, when produced using energy sources available on the grid; blue, when greenhouse gases are captured during production; pink, when produced by nuclear energy; and green, when produced using renewable energy (BOTHE, 2020).
Despite being easier to store and transport than other forms of energy, this gas requires the use of pressurized cylinders, which can be complex for some applications, and the use of more energy during the compression process. Thus, an alternative for the transport of hydrogen is ammonia, which can be stored at room temperature without the need for compression, which facilitates the transport process (EGUTE et al., 2010).
In addition, some companies are interested in producing green steel using hydrogen or electricity instead of gas or coal, which would bring GHG emissions to practically zero (VEJA, 2021).
2.2.5 SOLAR AND WIND ENERGY
Wind has been used as a source of mechanical energy for many years. Currently, it has also been used for the generation of electric energy, being one of its biggest problems of penetration, the noise generated by the blades. It is estimated that there are 20 thousand generators installed worldwide, with an average cost of 48 Euros per MWh (GUERRA and YOUSSEF, 2011).
Wind is produced by about 2% of the solar thermal energy absorbed from the earth in association with the movement of the earth’s rotation. The wind potential of a region varies according to geographic characteristics, such as relief, obstacles and height (GUERRA and YOUSSEF, 2011; DUFFY et al., 2020).
The main components of a wind system are: the wind; the rotor; the transmission; the multiplier box; the electric generator; the control mechanism; the tower and the transformer. In terms of construction, the generation axis can be vertical or horizontal, and the number of blades can vary according to the application (GUERRA and YOUSSEF, 2011).
Solar energy was created and developed in the United States in 1954, but it had a very high production cost (over 100 USD/w), which was reduced with time and technological advances (40 USD/w in 1980). Due to a push by the German government to encourage renewable energy, in the year 2000 (>10 USD/w), China started to have a bigger market share and, with that, the price fell even more (>5 USD/w) (DW PLANET A, 2021a).
The biggest problem with solar energy is that it only works when there is sun and there are difficulties in storing it (EPBR, 2020) (DW PLANET A, 2021a). In this context and taking into account that there is an increase in energy demand at night, it is not possible to supply this demand with solar energy, and it is necessary to start using non-renewable plants and discard part of the energy accumulated during sunny hours to not overload the system (DW PLANET A, 2021a).
2.2.6 HYDROELECTRIC POWER
Hydraulic energy uses the potential energy accumulated by the water dammed up in reservoirs, however, it is worth noting that favorable geographical conditions are necessary for the production of electricity. This system has the advantage of allowing energy to be produced through gates. However, its capacity is limited by the volume of the reservoir, impacted by the uncertain power of rainfall and, consequently, the inflow of water. In this scenario, in some cases it is necessary to opt for emptying the reservoir and opening the floodgates, which leads to non-generation of energy. If, in this case, it were possible to store the energy produced, it could be used for future applications (ALENCAR et al., 2009).
2.2.7 ENERGY STORAGE
Almost all renewable energies have availability problems under certain conditions. Therefore, to overcome this limitation, there are currently several solutions available. Among them: the use of Lithium Ion batteries, which by the recent evolution process became an alternative to store energy produced in excess; o Pumped Hydro Storage, where water is pumped into a lake on top of a hill or to a lifted position, using solar energy or another renewable source, and so, as in the example of hydrogen, when renewable energy is not present or sufficient, the water goes down a turbine and generates electricity; the production of hydrogen by electrolysis of water, where blocks are lifted by a crane with the help of solar energy and, during the night, they are lowered, thus producing energy (DW PLANET A, 2021b); the suspension of loads from wells, including old oil wells, that are stacked and lowered when energy is needed (GRAVITRICITY, 2021).
Another solution, tackled by a company called Form Energy, is the Ferro-Air battery. It has a simple technology, but it can be more advantageous than Li-Ion batteries, as it stores energy for many days, through the basic principle of corrosion for energy storage, having 1/10th the cost of lithium batteries. Lithium Ion, which is equivalent to approximately 6 USD/kW against 80 USD/kW and can store more than 3 MW/acre (CLEARPATH ACTION, 2021; FORM ENERGY, 2021; MINARI, 2021).
2.2.8 GEOTHERMAL ENERGY
Geothermal energy uses the heat of the earth to produce water vapor and thereby produce electrical energy. It was explored on an experimental scale, initially in Italy, in 1904, but it did not have an economic potential of interest. In 1970, with the energy crisis, Iceland, which was heavily dependent on fossil fuels for electricity production, had to explore this technology more and, today, has about 30% of its energy matrix based on geothermal energy, which is available 24 hours a day and 365 days a year (DW PLANET A, 2020).
Virtually all countries have geothermal energy potential. Furthermore, maps with the geothermal potential of each region can be easily found. It is estimated that 3 to 4% of the world demand for energy can be covered with geothermal energy, and Indonesia, present in the circle of fire, is the country with the greatest geothermal potential (DW PLANET A, 2020).
The process of producing this energy consists of pumping water through a well to a subsurface region of geothermal interest and using the steam that returns from this pumping to produce electricity in a steam turbine. This process is called indirect use, but there is also direct use, where the generated steam is used for heating. In this context, electricity production can take place in a closed system (CLGS, Closed-loop Geothermal System) or through fractures (EGS, Enhanced Geothermal System), with the latter having the potential to cause earthquakes (ALLAHVIRDIZADEH, 2020; DW PLANET A, 2020).
The well used in the production of geothermal energy has a drilling process very similar to the drilling of an oil well, but it suffers from greater technological challenges, since it needs to cross high temperature zones, volcanic rocks with greater hardness and often fractured, that affect drilling tools and, consequently, increase the initial investment in the construction of the geothermal plant (ALLAHVIRDIZADEH, 2020; DW PLANET A, 2020).
In addition, there is also the option of using abandoned oil wells for the direct or indirect production of geothermal energy (CAULK and TOMAC, 2017).
However, one of the main problems with geothermal energy is that it is produced in a specific location and is difficult to transport. Thus, an alternative would be the use of Geothermal energy for the production of hydrogen and subsequent exportation, thus making the most of the potential of some regions of the planet (HILL, 2021).
2.3 CAPTURE, USE AND STORAGE OF CARBON
The energy transition is a phenomenon that will happen with the presence of carbon emitting sources. Thus, the world may need the removal of billions of tons of carbon dioxide every year so that by 2050 it is possible to reduce emissions that cannot be completely eliminated and bring the climate back to normal conditions (TEMPLE, 2021).
However, making systems more efficient or starting the movement towards the use of renewable fuels will not be enough to achieve the goals of reducing GHG emissions. Therefore, it is necessary to find a way to be able to use the fuels that are available today and not allow the CO2 generated by their combustion to enter directly into the atmosphere. Furthermore, for cases where the emission cannot be stopped, it is necessary to capture this CO2 directly from the air with the so-called Direct Air Capture (DAC) and, in this way, use or permanently store this carbon. This capture and storage technique is called Carbon Capture and Storage (CCS) or Carbon Capture, Utilization and Storage (CCUS). Also, according to the Intergovernmental Panel on Climate Change (IPCC), without Carbon Capture it will be impossible to achieve the stipulated goals (DW PLANET A, 2021b; EKELAND et al., 2021; BABARINDE and ADIO, 2020).
However, it is worth noting that this is not a new idea, as dealing with CO2 has already been a challenge in the development of submarines and also during the space race. However, it is noteworthy that this group of new or existing technologies can significantly reduce CO2 emissions in gas or coal power plants, and also be applicable to other industrial applications, such as: the cement or natural gas processing. In addition, more than 40% of CO2 emissions in the United States come from energy generation, and CCS technology is capable of reducing between 80 and 90% of these emissions, as it must be considered that only factories with coal plants generate 3.5 million tons of CO2 per year in the United States (BRAHMBHATT, 2016; DW PLANET A, 2021b).
Despite the benefits, direct air capture still has a high cost, that is, technological development and the creation of an economy around this technique to make it viable, either through carbon credits, taxation of polluters or through government incentives (BRAHMBHATT, 2016; DW PLANET A, 2021b).
The economic viability point of this technique is approximately 100 dollars per ton. Customers in the United States typically pay between $65 and $110 in carbon dioxide used for commercial purposes. Reaching this value, this strategy can solve 10 to 20% of emissions that are still very difficult and expensive to eliminate and, still, compete with the cost of capturing at the source of the emission (BRAHMBHATT, 2016).
Another point that must be considered is that existing technologies for capturing CO2 use 25 to 40% of the energy produced by the power plant (BONILLA, 2020) and also increase water consumption, which is already high for plants of coal. It is worth noting that, in some cases, with the implementation of CCS, this water consumption doubles (ROSA et al., 2020).
With regard to DAC, it should be noted that it can be used to generate carbon credits, which would help areas with difficulties in investing in cleaner fuels, in achieving carbon neutrality goals (NET-ZERO or NZE) (TEMPLE, 2021).
It is also possible to store the captured CO2 in geological formations, such as: oil and gas reservoirs; deep salt formations; coal deposits; as well as high ocean depths. There is also the possibility of drilling a well or using already depleted wells for CO2 storage (BONILLA, 2020). Another alternative under study is the geological mineralization of CO2 through injection in places with the presence of Calcium and Magnesium for the formation of carbonates, provided that adequate pressure and temperature conditions exist (GADIKOTA, 2021).
Another strategy being studied by the Federal University of Paraná is an incinerator that can be used to burn garbage. After this process, the gases resulting from the burning of this residue are treated with the use of microalgae, which has a great capacity for CO2 absorption (UFPR TV, 2016).
4. RESULTS AND DISCUSSION
The world’s renewable matrix is expanding, but not yet at a level that eliminates fossil fuels. In addition, the demand for energy has been growing and climate change has affected wind and rain regimes, impacting the capacity to generate renewable energy, which leads to the risk of blackout or energy rationing (CARRANÇA, 2021). Thus, additional actions are required so that less GHGs are emitted (INTERNATIONAL ENERGY AGENCY, 2021), as observed in the case of carbon capture, either through filters, chemicals (BABARINDE and ADIO, 2020) or even through the use of microalgae (UFPR TV, 2016).
Another path is the more efficient use of fuels or for energy efficiency, such as cogeneration (MITIUKOV; SPIRIDONOV and SAMIGULLINA, 2021), the use of fuels that pollute less, such as biogas (DREGER, 2017) and ethanol (SILVA et al., 2004). In addition, biogas and other biofuels, as well as the use of fuel cells, can be more efficient and practical solutions, given the possibility of using existing networks to disseminate these fuels.
However, it appears that the use of electric vehicles is not necessarily the best option for all countries. In this context, it is important to consider that 0.074 kg CO2e/kWh are emitted in Brazil, while in other countries in the northern hemisphere, this number is 1 kg CO2e/kWh (CARBON FOOTPRINT, 2020). In this scenario, there is also the Combined Cycle, which is the definition given to the combination of combustion engine systems used to generate electricity with systems of electric generation by steam, which take advantage of the temperature of the gases of exhaust, increasing energy efficiency (MITIUKOV; SPIRIDONOV and SAMIGULLINA, 2021).
The cement industry is responsible for 8% of the world’s CO2 emissions, either through the heating process or the production of its main raw material, clinker (chemical reaction that transforms virgin limestone into lime, dividing the material into calcium oxide and CO2). In this process, 90% of GHG emissions are related to this type of industry (RODGERS, 2018). However, there is the possibility of producing it with 30% less emissions (MEHRA, 2016). In this context, an alternative to Portland cement is LC3, a cement that uses almost half of the clinker and clay, which is a product discarded by mining. Furthermore, according to studies, LC3 cement has a mechanical performance similar to Portland cement (BARBALHO; SILVA and RÊGO, 2020).
In terms of solutions to reduce the impact, the use of burning waste instead of solid fuels, has already provided a reduction of the CO2 footprint by 18% in the last decades, which can be even improved with other sources of energy more clean and with carbon capture (RODGERS, 2018).
With regard to renewable energies, the limitations that are storage and transport can be solved with the use of more economical batteries and with greater load capacity x time, as in the case of the iron-air battery (MINARI, 2021) and, mainly, in the case of hydrogen, they become unlimited sources of energy (EPBR, 2020). In addition to supplying some parts of the world, such as regions with greater wind potential or regions with greater geothermal potential, the denomination of global suppliers of green hydrogen, which can be transported by pipelines, trucks or ships, thus providing access to a clean source of energy.
5. FINAL CONSIDERATIONS
The energy transition is fertile ground for innovation, and it needs creativity to achieve the goals established in the Paris agreement (GATES, 2021). As presented in the course of this article, the solution is not unique, as it involves the adoption of several existing technologies, under development or that have not yet been thought of (BAKER HUGHES, 2021b), especially taking into account the growth of the world population and the increase in population electricity demand (INTERNATIONAL ENERGY AGENCY, 2021).
In this context, the aim was to answer: what are the energy transition strategies? Having as main objective to present some strategies in progress for the energy transition process, approaching the theme on three main aspects, namely: energy efficiency; renewable energy; and carbon capture and sequestration. Therefore, in view of the above, the following were presented, in the category of energy efficiency: labeling programs; use of recycled material; automation and use of artificial intelligence; and management of methane emissions. In the renewable energy category: ethanol; biodiesel; biomethane; the biogas; natural gas; the hydrogen; solar, wind, hydroelectric, geothermal energy; and energy storage. And finally, the carbon capture, use and storage strategy
In the area of energy efficiency, one can cite the search for more efficient equipment and systems that consume less energy and fewer resources (SANTOS et al., 2015), thus demonstrating the use of labeling programs (CELLA; GUARDA and DOMINGOS, 2020). One can also mention the automation processes and artificial intelligence techniques used to increase the efficiency of various systems (PARKES and HUGHES, 2020).
Regarding renewable energies, it was pointed out that they are in full expansion, as well as the development of new energy storage techniques (GRAVITRICITY, 2021), the cheapening of equipment produced for the production of these energies, as in the case of solar energy (DW PLANET A, 2021a), technological advances, which have also made these techniques more efficient, and the use of cleaner fuels, such as natural gas for vehicles or ethanol (EPE, 2005; O ‘SHEA et al., 2020).
However, it is worth remembering that there are still areas where the use of fossil fuels cannot be completely eliminated. Thus, the carbon capture technique is the best solution, either by direct removal of carbon in the air or by capturing carbon at source, which are still expensive and generate energy inefficiencies, but which can capture 80-90% of CO2 emitted (BABARINDE and ADIO, 2020).
As a result, it is indicated that the integration and technological improvement of different energy sources should result in greater reductions in CO2 and GHG emissions. However, it is noteworthy that in order to achieve the goals of reducing global warming, innovation and improvement in each of the aspects presented are necessary (GATES, 2021), which is, therefore, a path of opportunities for the development of other works in each of the areas presented here, as every CO2 reduction counts.
REFERENCES
ARAUJO, G. Uso de etanol no Brasil evitou emissão de 556 mi t de CO2 desde 2003, diz Unica. Reuters, junho de 2021. Disponível em: https://mobile.reuters.com/article/amp/idBRKCN2DE2K2-OBRBS. Acesso em: 27 de junho de 2022.
ALENCAR, T. T.; LEITE, P. T.; CARNEIRO, A. F. M.; e CARVALHO, A. C. P. L. F. Desenvolvimento de uma ferramenta inteligente amigável para o planejamento da operação de sistemas hidrotérmicos de potência. VIII Th Latin American Congress Electricity Generation and Transmission, 2009.
ALCOA. Alcoa triplica o uso de alumínio reciclado e reduz emissões de gases de efeito estufa. Alcoa, agosto de 2020. Disponivel em: https://www.alcoa.com/brasil/pt/news/releases?id=2020/08/alcoa-triplica-o-uso-de-aluminio-reciclado-e-reduz-emissoes-de-gases-de-efeito-estufa-&year=y2020. Acesso em: 27 de junho de 2022.
ALLAHVIRDIZADEH, P. A review on geothermal wells: Well integrity issues. Journal of Cleaner Production, v. 275, p. 1-19, 2020. Disponível em: https://doi.org/10.1016/j.jclepro.2020.124009. Acesso em: 28 de julho de 2022.
BABARINDE, F.; ADIO, M. A Review of Carbon Capture and Sequestration Technology. Journal of Energy Technology and Environment, p. 1-11, 2020. Disponível em: DOI:10.37933/nipes.e/2.2020.1. Acesso em: 24 de junho de 2022.
BARBALHO, E. de A.; SILVA, E. F. da; RÊGO, J. H. da S. Estudo da proporção de argila calcinada e filer calcário no cimento LC3 para diferentes teores de substituição. Revista Matéria, vol. 25, n° 1, p. 1-15, 2020. Disponível em: https://doi.org/10.1590/S1517-707620200001.0906. Acesso em: 28 de junho de 2022.
BAKER HUGHES. How ready are we to tackle CO2 emissions? YouTube, maio de 2021. Disponível em: https://www.youtube.com/watch?v=rnbS-vUio5A. Acesso em: 24 de junho de 2022.
BAKER HUGHES. VitalyX. Baker Hughes, julho de 2021b. Disponível em: https://www.bakerhughesds.com/measurement-sensing/vitalyx-oil-monitoring-platform. Acesso em: 24 de junho de 2022.
BONILLA, P. Carbon Capture Infographic. ResearchGate, 2020. Disponível em: DOI:10.13140/RG.2.2.31039.94881. Acesso em: 28 de julho de 2022.
BRAHMBHATT, S. R. The Economics of Carbon Capture. CryoGas International, 2016. Disponível em: https://www.researchgate.net/publication/302987161_The_Economics_of_Carbon_Capture. Acesso em: 28 de junho de 2022.
BALES, M. P. et al. A avaliação do programa brasileiro de etiquetagem veicular demonstra a necessidade da melhoria contínua. XXIII Simpósio Internacional de Engenharia Automotiva – SIMEA, vol. 2, num. 1, p. 1-11, setembro de 2015. Disponível em: https://www.proceedings.blucher.com.br/article-details/a-avaliao-do-programa-brasileiro-de-etiquetagem-veicular-demonstra-a-necessidade-da-melhoria-contnua-20178. Acesso em: 27 de junho de 2022.
BOTHE, D. Green, blue hydrogen – Potentials and security of supply – DVGW Congress Perspectives for H2 Module #1. Frontier-Economics, outubro de 2020. Disponível em: https://www.frontier-economics.com/media/4258/prs-bothe-green-blue-hydrogen-potential-and-security-of-supply-en-stc.pdf. Acesso em: 28 de junho de 2022.
CARDOSO, R. B. et al. Avaliação da economia de energia, atribuída a ações de etiquetagem energética, em motores de indução no Brasil. Revista Brasileira de Energia, vol. 15, n° 1, p. 29-47, 2009. Disponível em: https://www.sbpe.org.br/index.php/rbe/article/download/229/210/. Acesso em: 27 de junho de 2022.
CARDOSO, L. Conheça o combustível ecológico que é mais barato e eficiente do que o GNV. Jornal Extra, junho de 2021. Disponível em: https://extra.globo.com/economia/conheca-combustivel-ecologico-que-mais-barato-eficiente-do-que-gnv-25043071.html. Acesso em: 28 de junho de 2022.
CAMIOTO, F. de C.; REBELATTO, D. A. do N. Análise da contribuição ambiental por meio da alteração da matriz energética do setor brasileiro de ferro-gusa e aço. Gest. Prod., v. 21, n. 4, p. 732-744, 2014. Disponível em: https://doi.org/10.1590/0104-530×448/12. Acesso em: 28 de junho de 2022.
CAULK, R. A.; TOMAC, I. Reuse of abandoned oil and gas wells for geothermal energy production. Renewable Energy, vol. 112, p. 388-397, 2017. Disponível em: https://econpapers.repec.org/article/eeerenene/v_3a112_3ay_3a2017_3ai_3ac_3ap_3a388-397.htm. Acesso em: 28 de julho de 2022.
CELLA, A. M.; GUARDA, E. L. A. de; DOMINGOS, R. M. A. Desempenho energético de um edifício de escritórios: aplicação do método simplificado da nova proposta de etiquetagem de edifícios comerciais. XVIII Encontro Nacional de Tecnologia do Ambiente Construído – ENTAC, p. 1-8, dezembro de 2020. Disponível em: https://www.researchgate.net/publication/347949765_DESEMPENHO_ENERGETICO_DE_UM_EDIFICIO_DE_ESCRITORIOS_APLICACAO_DO_METODO_SIMPLIFICADO_DA_NOVA_PROPOSTA_DE_ETIQUETAGEM_DE_EDIFICIOS_COMERCIAIS. Acesso em: 27 de junho de 2022.
CARBON FOOTPRINT. Country Specific Electricity Grid Greenhouse Gas Emission Factors. Grid Electricity Emissions Factors v1.1, 2020. Disponível em: https://www.carbonfootprint.com/docs/2020_06_emissions_factors_sources_for_2020_electricity_v1_1.pdf. Acesso em: 28 de junho de 2022.
CARRANÇA, T. Apagão ou racionamento: 10 termos para entender a crise do setor elétrico. BBC, junho de 2021. Disponível em: https://www.bbc.com/portuguese/brasil-57647243. Acesso em: 28 de junho de 2022.
CLEARPATH ACTION. A “Reversible Rust” Battery That Could Transform Energy Storage. Youtube, julho de 2021. Disponível em: https://www.youtube.com/watch?v=1n1qZHni718&t=32s. Acesso em: 28 de junho de 2022.
COPPE/UFRJ – INSTITUTO ALBERTO LUIZ COIMBRA DE PÓS-GRADUAÇÃO E PESQUISA EM ENGENHARIA. Inventário e Cenário de Emissões dos Gases de Efeito Estufa da Cidade do Rio de Janeiro. COPPE/UFRJ, Rio de Janeiro, 2011. Disponível em: http://www.rio.rj.gov.br/dlstatic/10112/1712030/DLFE-222982.pdf/NelsonSINVENTARIOFINALMAC_Resumo_Geral_Inv_e_Cenario_v05abr_E.pdf. Acesso em: 28 de junho de 2022.
DREGER, I. Biogás: contribuição eco-econômica: Produção compartilhada ou condominial de biogás para pequenas propriedades rurais (Portuguese Edition). Novas Edições Acadêmicas, 2017.
DUFFY, A. et al. Land-based wind energy cost trends in Germany, Denmark, Ireland, Norway, Sweden and the United States. Applied Energy, v. 277, p. 1-14, 2020. Disponível em: https://doi.org/10.1016/j.apenergy.2020.114777. Acesso em: 28 de junho de 2022.
DW PLANET A. Geothermal energy is renewable and powerful. Why is most of it untapped? YouTube, dezembro de 2020. Disponível em: https://www.youtube.com/watch?v=c7dy0hUZ9xI. Acesso em: 28 de junho de 2022.
DW PLANET A. How solar energy got so cheap, and why it’s not everywhere (yet). YouTube, janeiro de 2021a. Disponível em: https://www.youtube.com/watch?v=sUvaYycoWqI&t=95s. Acesso em: 28 de junho de 2022.
DW PLANET A. Can carbon capture actually work? YouTube, janeiro de 2021b. Disponível em: https://www.youtube.com/watch?v=JHs-eWHb16g&t=105s. Disponível em: 28 de junho de 2022.
EGUTE, N. dos S. et al. Amônia como fonte de hidrogênio para utilização em células a combustível. 5º Congresso Internacional de Bioenergias, p. 1-6, 2010. Disponível em: https://www.ipen.br/biblioteca/2010/eventos/15803.pdf. Acesso em: 28 de junho de 2022.
EKELAND, A. et al. Is There a Future for Carbon Capture and Storage? Hradec Economic Days, 2021. Disponível em: DOI:10.36689/uhk/hed/2021-01-016. Acesso em: 26 de junho de 2022.
EMPRESA DE PESQUISA ENERGÉTICA – EPE. Potencial de redução de emissões de co2 em projetos de produção e uso de biocombustíveis. EPE, 2005. Disponível em: https://www.epe.gov.br/sites-pt/publicacoes-dados-abertos/publicacoes/PublicacoesArquivos/publicacao-250/topico-304/EPE%20-%202%C2%BA%20Biocombust%C3%ADveis%20x%20MDL[1].pdf. Acesso em: 27 de junho de 2022.
EPBR. André Clark, diretor geral da Siemens Energy Brasil. EPBR, Youtube, outubro de 2020. Disponível em: https://www.youtube.com/watch?v=DBUV0kkyFpw. Acesso em: 15 de Março de 2021.
FREITAS, E. P. de; ROSEIRA, A. M.; SAMPAIO, M. de A. Geopolítica do etanol: soberania energética e projeção internacional do Brasil (1930-2015). Revista Franco-Brasilera de Geografia, n° 45, 2020. Disponível em: https://doi.org/10.4000/confins.28332. Acesso em: 27 de junho de 2022.
FONTES, G. Geladeira ‘econômica’ gasta dobro do ideal, mas mantém desconto de imposto. Uol, Maio de 2021. Disponível em: https://economia.uol.com.br/noticias/redacao/2021/05/20/geladeira-gasto-energia-etiqueta-inmetro.htm. Acesso em: 27 de junho de 2022.
FERREIRA, L. Qual a pegada de carbono de R$ 1? Revista Galileu, s.d. Disponível em: http://revistagalileu.globo.com/Revista/Common/0,,EMI204587-17933,00-QUAL+A+PEGADA+DE+CARBONO+DE+R.html. Acesso em: 27 de junho de 2022.
FIUZA, R. da P. et al. A utilização de etanol em célula a combustível de óxido sólido. Química Nova, vol. 35, ed. 8, 2012. Disponível em: https://doi.org/10.1590/S0100-40422012000800025. Acesso em: 27 de junho de 2022.
FORM ENERGY. Battery Technology. Form Energy, julho de 2021. Disponível em: https://formenergy.com/technology/battery-technology/. Acesso em: 28 de junho de 2022.
GADIKOTA, G. Carbon Mineralization pathways for Carbon Capture, Storage and Utilization. Communications Chemistry, v. 4, n° 23, 2021. Disponível em: https://doi.org/10.1038/s42004-021-00461-x. Acesso em: 28 de junho de 2022.
GATES, B. A new way to invest in clean energy innovation: Breakthrough Energy Catalyst. Youtube, julho de 2021. Disponível em: https://www.youtube.com/watch?v=oD17uLWd2qA. Acesso em: 28 de junho de 2022.
GRAVITRICITY. Gravity Energy Storage. Gravitricity, julho de 2021. Disponível em: https://gravitricity.com/. Acesso em: 28 de junho de 2022.
GUERRA, J. B. S. O. de A.; YOUSSEF, Y. A.; Energias Renováveis – Energia Eólica. Livro Digital: Jelare, 2011. Disponível em: https://docplayer.com.br/583283-Energia-eolica-energias-renovaveis-paulo-roberto-rodrigues-jose-baltazar-salgueirinho-osorio-de-andrade-guerra-youssef-ahmad-youssef.html. Acesso em: 28 de junho de 2022.
HILL, L. B. PIVOT2021: Geothermal Reimagined Conference. [S.l.]: [s.n.], julho de 2021.
INTERNATIONAL ENERGY AGENCY. Net Zero by 2050. 4° revisão, outubro de 2021. Disponível em: https://iea.blob.core.windows.net/assets/deebef5d-0c34-4539-9d0c-10b13d840027/NetZeroby2050-ARoadmapfortheGlobalEnergySector_CORR.pdf. Acesso em: 24 de junho de 2022.
MEHRA, P. LC3 reduz pegada de carbono na construção. Valor, novembro de 2016. Disponível em: https://valor.globo.com/empresas/noticia/2016/11/04/lc3-reduz-pegada-de-carbono-na-construcao.ghtml. Acesso em: 28 de junho de 2022.
MELO, R. H. J. de. et al. Reciclagem metálica veicular com redução na emissão de co² e consumo energético. Revista Científica Multidisciplinar Núcleo do Conhecimento, ano 06, ed. 06, vol. 16, pp. 96-140. Junho de 2021. ISSN: 2448-0959, Link de acesso: https://www.nucleodoconhecimento.com.br/engenharia-mecanica/consumo-energetico, DOI: 10.32749/nucleodoconhecimento.com.br/engenharia-mecanica/consumo-energetico. Acesso em: 27 de junho de 2022.
MINARI, G. Bateria de ferro-ar 10x mais barata que o lítio armazena 100 horas de energia. CanalTech, julho de 2021. Disponível em: https://canaltech.com.br/inovacao/bateria-de-ferro-ar-10x-mais-barata-que-o-litio-armazena-100-horas-de-energia-190895/. Acesso em: 28 de junho de 2022.
MITIUKOV, N. W.; SPIRIDONOV, S. V.; SAMIGULLINA, G. Z. Cogeneration Plant Optimization. International Science and Technology Conference, p. 1-4, 2021. Disponível em: doi:10.1088/1757-899X/1079/4/042008. Acesso em: 28 de junho de 2022.
NATIONAL GEOGRAPHIC. Causes and Effects of Climate Change. YouTube, agosto de 2017a. Disponível em: https://www.youtube.com/watch?v=G4H1N_yXBiA. Acesso em: 24 de junho de 2022.
NATIONAL GEOGRAPHIC. Air Pollution 101. YouTube, outubro de 2017b. Disponível em: https://www.youtube.com/watch?v=e6rglsLy1Ys&t=16s. Acesso em: 24 de junho de 2022.
O’SHEA, R. et al. Using biogas to reduce natural gas consumption and greenhouse gas emissions at a large distillery. Applied Energy, v. 279, p. 1-20, 2020. Disponível em: https://doi.org/10.1016/j.apenergy.2020.115812. Acesso em: 24 de junho de 2022.
OGWU, C. E.; OLUWAFERANMI, F. M.; JOHNSON, A. I. Impact og Gas Flaring on Climate Change (A Case Study of Niger Delta Regiona of Nigeria). Global Scientific Journals, v. 09, ed. 05, p. 1781-1789, maio de 2021. Disponível em: https://www.globalscientificjournal.com/researchpaper/IMPACT_OF_GAS_FLARING_ON_CLIMATE_CHANGE_A_CASE_STUDY_OF_NIGER_DELTA_REGION_OF_NIGERIA_.pdf. Acesso em: 27 de junho de 2022.
PARKES, G. HUGHES, B. Monitoring Lubricants in the Digital Era. Machinery Lubrication, ed. 4, 2020. Disponível em: https://www.machinerylubrication.com/Read/31836/digital-lubricant-monitoring. Acesso em: 27 de junho de 2022.
RODGERS, L. Aquecimento global: a gigantesca fonte de CO2 que está por toda parte, mas você talvez não saiba. BBC News, dezembro de 2018. Disponível em: https://www.bbc.com/portuguese/geral-46591753. Acesso em: 28 de junho de 2022.
ROSA, L. et al. Hydrological Limits to Carbon Capture and Storage. Nature Sustainability, 2020. Disponível em: https://nature.berkeley.edu/matteolab/wp-content/uploads/2020/05/CCS-water-Nature-Sustainability-2020.pdf. Acesso em: 28 de junho de 2022.
SANTOS, T. S dos. et al. Análise da eficiência energética, ambiental e econômica entre lâmpadas de LED e convencionais. Eng Sanit Ambient, v. 20, n. 4, out/dez de 2015. Disponível em: DOI: 10.1590/S1413-41522015020040125106. Acesso em: 27 de junho de 2022.
SIMÕES DOS SANTOS, T. et al. Análise da eficiência energética, ambiental e econômica entre lâmpadas de LED e convencionais. Eng Sanit Ambient, p. 595-602, 2015.
SILVA, E. P. et al. O Etanol como Fonte de Hidrogênio para Células a Combustível na Geração Distribuída de Energia Elétrica. Tese (Doutorado em Engenharia Mecânica) – Universidade Estadual de Campinas, 2004.
SALATI, P. De onde vem o que eu como (e uso): resíduos da cana-de-açúcar geram o biogás, que vira energia elétrica e combustível substituto do diesel. G1, julho de 2021. Disponível em: https://g1.globo.com/economia/agronegocios/agro-a-industria-riqueza-do-brasil/noticia/2021/07/17/de-onde-vem-o-que-eu-como-e-uso-residuos-da-cana-de-acucar-geram-o-biogas-que-vira-energia-eletrica-e-combustivel-substituto-do-diesel.ghtml. Acesso em: 28 de junho de 2022.
THOMAS, J.; KUMAR, A.; KUMAR, A. Agricultural Methane Emissions: Consequences and Mitigations. International Journal of Current Microbiology and Applied Sciences, v. 02, ed. 09, p. 729-732, 2020. Disponível em: DOI: https://doi.org/10.20546/ijcmas.2020.902.089. Acesso em: 27 de junho de 2022.
TORRES, C. Nissan terá carros elétricos com célula de etanol para dispensar recarga. MobiAuto, junho de 2021. Disponível em: https://www.mobiauto.com.br/revista/nissan-tera-carros-eletricos-com-celula-de-etanol-para-dispensar-recarga/909. Acesso em: 27 de junho de 2022.
TEMPLE, J. What it will take to achieve affordable carbon removal. MIT Technology Review, junho de 2021. Disponível em: https://www.technologyreview.com/2021/06/24/1027083/what-it-will-take-to-achieve-affordable-carbon-removal/. Acesso em: 28 de junho de 2022.
TV BRASILGOV. Saiba mais sobre o Acordo ambiental de Paris. YouTube, outubro de 2016. Disponível em: https://www.youtube.com/watch?v=ih62P5U4-m8&t=485s. Acesso em: 24 de junho de 2022.
UFPR TV. Scientia – Tratamento de emissões e efluentes com microalgas. Youtube, novembro de 2016. Disponível em: https://www.youtube.com/watch?v=7EAGxzYF6bQ. Acesso em: 28 de junho de 2022.
VEJA. Siderúrgicas investem em “aço verde” para cumprir metas sustentáveis. Veja, julho de 2021. Disponível em: https://veja.abril.com.br/agenda-verde/siderurgicas-investem-em-aco-verde-para-cumprir-metas-sustentaveis/. Acesso em: 28 de junho de 2022.
WORLD HEALTH ORGANIZATION – WHO. Air pollution. World Health Organization, 29 Junho 2021. Disponível em: https://www.who.int/health-topics/air-pollution#tab=tab_1. Acesso em: 24 de junho de 2022.
ZANARDI, M. dos S.; COSTA JUNIOR, E. F. da. Tecnologia e perspectiva da produção de etanol no Brasil. Revista Liberato, v. 17, n° 27, p. 20-34, 2016. Disponível em: https://revista.liberato.com.br/index.php/revista/article/view/390. Acesso em: 27 de julho de 2022.
ZANK, J. C. C.; BRANDT, L. S.; BEZERRA, R. C.; PEREIRA, E. N. As características do biogás e avaliação de substituição de combustíveis. Exacta – Engenharia de Produção, vol. 18, n° 3, p. 502-516, 2020. Disponível em: DOI: https://doi.org/10.5585/exactaep.v18n3.10802. Acesso em: 28 de junho de 2022.
[1] Graduated in Petroleum Engineering from Universidade Estácio de Sá (UNESA), and Graduated in Mechanical Technology with emphasis in Industrial Automation from CEFET/RJ. Master’s student in Mechanical Engineering from the University of Taubaté (UNITAU), MBA in Business Management from Fundação Getúlio Vargas (FGV), MBA in Project Management from the Foundation supporting CEFET/RJ, Specialist in Occupational Safety Engineering from Universidade Candido Mendes (UCAM), Specialist in Petroleum Engineering from Universidade Estácio de Sá (UNESA) and certified Radioprotection Supervisor by CNEN. ORCID: 0000-0002-6647-3914.
[2] Advisor. Graduated in Architecture and Urbanism from the University of Taubaté, UNITAU, with a postgraduate degree in Marketing Management and Occupational Safety Engineering from the Polytechnic School of Pernambuco. Master in Regional Development Management from UNITAU and PhD in Production Engineering from Escola Politécnica da USP. ORCID: 0000-0001-8082-5763.
Sent: June, 2022.
Approved: June, 2022.