ORIGINAL ARTICLE
BITENCOURT, Emanoelen Bitencourt e [1], ALMEIDA, Karina Miranda de [2], SANTOS, Luana Mariza Morais dos [3], JÚNIOR, Antônio Pereira [4]
BITENCOURT, Emanoelen Bitencourt e. Et al. Physicochemical and microbiological characterization of the influence of residues on the water quality of the Tocantins River, left Bank (MARABÁ-PA). Revista Científica Multidisciplinar Núcleo do Conhecimento. 04 year, Ed. 06, Vol. 11, pp. 05-26. June 2019. ISSN: 2448-0959
SUMMARY
Water is vital to the continuity of life on the planet, but the quality of water bodies is altered by the inadequate disposal of dry and moist organic materials, especially in the urban environment, even if there are parameters and norms aimed at this problem. The objective of this research was the characterization of the water from the Tocantins River, in Marabá-PA, regarding physicochemical and microbiological water patterns, in two points under the influence of waste disposal, in the dry and rainy season, and relate the data obtained With legal regulations. The method employed was the deductive, the scope of the research was quantitative and qualitative and the procedure was experimental, performed from the use of the FUNASA Handbook, SABESP Standard, Winkler method and SMWW, with data Collection Association Documents, whose temporal clipping was between 2010 and 2018. The data obtained indicated that the physical water parameters are in agreement with the established for sweet Waters Class 2, CONAMA Resolution N. 357/2005, and in disagreement with the chemical water criteria. The data of the bathing standards indicated inappropriate water for the recreation of primary contact, because there is dumping of residual remnants, containing substances such as oils and greases, which are liable to cause health risks or compromise the recreation, According to resolution N. 274:2000. Therefore, the analyzed stretch of the river is in disconformity both in the classification of freshwater and in the bathing ability.
Keywords: bathing ability, classification of freshwater, quality water parameters.
1. INTRODUCTION
Water is a natural resource essential to life on Earth. On the other hand, the way of using this resource, occurs several times, improperly, which leads to non-maintenance of quality, lower availability and alteration of the natural characteristics of the tributary, which also has gas and solid solution. In addition to natural pollution, improper management of areas, lack of sewage treatment and indiscriminate disposal of waste are factors of great relevance in the degradation of water resources (BUZELLI; CUNHA-SANTINHO, 2013).
Moreover, urban and rural territories, through the improper disposal of waste and substances, contribute to impacts on water systems. Both can collaborate with discharges of organic and inorganic substances (some toxic), either directly in the water body, by seepage or infiltration of sources of pollution, such as products used for production and cleaning. These undue postings can cause damage to aquatic fauna and diseases in the population, moreover, the problem can be intensified by environmental degradation, such as the removal of the riparian forest (BELLUTA et al., 2016; SCORSAFAVA et al., 2010).
In relation to urban rivers, in which the water currents have the route in urban areas, the change in water quality represents a risk to sustainable progress in these places, especially in developing nations, such as Brazil. This is because the relationship of quality problems in the water bodies with the disposal of domestic or even industrial residues in these, still raw, that is, without adequate treatment, causes a negative increase of organic and inorganic substances to the river ( ISLAM et al., 2015; CHEN, 2017).
In this context, the problem of inadequate disposal of dry and moist organic materials, and the impacts caused by these, in the environment, has as main issue the appropriate destination of the remnants of these. As a result, the National Solid Waste Policy (PNRS) was instituted, Law N. 12,305:2010, Decree No. 7.404:2010, which has on the correct destination of waste, in order to mitigate the quantity produced by generators and environmental impacts. Therefore, it is necessary to strengthen the principles of sustainable waste management, by generators and the municipality, in order to comply with established policies (JACOBI; BESEN, 2011).
Consequently, in Brazil, water pollution is indubitable, this fact is associated with maladministration performed in the country, even if there are public resources invested to avoid this critical situation, in addition to the lack of rigor in the compliance with the policies of Waters, needing an effective cycle Plan, Do, Check, Act (PDCA[5], in English), to assist public policy, through the determination of actions, execution, monitoring and correction of the plan in a whole, for better management, and consequent conservation of quality of water resources, especially with regard to the improper disposal of waste (GONTIJO JÚNIOR, 2013).
Regarding the legislation on water quality in Brazil, the resolution CONAMA N. 357 (BRAZIL, 2005), the water of the river Tocantins is classified as sweet Class 2, in which the waters can be destined:
a) The supply for human consumption, after conventional treatment;
b) The protection of aquatic communities;
c) The recreation of primary contact, such as swimming, water skiing and diving, according to CONAMA Resolution N. 274 (BRASIL, 2000);
d) Irrigation of vegetables, fruit plants and parks, gardens, fields of sport and leisure, with which the public may come to have direct contact; And
e) Aquaculture and fishing activities (BRASIL, 2005, p. 4).
In the same resolution, in art. 15, the sweet Water standards of Category 2 are the same as those applicable to order 1, except:
II-thermotolerant coliforms: For use of primary contact recreation should be obeyed the CONAMA resolution N. 274 (BRAZIL, 2000). For other uses, a limit of 1,000 thermotolerant coliforms per 100 milliliters should not be exceeded in 80% or more than at least six samples collected during a one-year period, with bimonthly frequency. E. coli may be determined in substitution to thermotolerant coliform parameters according to limits established by the competent environmental agency;
IV- Turbidity: up to 100 UNT;
V – BOD5 to 20 °C until 5 mg/L O2;
VI-OD, in any sample, not less than 5 mg/L O2 (BRAZIL, 2005, p. 10).
Other patterns, for example, total phosphorus (Ptotal) for the optical environment, total nitrogen (Ntotal) and hydrogenionic potential (pH), also appear in this resolution (table 1).
Table 1-limits of quality standards of freshwater, Class 2. CONAMA.
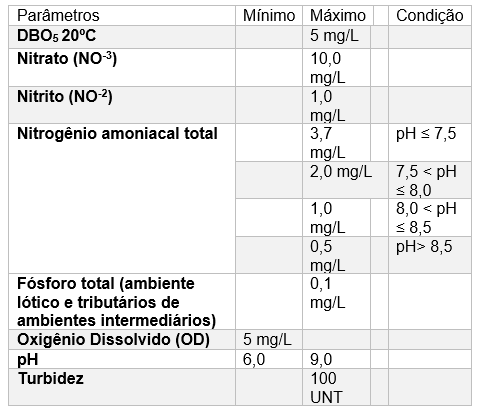
Subtitles: DBO: Biochemical oxygen demand. pH.: Hydrogenionic potential. NTU: nefelometric units of turbidity
In art. 14, paragraph I, of that resolution, are determined that supernatant materials, such as non-natural foams, oils and greases, substances that interfere with taste or smell, colouring of anthropic origin and solid waste objectionable must be Imperceptible, that is, they should not have organoleptic properties.
Already on the CONAMA resolution N. 274 (BRAZIL, 2000), cited in art. 15, paragraph II, CONAMA Resolution N. 357 (BRAZIL, 2005), which deals with the criteria of bathing, classifies the condition of freshwater, brackish and salt water in its own and improper categories. In art. 2 nd, § 1
st of resolution 274, the own waters are classified thus through results of the coliform count, and are classified in:
A) Excellent: when in 80% or more of a set of samples obtained in each of the previous five weeks, harvested at the same site, there are, at most, 250 fecal coliforms (thermotolerant) or 200 Escherichia coli or 25 Enterococcus for l00 milliliters;
b) Very good: when in 80% or more of a set of samples obtained in each of the previous five weeks, harvested at the same site, there are, at most, 500 fecal coliforms (thermotolerant) or 400 Escherichia coli or 50 Enterococcus for 100 milliliters;
c) Satisfactory: When in 80% or more of a set of samples obtained in each of the previous five weeks, collected at the same site, there is a maximum of 1,000 fecal coliforms (thermotolerant) or 800 Escherichia coli or 100 Enterococcus for 100 milliliters ( BRAZIL, 2000, p. 257).
As for improper ones, besides not meeting the standards for their own waters, they are evaluated in other ways (§ 4):
b) The value obtained in the last sampling is higher than 2500 fecal coliforms (thermotolerant) or 2000 Escherichia coli or 400 Enterococcus by 100 milliliters;
c) High or abnormal incidence in the region of water-borne diseases indicated by the health authorities;
D) presence of residues or dumps, solids or liquids, including sanitary sewage, oils, greases and other substances, able to offer health risks or make recreation unpleasant;
E) 6.0 <pH>9.0 (Sweet Waters), except for natural conditions;</pH>
f) Flowering of algae or other organisms, until it proves that they do not offer risks to human health;
g) Other factors that counterdictate, temporarily or permanently, the exercise of primary contact recreation (BRASIL, 2000, p. 257).
Thus, water pollution by domestic effluents, due to the deficiency of basic sanitation, is fact in the 143 municipalities of Pará, therefore, this research is justified, and these facts increase the relevance of the same, whose objective is to characterize the water Of the Tocantins River, Marabá-PA, regarding the physical, chemical and microbiological water parameters, in two points under the influence of the waste release, in the dry and rainy season, and relate the data obtained with the standards and legal norms.
2. MATERIAL AND METHODS
The materials used for measurements of environmental parameters such as temperature and hydrogenionic potential (pH) were ceded by the State University of Pará – UEPA (table 2).
Table 2 – Instruments used to measure environmental variables. Marabá – PA.
| Instruments | Brand | Model | Purpose |
| Thermometer | Instrutherm | Skein Type | Measuring the in situ water temperature |
| Ph Meter | OEM Product * | Measuring the hydrogenionic potential in situ of water | |
| Turbidimeter | MS Tecnopon | 1000P TB | Measuring ex situ Water turbidity |
| Scale | KNWaagen Field | 320/3 KN | Weigh bottles and culture media |
| Vertical Autoclave | Primatec | Cs | Sterilizing culture Media for microbiological analysis |
| Bacteriological Greenhouse | Ethik Technology | 403-3D | Incubate the culture media with the samples to analyze total coliforms |
| Bath-Maria | Hemochemistry | HM 1003 | Incubate the culture media with samples to analyze Thermotolerant coliforms |
| Magnetic stirrer with Heating | Quimis | Q261-22 | Evaporate water from samples for total residue analysis |
| Greenhouse for drying | Deleo | A2C 0208 | Dry the total residue |
* Original Equipment manufacturer. Source: Authors (2018).
The method employed was the deductive, synthesized by Matias-Pereira (2016), because the population growth occurred in the city under analysis, as well as the stagnation of the extension of basic sanitation, hinders the quality of water bodies. The research had quantitative and qualitative scope, with applied nature and exploratory procedure, described by Sakamoto and Silveira (2014).
This method was associated with a documentary survey with temporal clipping between 2010 and 2018, to obtain more recent secondary data in electronic links of free access, Scientific Eletronic Library Online (SciELO), commission of Improvement of the staff of the higher level (CAPES), Ministry of the Environment (MMA), Ministry of the City, town Hall of Marabá and Municipal secretariat of Sanitary surveillance of Marabá.
2.1 PHYSIOGRAPHY OF THE MUNICIPALITY
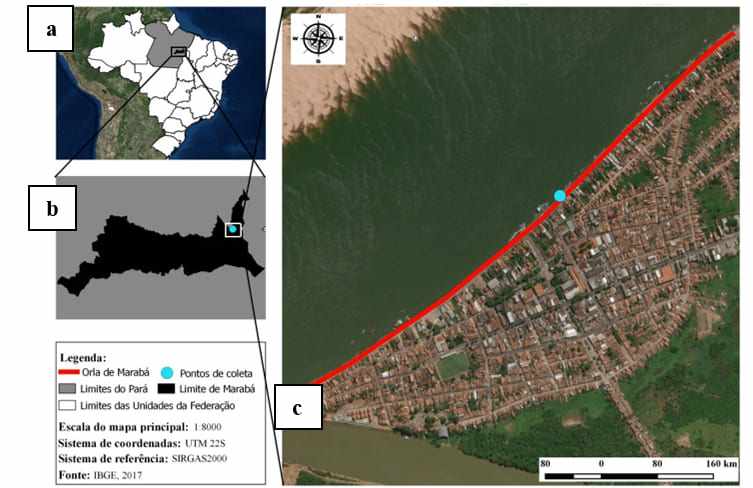
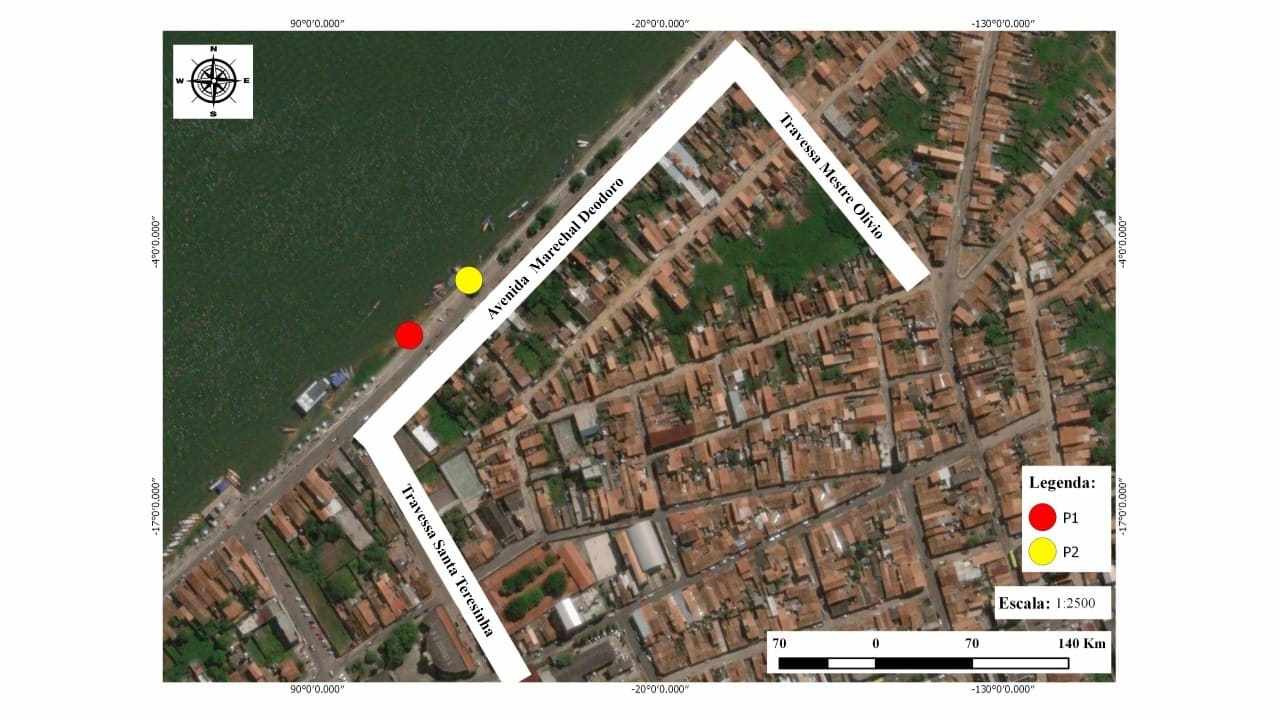
The research was carried out in the city of Marabá, located in the southeast Paraense mesoregion (Figure 1), and represented with the aid of OSGeo (2016), with headquarters identified in geographic coordinates 05 º 21 ‘ 54″ Latitude South and 04º 07’ 24″ Longitude WGr.
Figure 1 – a) Political map of the location of Pará; b) Physical map of location of Marabá; c) Top view of the subject area of this research: waterfront of Marabá-PA.
In Marabá, the environmental parameters (precipitation, temperature and relative humidity of the air), present, annually, trends of variations for more or less (table 3).
Table 3 -Values for averages in the three climatic decades analyzed. Marabá – PA.
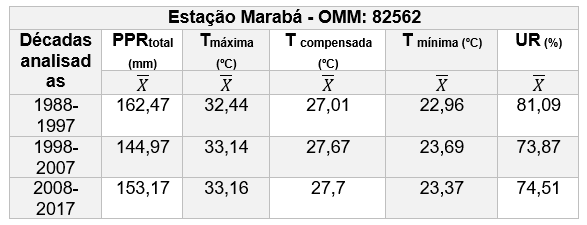
Subtitles: PPR: Precipitation. T: Temperature. RH: Relative humidity of the air.
The interval from December to May represents the rainy season and, from June to November the dry season, and the average annual temperature is 26.5 ºC, (maximum ± 31.0 ºC; minimum = 22.0 ºC). The municipality has the Pluvimetric index of about 2,000 mm/year, with high relative humidity (FAPESPA, 2016).
2.2 SAMPLING
The sampling corresponded to eight water collections, carried out in the range of December 2017 to September 2018 (four in the rainy season; four in the dry), against river flow, as recommended by the National Health Foundation (FUNASA, 2013) and the National Guide Collection and preservation of samples (BRANDÃO et al., 2011), on the left bank of the Tocantins River, Orla de Marabá-PA, perimeter between Av. Marechal Deodoro, Rua Santa Terezinha and Travessa Mestre Olivio, in two distinct points: P1, Delatitude 5.346618 ° S and longitude 49.135026 ° W; And P2, latitude 5.346257 ° S and longitude 49.134636 ° W (Figure 2).
Figure 2 – Planialtimetric positions of the collection points P1 and P2. Marabá – PA.
Subsequently, the samples were conducted for laboratory analysis, according to the recommended by the practical Manual of water analysis (FUNASA, 2013). These analyses occurred in the VetPlus Agribusiness Solutions Laboratory and were supplemented in the laboratories of practical classes (chemistry; Environmental and forestry engineering) of Campus VIII, Marabá – PA (table 4).
Table 4 – Specifications of the site in which the laboratory tests, type and method employed were made. Marabá – PA.
| Lab | Analysis Type | Laboratory analysis | Method used | Year of publication |
| VetPlus Agribusiness Solutions1 | Chemistry | DBO2; NT3 PT4 | SMWW6 | 2012 |
| Chemistry – UEPA | Chemistry | OD5 | Modified Winkler | S.D |
| Forestry and Environmental Engineering – UEPA | Physical | Total Residue | NTI 013 – SABESP7 | 1999 |
| Environmental Engineering – UEPA | Microbiological | Coliforms | FUNASA | 2013 |
1 Agribusiness Solutions; 2 Biochemical Oxygen Demand; 3 Total Nitrogen; 4 Total Phosphorus; 3 Dissolved Oxygen; 6 Standard Methods for the Examination of Water and Wastewater; 7 Internal Technical Standard of the basic sanitation Company of the state of São Paulo.
Source: Authors (2018).
2.3 STATISTICAL PROCESSING OF DATA
As for the statistical treatment of the data obtained, descriptive statistics was used, by the presence of quantitative, continuous and interval data, using: From the mean, the standard deviation (to observe the dispersion of observations made on The environmental parameters in relation to the intermediate values) and the coefficient of variation (in order to verify the homogeneity of the sample set obtained), in addition to the Pearson correlation, whose quantities for r were adapted from those used by Porto, Jesus and Pereira Junior (2017), with positive and negative patterns (table 5).
Table 5 – Values used for R.
| Values | Characterization | Relationship |
| 0 | There is no | There is no |
| 0.10 to 0.30 | Weak correlation | Direct |
| -0.10 A-0.30 | Weak correlation | Reverse |
| 0.40 to 0.60 | Mean correlation | Direct |
| -0.40 A-0.60 | Mean correlation | Reverse |
| 0.70 to 1.00 | Strong correlation | Direct |
| -0.70 A-1.00 | Strong correlation | Reverse |
Source: Adapted from the data contained in Porto, Jesus and Pereira Júnior (2017).
We used electronic spreadsheets contained in the software Excel (MICROSOFT CORPORATION, 2016) in the computational program BioEstat 5.3 (AYRES et al., 2007).
3. RESULTS AND DISCUSSION
3.1 PHYSICAL WATER PARAMETERS
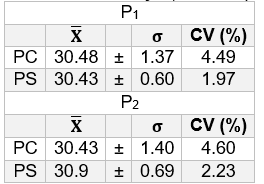
The analysis of the data obtained for pH indicated that, in both periods, the values obtained in P1 and P2 fall within the established standards (6.0 ≤ pH ≤ 9.0) in resolution N. 357 (BRASIL, 2005).
Table 5 – Mean values for pH (mean, standard deviation, coefficient of variation) obtained for P1 and P2, rainy and dry season. Marabá – PA.
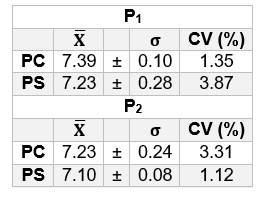
Subtitles: pH.: Hydrogenionic potential; PC: Rainy season. PS: Dry period; : M![]() ean σ: standard deviation. CV (%): Coefficient of variation.
ean σ: standard deviation. CV (%): Coefficient of variation.
The analysis of the statistical data allows to affirm that the values obtained for the pH are quite homogeneous, due to the average found for the standard deviation (0.08,<σ> 0.28) condense around the mean (7.23).
In the study carried out by Siqueira, Aprile and Miguéis (2012), in Parauapebas-PA, southeastern region of the state, they concluded that, for pH, there is a tendency of elevation/decrease for the values of this parameter approaching neutrality. This can be justified by the presence of sediments and high organic matter indices present naturally in the site, and also indicates that it is common to obtain low values in the Amazon region. The data obtained in this study indicate a tendency to neutrality, with slightly acidic variations, which corroborate the study in Parauapebas.
Although the Tocantins River has a source in the state of Goiás, in the Serra Dourada, between the municipalities of Ouro Verde de Goiás and Petrolina de Goiás, has the mouth in Pará, and crosses the municipality of Marabá. In this case, the geological characteristics, such as the predominance of the red-yellow podzolic soil, and climatic, as the average annual temperature of the municipalities (Marabá = 26.5 º C; Parauapebas = 26.35 º C), are similar, which explains the similarity of the values obtained.
As in Marabá was proven the launch of effluent at the margins from which the collections were made, the tendency to neutrality can be justified by the stable nutritional offer, that is, the organic matter rates arising from the effluent dumps along the Suspended sediments of natural origin did not present major alterations during the research period, which confers a pH with a tending to neutrality, which reveals similarity with the research conducted in Parauapebas.
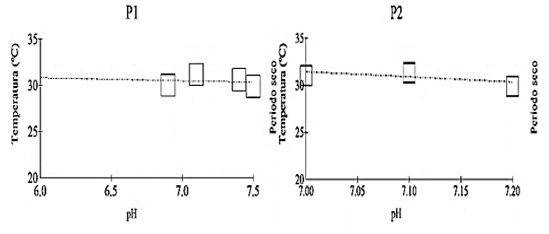
For the interrelation between water parameters, the obtained data indicated that the pH is interferred with water temperature, especially during the rainy season (P1, r = 0,43; P2,r = -0,86), where it becomes slightly acidic. In the dry season, the tendency is for alkalinity (P1, r = -0,14; P2, r = -0,65). In this case, it is verified that these parameters are, in the hydric body, inversely proportional quantities because the temperature, in the dry period, rises and the deposition of MO, carried by rain, in the water body decreases, which can be evidenced by Concentration of the RE (9,38 < OD >11,2 mg/L), in P1 and P2, respectively (Figure 3).
Figure 3 – Correlation between temperature and pH in the dry period in P1 and P2.
In relation to the measured temperature values, there was no significant difference between the points P1 and P2 in the rainy season and in the dry season (table 6).
Table 6 – Mean values for temperature (mean, standard deviation, coefficient of variation) obtained for P1 and P2, rainy and dry season. Marabá – PA.
Subtitles: pH.: Hydrogenionic potential. PC: Rainy season. PS: Dry period. Σ: Standard deviation. CV (%): Coefficient of variation.
The analysis of the statistical data allows to affirm that the values obtained for temperature are slightly varied, due to the averages found for the standard deviation (0.6 <σ>, 1.4), with numbers more distributed around the mean (30.56).
The tendency to balance in the two analyzed periods is dependent, internally, on seasonal and diurnas variations, in addition to vertical stratification. Externally, latitude, altitude, seasons, periods of the day, flow rates and depth. Another factor is the effluent dump. In this case, the analyzed points receive effluent through washers. However, this dump was not enough to cause temperature elevation.
In the research conducted in Ilha do Marajó, by Alves et al. (2012), it was indicated that values between 27 ºC and ≅ 31 ºC can be justified by the natural characteristics of the Amazonian waters, where the trends of temperature variation occur according to variations of atmospheric parameters, therefore, the smallest Temperatures are related to increased cloud coverage, which decreases the solar incidence in the river, while the larger ones when there is higher solar incidence.
These changes occur not from one seasonal period to another, but rather in small variations throughout the year. This was also observed in this study, considering that there was no significant difference in temperature in both periods, which corroborates the research carried out on the island of Marajó.
It is also noted that the means and standard deviation did not present discrepancy in the two points, regardless of the seasons, indicating that the trends of elevation or decrease in temperature are independent of the seasonal periods, which corroborates with the research on the island of Marajó.
Turbidez has as its limit established up to 100 nefelometric units of Turbidez (UNT) by resolution N. 357 the values obtained in this study varied significantly over the periods and according to the points (table 7) (BRAZIL, 2005).
Table 7 – Mean values for turbidity (mean, standard deviation, coefficient of variation) obtained for P1 and P2, rainy and dry season. Marabá – PA.
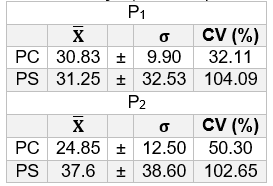
Subtitles: PC: Rainy season. PS: Dry period. ![]() Average. Σ: Standard deviation. CV (%): Coefficient of variation.
Average. Σ: Standard deviation. CV (%): Coefficient of variation.
The analysis of the statistical data allows to affirm that the values obtained for turbidity are quite varied, as well as the high standard deviation (9.9 <σ>, 38.6), which is well distributed around the average (31.13).
The data obtained and analyzed in the two sampling points of this study, in P1, the tendency was decrease (8 NTU), with homogeneous distribution of the particles (σ = 32.51 NTU; x = 31.25 NTU), and elevation in P2 (95 NTU). This may be related to both the rainy and dry periods, indicating that there is a tendency of low scattering of particles that interfere in turbidity (e.g. suspended solids, organic debris, etc.). In both analyzed points, there is presence of sanitary sewage washers, however, its presence does not interfere in turbidity.
In the pluvial period, the data analyzed from P1 and P2 were low and more homogeneous, however in the drought, were more dispersed, with maximum in June and August, respectively, therefore, all are within the allowed. Although the average of the points did not change dramatically, the coefficient of variation shows that the data have divergences throughout the research, indicating that the levels of turbidity varied not only along the months of the year, but also from a collection to Other, especially in the months of drought. Such unexpected data can be explained by Anthropic Interferences.
Buzelli and Cunha-Santino (2013), in a study carried out in Barra Bonita-SP, concluded that, although the turbidity index increases in the rainy period naturally due to the sediment loading in the water, the sewage dump contributes to the increase of particles Suspension and consequent elevation of turbidity in both periods. In Marabá, the analysis of the data obtained indicated that there is a similarity between this research and that performed in Barra Bonita.
The analysis of the data obtained from the total residue parameter indicated that there was a tendency to variations in the concentrations of the residues, which were calculated only for the intact value, with no fractionation of the residues (table 8).
Table 8 – Mean values for Total residue (mean, standard deviation, coefficient of variation) obtained for P1 and P2, rainy and dry season. Marabá – PA.
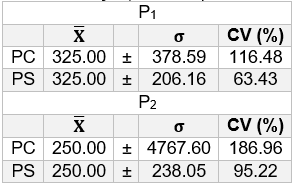
Subtitles: PC: Rainy season. PS: Dry period. ![]() Average. σ: Standard deviation. CV (%): Coefficient of variation.
Average. σ: Standard deviation. CV (%): Coefficient of variation.
The coefficient of variation of the data indicates that they diverge both in comparison to the periods and in relation to the points. However, the averages remain in the points when the rainy season is compared to dry.
In both points, the analyzed values may be related to the presence of dumping of untreated effluent, residues and fishing activities at the site, as seen in the research conducted by Silva and Araújo (2017), in São Paulo-SP, and which was observed in this research Near the collection sites, a determinant factor in the data of this parameter over the periods.
3.2 CHEMICAL WATER PARAMETERS
The data obtained for BOD indicated that the concentrations, both in P1 and in P2, on average, were higher, in two to five times more when compared to the permitted reference value: 5 mg/L (table 9).
Table 9 – Mean values for BOD (mean, standard deviation, coefficient of variation) obtained for P1 and P2, rainy and dry season. Marabá – PA.
Subtitles: DBO: Biochemical oxygen demand. PC: Rainy season. PS: Dry period. Average. σ: Standard deviation. CV (%): Coefficient of variation.
The analysis of the data obtained indicated higher concentrations of DBO, in P2, rainy season, in this case, there may have been less entry of organic matter, by runoff, or via effluent washer, as this did not have depletion of the BOD, or even the Mineralization occurred in a slow way, because, at the stretch, there was, at the same point, a reduction (4.35 mg/L), below the reference value (BRAZIL, 2005).
This indication is justified by the fact that, during the rainy season, the water temperature tends to balance, that is, it does not suffer elevation, so there is no expressive loss of oxygen gas (O2) to the atmosphere, as in the dry period. It was noted that the BOD concentrations obtained in the months of December, January and June in both points are above the limit (5mg/L) recommended by Resolution N. 357, as well as that of the month of September in P1 (BRAZIL, 2005).
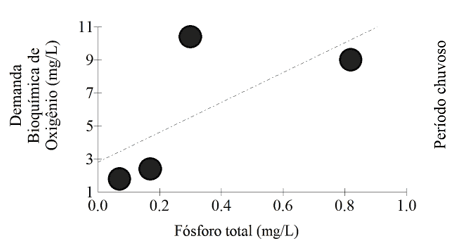
In Rio Branco – AC, Santi et al. (2012) conducted a research on the values of BOD in rivers, and the data processed are justified by the high presence of sanitary sewage in the area, and it is also considered, from the geological point of view of the Amazon region, the presence of organic matter originating from Natural processes. These facts were also verified in Marabá-PA, as it was also observed a great concentration mainly in the rainy season in P1 as it is justified by Pearson’s value for BOD and total phosphorus of 0.6787, which is characterized as a direct correlation (Figure 4).
Figure 4 – Pearson correlation of BOD and total phosphorus in the rainy season in P1.
In the months of February, March, July and August, in both points, and in the month of September in P2, the BOD concentrations are in accordance with the standards established by resolution N. 357, which can relate to the average flow of the Tocantins River before the dry season and the tendency to increase the temperature (BRAZIL, 2005).
In the dry period, the data indicated that both in P1 and P2, there was a tendency to decrease in the concentrations of BOD (1,20< DBO>5 mg/L). These values are in non-conformance with the recommended resolution CONAMA 357 (BRASIL, 2005), which establishes a value equal to 5 mg/L.
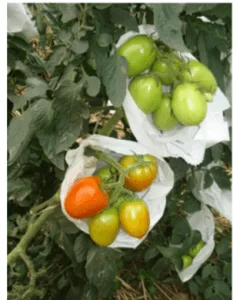
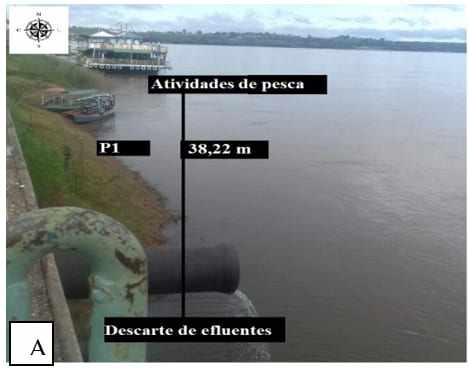
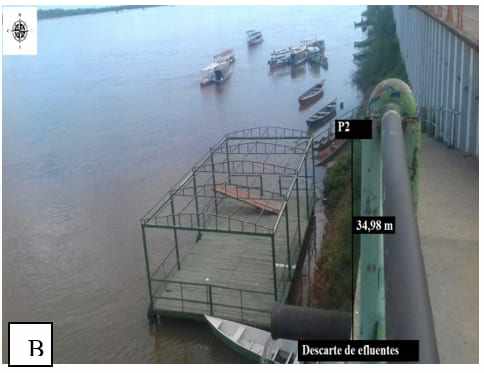
The lower BOD rates may be related to the presence of waste disposal generated in the establishments and residences, in the water, in addition to fish fishing activities P1 (Figure 5 A), as well as launching of untreated sewage, which can also be seen In the vicinity of P2 (Figure 5b).
Figure 5 – A) The presence of fishing activities close to P1; B) Dumping of wastewater near the collection point P2.
In Bragança – PA, in the Caeté River (GORAYEB; LOMBARD PEREIRA, 2010), and on the Araguari River (BÁRBARA et al., 2010), the latter goes through three municipalities: Porto Grande, Ferreira and Cutias-PR, studies on the concentrations of BOD in dry period were carried out. The authors concluded that these are interconnected the tendency to increase the temperature in the water, as well as the flow velocity in the annual period. In the Tocantins River, data from these parameters may justify the differences in concentrations due to the influence of these variables, because the samples were collected in two seasonal periods: rainy and dry.
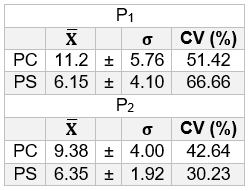
Regarding the concentrations of total nitrogen, in both points and period, the data obtained indicated only one concentration in disagreement with the recommended (3.7 mg/L for pH ≤ 7.5) in resolution N. 357, and was in P1, in September (table 10) (BRASIL, 2005).
Table 10 – Mean values for Total nitrogen (mean, standard deviation, coefficient of variation) obtained for P1 and P2, rainy and dry season. Marabá – PA.
Subtitles: NTotal: Total nitrogen. PC: Rainy season. PS: Dry period. ![]() Average. σ: Standard deviation. CV (%): Coefficient of variation.
Average. σ: Standard deviation. CV (%): Coefficient of variation.
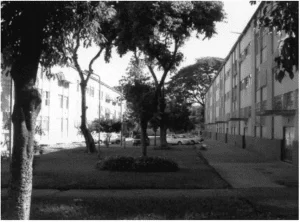
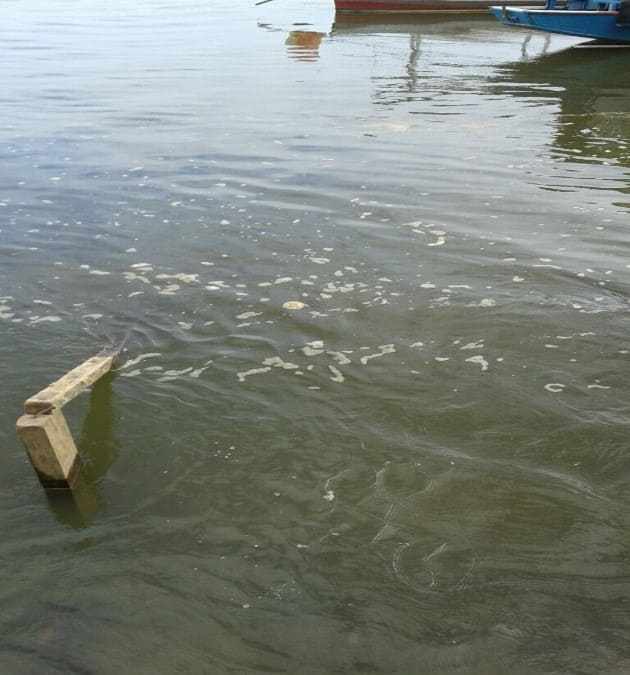
Study conducted by Santi et al. (2012), in Rio Branco – AC, concluded that similar values are justified due to the decomposition processes of organic matter, releasing nitrogenous compounds. The data obtained from the Tocantins River collections, including the above standards, may be related to the presence of the emission point of domestic wastewater without previous treatment near the points, which is noticeably noticed on the surface of the water (Figure 6), in Disagreement with art. 14, paragraph I of the CONAMA resolution referred to above.
Figure 6 – Foams from the effluent dumped near points P1 and P2, Marabá-PA.
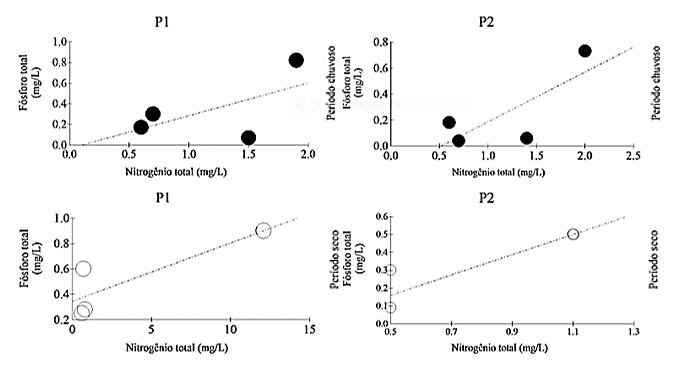
As shown in Figure 4, the values obtained in Pearson’s correlation also highlight the excess of organic load in the river due to the increasing ratio of nitrogen and phosphorus, which in the rainy season were 0.5988 in P1 and 0.7739 in P2, parameters Directly related, while in the dry period at the two collection points, “R” was greater than 0.70 (P1 = 0,856; P2 = 0,8642), characterizing the correlation between these variables as strong, direct and positive (Figure 7).
Figure 7 – Graphs of the Pearson correlation of total nitrogen and total phosphorus of the collection points (P1 and P2) in the rainy and dry season.
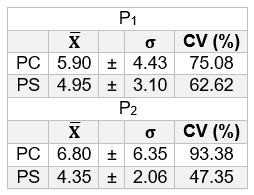
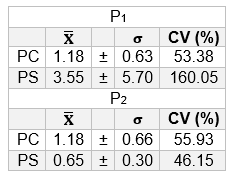
The values allowed for the total phosphorus are equivalent to 0.1 mg/L, however, the research data in Marabá showed trends to elevation in P1 and P2 (table 11).
Table 11 – Mean values for Total phosphorus (mean, standard deviation, coefficient of variation) obtained for P1 and P2, rainy and dry season. Marabá – PA.
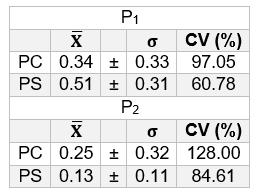
Subtitles: PTotal: Total phosphorus. PC: Rainy season. PS: Dry period. ![]() Average. Σ: Standard deviation. CV (%): Coefficient of variation.
Average. Σ: Standard deviation. CV (%): Coefficient of variation.
The research conducted by Ríos-Villamizar, Martins Júnior and Waichman (2011) in the municipalities of Boca do Acre and Beruri-AC, indicated a relation to similar values and proximity to the beginning and end of the rainy season, where the greatest detritic load, erosions and Sediment loading is transported in the waters, in addition to the presence of organic matter. The maximum values obtained in Marabá also resemble these periods, corroborating the research carried out in Acre.
The data of dissolved oxygen in the rainy season were elevated in P1 and P2, while in the dry season there was a decrease (table 12).
Table 12 – Mean values for dissolved oxygen (mean, standard deviation, coefficient of variation) obtained for P1 and P2, rainy and dry season. Marabá – PA.
Subtitles: OD: dissolved oxygen. PC: Rainy season. PS: Dry period.
![]() Average. σ: Standard deviation. CV (%): Coefficient of variation.
Average. σ: Standard deviation. CV (%): Coefficient of variation.
The data, when compared to the CONAMA resolution N. 357:2005, was lower than allowed (5 mg/L), verified in P1, in the months of March, June, July and September, both with a concentration of 4.1 mg/L. In the study conducted by Oliveira E Cunha (2014), in Laranjal do Jari – AP, concluded that the high temperature decreases the solubility of oxygen in the water due to the high solar incidence.
3.3 FOR MICROBIOLOGICAL ANALYSIS
The analysis of the data obtained for total coliforms indicated that, both in P1quanto in P2, there is occurrence, in both periods of collection, and this is harmful both the water quality and the bathing of the Tocantins River, because, in front of the place where the Research, there is an alvius that the population of the area calls “Tucunaré Beach”, very frequed by bathers during the Amazonian summer.
The averages of the most probable number (NMP) of the total coliforms, both in the rainy and dry seasons, in both points, exceeded 1,000/100 ml (table 13).
Table 13-mean values for total coliforms (mean, standard deviation, coefficient of variation) obtained for P1 and P2, rainy and dry season. Marabá – PA
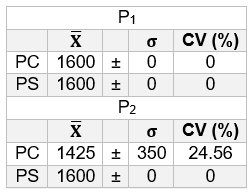
Subtitles: ColTotal: Coliformes total. PC: Rainy season. PS: Dry period.
![]() Average. σ: Standard deviation. CV (%): Coefficient of variation.
Average. σ: Standard deviation. CV (%): Coefficient of variation.
The data obtained indicated a single month in which the NMP was lower than 1600 in March in P2. These high values can be justified by the direct dumping of sewage occurring in the Orla de Marabá. In the research carried out by Martins et al. (2017), in the municipalities of João Pessoa and Cabedelo – PB, on the beach of Cabo Branco, indicated the influence of sewage in the quality of water, which was considered unsuitable for balneability. However, in the month of August, in P2, the determination of the NMP was impaired, because the combination of positive tubes obtained (5-0-5) is not found in the table of the Manual of FUNASA (2013).
The averages of the most probable number (NMP) of the Thermotolerant coliforms, both in the rainy and dry seasons, in both points, also exceeded 1,000/100 ml (table 14).
Table 14 – Mean values for thermotolerant coliforms (mean, standard deviation, coefficient of variation) obtained for P1 and P2, rainy and dry season. Marabá – PA.
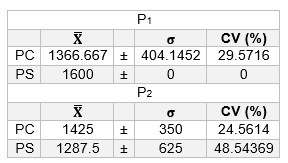
Subtitles: ColTermo: Thermotolerant coliforms. PC: Rainy season. PS: Dry period. ![]() Average. σ: Standard deviation. CV (%): Coefficient of variation.
Average. σ: Standard deviation. CV (%): Coefficient of variation.
Regarding this parameter, the data indicated two months in which the NMP was lower than 1600 in February, P1, and in March and July, in P2. Moreover, the NMP was indeterminated by the combinations of positive tubes obtained in December (4-5-4) and September (0-5-3), in P1, since they are also not shown in the table of the FUNASA Manual (2013).
4. CONCLUSION
The characterization of the water from the Tocantins River, Marabá – PA, in the rainy and dry period, in the analyzed section, which is influenced by the release of residues, indicated as to the water physical hydrological parameters, compliance with the established for freshwater Class 2, according to the classification of the CONAMA resolution N. 357 (BRASIL, 2005). However, for the same water class, the characterization of water chemical hydrological parameters indicated disagreement with this resolution.
For bathing standards, according to resolution N. 274 (BRAZIL, 2000), the water of the Tocantins River is considered inappropriate for the recreation of primary contact, because there is the dumping of solids and liquids, containing substances such as oils and greases that are liable to cause health risks or compromise the leisure of the population.
REFERENCES
ALVES, I. C. C.et al. Qualidade das águas superficiais e avaliação do estado trófico do Rio Arari (Ilha de Marajó, norte do Brasil). Acta Amazônica, v. 42, n. 1, p.115-124, jan./dez. 2012.
AYRES, M. et al. BioEstat 5.3: aplicações estatísticas nas áreas das ciências biológicas e médicas. Belém: MCT; IDSM; CNPq, 2007. 364 p.
BÁRBARA, V. F. et al. Monitoramento sazonal da qualidade da água do rio Araguari/AP. Revista Biociências, Taubaté, v. 16, n. 1, p. 57-72, jul./dez. 2010.
BELLUTA, I. et al. Qualidade da Água, Carga Orgânica e de Nutrientes na Foz do Córrego da Cascata: Contribuição da Sub-Bacia para a Represa de Barra Bonita, Rio Tietê (SP). Revista Brasileira de Geografia Física, v. 09, n. 01, p. 305-318, jan./fev.2016.
BUZELLI, G. M.; CUNHA-SANTINO, M. B. Análise e diagnóstico da qualidade da água e estado trófico do reservatório de Barra Bonita, SP. Ambiente e Água – An Interdisciplinary Journal of Applied Science, Taubaté, v.8, n.1,p.186-205,abr.2013.
BRANDÃO, C. J. et al. (Org.). Guia Nacional de Coletas e Preservação de amostras: água, sedimentos, comunidades aquáticas e efluentes líquidas. Brasília: ANA-CETESB. Agência Nacional de Águas – Companhia de Saneamento do Estado de São Paulo, 2011.
BRASIL. Resolução n. 274, de 29 de novembro de 2000, do Conselho Nacional do Meio Ambiente – CONAMA. Revogada pela Resolução n. 357:2005. Define os critérios de balneabilidade em águas brasileiras. Diário Oficial [da] República Federativa do Brasil.n.18, de 25 de janeiro de 2001, Seção 1, páginas 70-71. Disponível em: <http://www.mma.gov.br/port/conama/legiabre.cfm?codlegi=272>. Acesso em: 06 fev. 2018.
BRASIL. Resolução n. 357, de 17 de março de 2005, do Conselho Nacional do Meio Ambiente – CONAMA. Alterada pela Resolução 410:2009 e pela 430:2011. Dispõe sobre a classificação dos corpos de água e diretrizes ambientais para o seu enquadramento, bem como estabelece as condições e padrões de lançamento de efluentes, e dá outras providências. Diário Oficial [da] República Federativa do Brasil. n. 053, de 18 de março de 2005, páginas. 58-63. Disponível em: <http://www.mma.gov.br/port/conama/res/res05/res35705.pdf>. Acesso em: 05 fev. 2018.
CHEN, W. Y. Environmental externalities of urban river pollution and restoration: a hedonic analysis in Guangzhou (China). Landscape and Urban Planning, v. 157, p. 170-179, 2017.
FAPESPA. FUNDAÇÃO AMAZÔNIA DE AMPARO A ESTUDOS E PESQUISAS. Estatísticas Municipais Paraenses: Marabá. Diretoria de Estatística e de Tecnologia e Gestão da Informação. Belém, n. 1, jul./dez. 2016. 60 f.
FUNASA.FUNDAÇÃO NACIONAL DE SAÚDE. Manual prático de análise de água. 4. ed. Brasília: Funasa, 2013. 150 p.
GONTIJO JÚNIOR, W. C. Uma avaliação da política brasileira de recursos hídricos baseada em dez casos de estudo. 2013. 330 f. Tese (Doutorado em Tecnologia Ambiental e Recursos Hídricos). Universidade de Brasília, Faculdade de Tecnologia, Programa de Pós-Graduação em Tecnologia ambiental e Recursos Hídricos. Brasília, 2013.
GORAYEB, A.; LOMBARDO, M. A.; PEREIRA, L. C. C. Qualidade da água e abastecimento na Amazônia: o exemplo da bacia hidrográfica do rio Caeté. Mercator – Revista de Geografia da UFC, Fortaleza. v. 9, n. 18, p. 135-157, jan./abr. 2010.
IBGE – Instituto Brasileiro de Geografia e Estatística. Mapas. Bases e Referenciais. 2017. Disponível em: <ftp://geoftp.ibge.gov.br/organizacao_do_territorio/malhas_territoriais/malhas_municipais/municipio_2015/Brasil/BR/>. Acesso em: 01 jun. 2018.
INMET –Instituto Nacional de Meteorologia. Banco de Dados Meteorológicos para Ensino e Pesquisa. 2018Disponível em: <http://www.inmet.gov.br/portal/index.php?r=bdmep/bdmep >. Acesso em: 25 fev. 2018.
ISLAM, M. S. et al. Heavy metal pollution in surface water and sediment: apreliminaryassessment of an urban river in a developing country. Ecological Indicators, v. 48, p. 282-291, 2015.
JACOBI, P. R.; BESEN, G. R. Gestão de resíduos sólidos em São Paulo: desafios da sustentabilidade. Estudos Avançados, São Paulo, v. 25, n. 71, p. 135-158, abr. 2011.
MARTINS, L. M. M. et al. Análise dos parâmetros de Balneabilidade: um estudo de caso sobre as praias dos municípios de João Pessoa e Cabedelo/PB. Revista InterScientia, João Pessoa, v. 5, n. 1, p. 116-128, abr. 2017.
MATIAS-PEREIRA, J. Manual de metodologia da pesquisa científica. 4. ed. São Paulo: Atlas, 2016.
MICROSOFT CORPORATION. Inc. Excel. Versão 1811. Software, 2016.
OLIVEIRA, B. S. S.; CUNHA, A. C. Correlação entre qualidade da água e variabilidade da precipitação no sul do Estado do Amapá. Revista Ambiente e Água, Taubaté, v. 9, n. 2, p. 261-275, abr./jun.2014.
OSGEO – Open Source Geoespatial Foundation. Inc. QGis. Versão 2.18. Software, 2016.
PORTO, M. L.; JESUS, E. S.; PEREIRA JUNOR, A. Análise das tendências nas relações entre fluxo de veículos, arborização e os níveis de intensidade de ruído. Ecologia e Nutrição Florestal, Santa Maria, v.5, n.3, p.87-97, set./dez. 2017.
RÍOS-VILLAMIZAR, E. A.; MARTINS JÚNIOR, A. F.; WAICHMAN, A. V. Caracterização físico-química das águas e desmatamento na Bacia do rio Purus, Amazônia Brasileira Ocidental. Revista Geográfica Acadêmica, Goiânia, v.5, n.2, p. 54-65, jul./dez. 2011.
SAKAMOTO, C. K.; SILVEIRA, I. O. Como fazer projetos de iniciação científica. São Paulo: Paulus, 2014.
SANTI, G. M. et al. Variabilidade espacial de parâmetros e indicadores de qualidade da água na sub-bacia hidrográfica do igarapé São Francisco, Rio Branco, Acre, Brasil. Ecología Aplicada, Lima, v. 11 n. 1, p. 23-31, jan./ago. 2012.
SCORSAFAVA, M. A. et al. Avaliação físico-química da qualidade de água de poços e minas destinada ao consumo humano. Revista do Instituto Adolfo Lutz, São Paulo, v. 69, n. 2, p. 229-232, abr./jun. 2010.
SILVA, M. A.; ARAÚJO, R. R. Análise temporal da qualidade da água no córrego limoeiro e no Rio Pirapozinho no estado de São Paulo – Brasil. Revista FORMAÇÃO (ONLINE), São Paulo, v. 1, n.24, p. 182-203, jan. /abr. 2017.
SIQUEIRA, G. W.; APRILE, F.; MIGUÉIS, A. M. Diagnóstico da qualidade da água do rio Parauapebas (Pará – Brasil). Acta Amazonica, Manaus, v. 42, n. 3, p. 413-422, jul. /set. 2012.
[1] Graduated in environmental engineering.
[2] Graduated in environmental engineering.
[3] Graduated in environmental engineering.
[4] Master in Environmental Sciences.
Submitted: February, 2019.
Approved: June, 2019.