ORIGINAL ARTICLE
ALVES, Vinícius do Carmo [1]
ALVES, Vinícius do Carmo. Direct comparative method of market data: Influence of pilotis on unit value. Revista Científica Multidisciplinar Núcleo do Conhecimento. Year 05, Ed. 10, Vol. 05, pp. 65-80. October 2020. ISSN: 2448-0959, Access link: https://www.nucleodoconhecimento.com.br/environmental-engineering-en/influence-of-pilotis
SUMMARY
This study aims to estimate the influence of the pilotis variable on the formation of the unit value of the average square meter in apartments located in The Asa Sul, Brasília-DF, through statistical analysis tools available in the TS-Sisreg Software.The data used for the development of this study were collected from the real estate market in Brasília and the sample consisted of 30 offer data, however, for the development of the value-r model, 28 data were used. For the development of the model, the direct comparative method of market data was adopted. The comparative method is the most widely adopted in the evaluation of goods and serves to identify the market value of the good through technical treatment of the attributes of the comparable elements, constituents of the sample. The variables considered in the model were: useful area, pilotis, garage and rooms. The results showed that pilotis are a relevant variable in the development of the value formation model. Therefore, it is concluded that the comparative method of market data proved to be adequate for the proposed objective, that the variables initially raised were relevant for the formation of the model and that the absence of pilotis has deleterious effects on the formation of the unit value of apartments located in buildings located in Asa Sul, Brasília-DF.
Keywords: Asset Valuation, statistical inference, comparative method.
1. INTRODUCTION
Designed by Lucio Costa, following modernist precepts, Brasilia was built between 1956 and 1960. The residential areas of the city, known as Superquadras, are green areas of approximately 250m by 250m, in which the ground is public and there is no presence of fences and walls, such a situation is possible thanks to the presence of pilotis that are the use of pillars that elevate the building from the ground, allowing circulation underneath it (ARIOLI et al., 2015).
According to Amorim and Flores (2005) the Superquadras form four linear lanes, parallel to the road axis, and the tracks to the west of the axis house blocks 100 and 300 while those in the east, blocks 200 and 400. Each of the four sets is numbered from 1 to 16, from the crossing of the axes towards the end of the wings.
Despite the initial prediction of public and free soil, in some Superquadras of the Asa Sul there are examples of eddy typology without pilotis, popularly known as JK blocks. Thus, the following question arises, does the absence of pilotis influence the formation of the unit value of the square meter in apartments located in the Asa Sul in the Brasilia Pilot Plan?
According to Holland (2007) the blocks “JK”, in the row of the “400” blocks of the South Asa, did not exist in the original design of the Pilot Plan. It has three floors, but no pilotis, no elevators, no garages
Thus, the present work offers a contribution in the area of Evaluation Engineering, with a key role in determining the weight of a dissonant architectural characteristic when considered as a variant in a linear regression model.
The NBR-14653-1 defines the evaluation of goods as the technical analysis, performed by an evaluation engineer, to identify the value of a good, its costs, fruits and rights, as well as to determine indicators of the feasibility of its economic use, for a given purpose, situation and date.
NBR 14653:1 (2001) identifies the general evaluation procedures in order to identify the value of a good, its fruits and rights, being:
- Direct comparative method of market data: identifies the market value of the good through technical treatment of the attributes of comparable elements, constituents of the sample;
- Involutive method: identifies the market value of the good, based on its efficient use, based on a model of technical and economic feasibility study, through hypothetical enterprise compatible with the characteristics of the good and with the market conditions in which it is inserted, considering viable scenarios for the execution and commercialization of the product;
- Evolutionary method: identifies the value of the good by the sum of the values of its components. If the purpose is to identify the market value, the marketing factor should be considered;
- Income capitalization method: identifies the value of the good, based on the present capitalization of its expected net income, considering viable scenarios.
Defined the method to be used, the choice of variables is an extremely important factor for the generation of representative models.
According to NBR-14653-2 (2011) the variables can be independent which are those that give logical content to the variation of market prices collected in the sample or dependents that are those whose behavior is intended to be explained by the independent variables. In addition, the standard still defines the variables in quantitative ones that are those that can be measured or counted and qualitative that are those that cannot be measured or counted, but only ordered or hierarchical, according to attributes inherent to the good.
Regarding the choice of variables in the direct comparative method of market data, NBR 14653-2 (2011) recommends that quantitative variables be adopted whenever possible. As for qualitative independent variables the standard determines the following order of priority:
- Use of as many dichotomous variables as necessary, especially when the amount of data is abundant and the degrees of freedom necessary for statistical modeling can be preserved;
- Use of proxy variables that are the variables used to replace another variable difficult to measure and that presumes to keep with it a pertinence relationship, obtained through indicators published or inferred in other market studies;
- By means of adjusted codes, when the values are extracted from the sample using the coefficients of dichotomous variables that represent each of the characteristics;
- Through allocated codes, which are logical scales ordered to differentiate the qualitative characteristics of real estate.
In any case, this work aims to estimate the influence of the pilotis variable on the formation of the unit value of the average square meter in apartments located in The South Asa, Brasília-DF, through statistical analysis tools available in the TS-SISREG Software.
2. DEVELOPMENT
Considering the eccentricity of the blocks known as JK, located specifically in Superquadras Sul 408, 409, 411, 412 and 413, this study sought to identify an equation of value formation through a linear regression model that encompassed the singularity of the aforementioned building structures, according to samples collected in the real estate market, for this reason the direct comparative method of market data was used. It is worth mentioning that this study is not about evaluating a given and certain property.
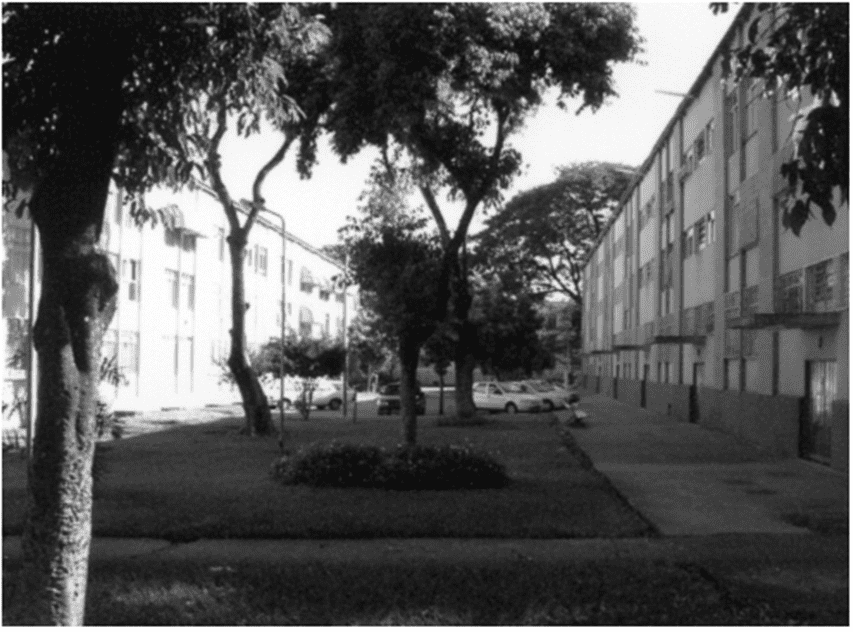
Figure 1 – Buildings without pilotis, known as JK Blocks
2.1 METHODOLOGY
The Comparative Method of Market Data is the most used method for valuation of goods, since it is performed based on the comparison of market data that have attributes similar to those of the evaluated good.
2.1.1 SITUATION AND LOCATION OF SAMPLE DATA
The survey of the market data that make up the sample was carried out in the period from 01/11/2018 to 07/12/2018, delimited as an area of interest the Asa Sul region, since this is the only neighborhood of the Pilot Plan that has buildings without pilotis. Offer information from the Brasilia real estate market available on the Internet was used.
2.1.2 DEFINITION OF VARIABLES
For model construction, four independent value-building variables were identified, which are specified below:
2.1.2.1 DEPENDENT VARIABLE
Unit Value: dependent variable expressed in R$/m², intended to express the formation of the square meter value.
2.1.2.2 QUANTITATIVE INDEPENDENT VARIABLES
Useful Area: numerical variable of quantitative type, expressed in m², designed to investigate the areas of the properties and the influence on the constitution of the property value.
Rooms: numerical variable, quantitative type, expressed in units, intended to express the number of rooms of the property and the influence on the constitution of the value of the property.
2.1.2.3 DICHOTOMOUS INDEPENDENT VARIABLES
Pilotis: isolated dichotomous variable, designed to identify the presence or absence of pilotis in the building. No = 0; Yes=1
Garage: isolated dichotomous variable, designed to identify the existence of garage in the building. No = 0; Yes = 1.
2.1.3 SAMPLE FORMATION
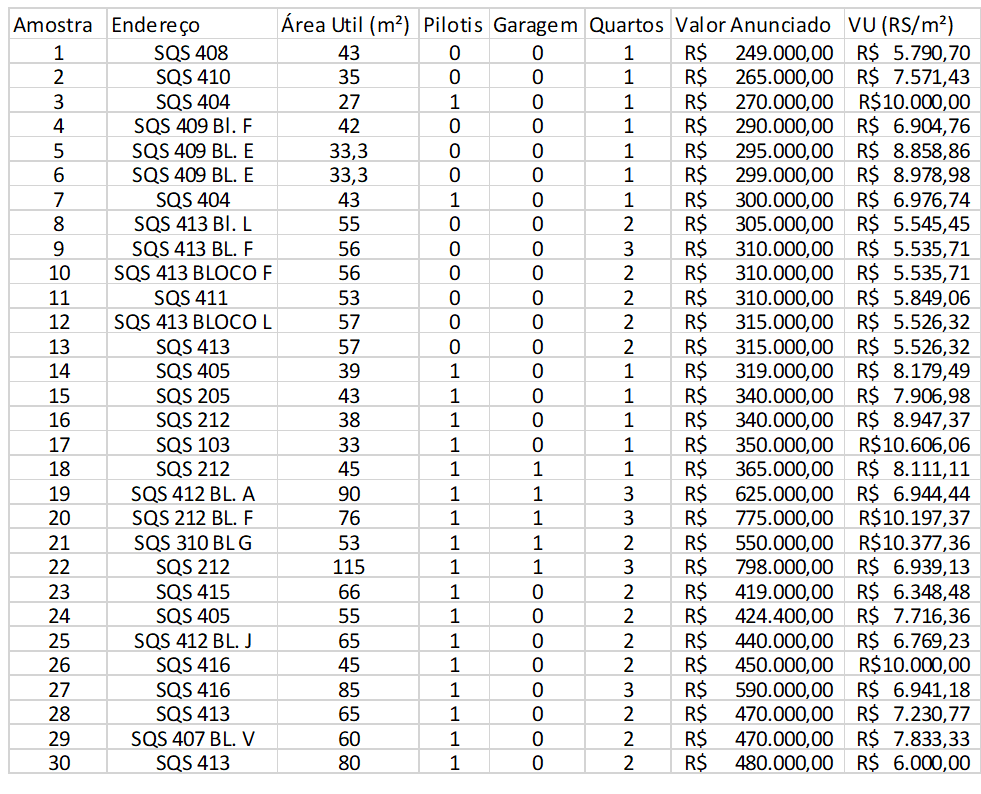
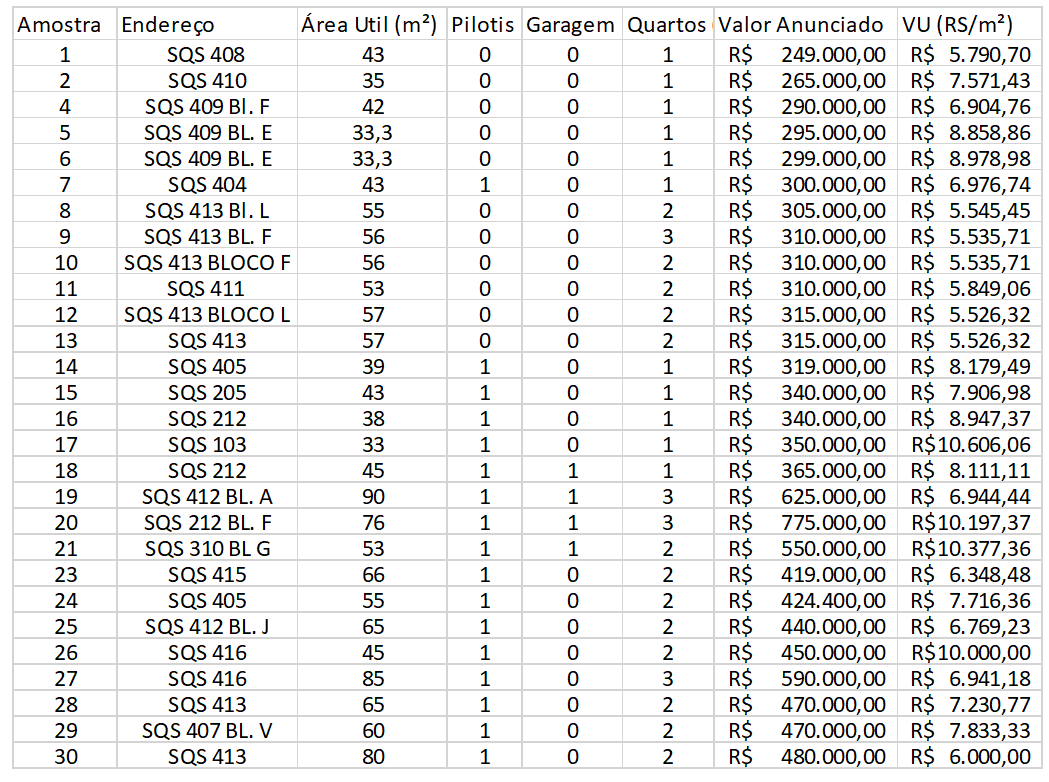
In this stage, 30 data were collected and characterized according to the proposed variables, according to the table below:
Table 1 – Data selected for the sample
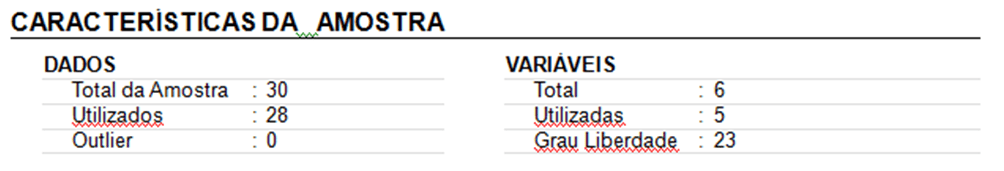
2.1.4 OF SAMPLE CHARACTERIZATION
For the development of the linear regression model, the data were inserted into the TS-SISREG software and the proper statistical inference tests were performed. Considering that two data were classified as influencing points, these were taken with a view to the adequacy of the model. Regarding the variables, all those initially suggested were relevant for the formation of the value.
Table 2 – Data selected for the evaluation model
Below is the table with the data effectively used for the formation of the price formation equation.
Table 3 – Data selected for the evaluation model
To avoid micronumerosity, the minimum number of data actually used (n) in the model must meet the following criteria, with respect to the number of independent variables (k):
n ≥ 3 (k+1)
ni ≥ 5, up to two dichotomous variables or three codes allocated to the same characteristic;
ni ≥ 3, for 3 or more dichotomous variables or four or more codes allocated to the same characteristic where ni is the number of data of the same characteristic, in the case of the use of dichotomous variables or allocated codes, or number of different observed values for each of the quantitative variables. (NBR 14653-2, 2011) It should be noted that for this model there were no micronumbers.
3. RESULTS
Statistical Inference methods allow estimating the unknown characteristics of a population and testing whether certain hypotheses about these unknown characteristics are plausible. (REIS et al., 2015). Once the data were defined, the statistical inference was performed, the results achieved and the model generated with the aid of the TS-Sisreg software are presented below.
VU (R$/m²) = 860.310523 + 399068,631096 x 1/(Floor area) + 2123.409955 x (pilotis) + 1456.252645 x (garage) + -4472.261084 x 1/(rooms)
Presented the function of value formation, it is followed by the discussion regarding the statistical parameters of the model.
3.1 OF THE STATISTICAL PARAMETERS
Table 4 – Statistical parameters of the regression model
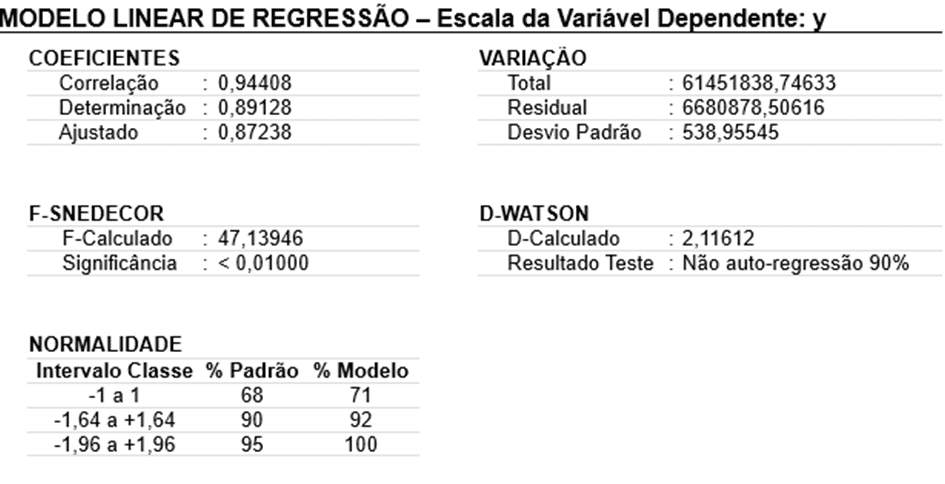
3.1.1 MODEL DETERMINATION COEFFICIENT
The coefficient of determination, which ranges from 0 to 1, indicates how much the model can explain the observed values, so the closer to 1 the value of the Coefficient of Determination, the better the adjustment of the regression line. The coefficient of determination of the model was 0.89128 which expresses that 89.12% of the formation of unit values can be explained by the model.
3.1.2 PARAMETERS OF ANALYSIS OF INDEPENDENT VARIABLES
Table 5 – Parameters of analysis of independent variables
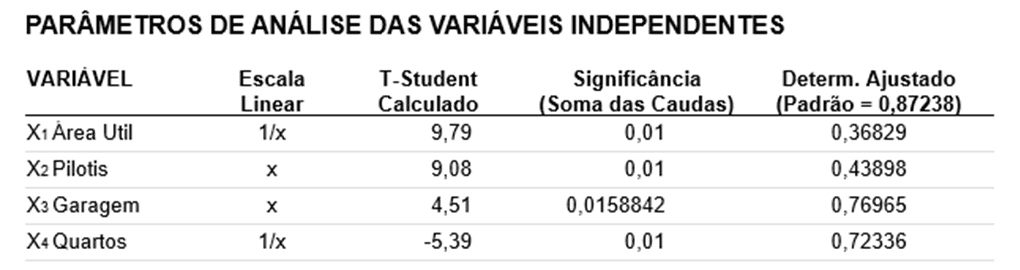
Above are the parameters of analysis of the independent variables, in which the values of t-Student Calculated the Significance and the Adjusted Coefficient of Determination of each of the Variables used in the model are presented.
Student’s t-distribution is the most important of the distributions when one wishes to infer about population means with unknown standard deviations. However, its application deserves credibility only when there is evidence favorable to the normality of the population from which the sample originates. Its use in evaluation engineering is much higher than the normal distribution, since in general the population standard deviation is estimated through the sample data. (DANTAS, 2012, p. 83)
In relation to the behavior of the variables, graphs were generated demonstrating the relationship of independent variables with the dependent variable – VU (R$/m²).
3.1.2.1 USSERVICE AREA
Figure 1 – Parameters of analysis of the Variable Useful Area
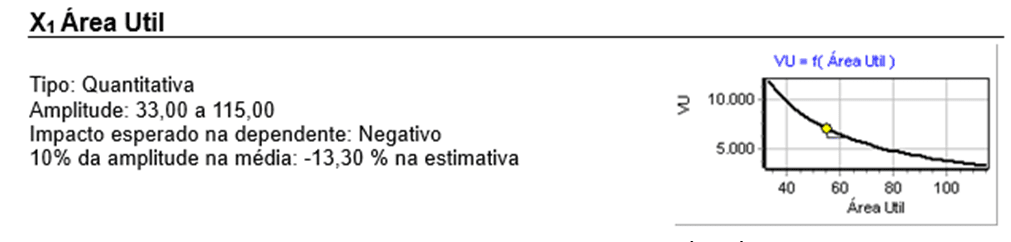
The independent quantitative variable Useful Area has a negative impact on the dependent variable Unit Value, this fact occurs, because the larger the useful area of a property, the smaller the Unit Value (R$/m²) of a property. It should be explained that the samples collected presented amplitude from 33.0 m² to 115.0 m².
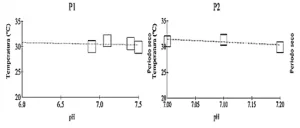
3.1.2.2 PILOTIS
Figure 2 – Pilotis variable analysis parameters
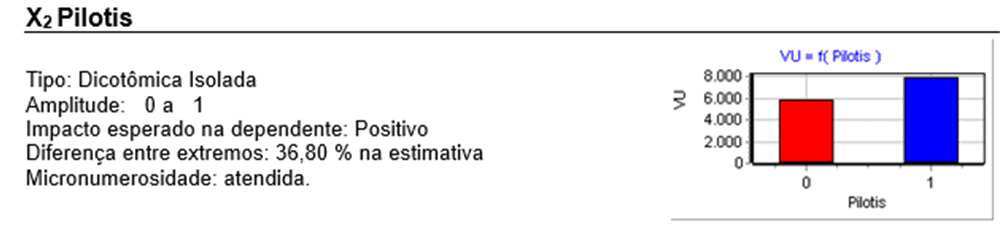
The independent dichotomous variable isolated Pilotis, which is the focus of this study, and the zero value was adopted for the absence of the pilotis and the value one for the presence of the pilotis. It is worth noting here the difference between the extremes that reached 36.8% in the VU estimate.
3.1.2.3 GARAGE
Figure 3 – Pilotis variable analysis parameters
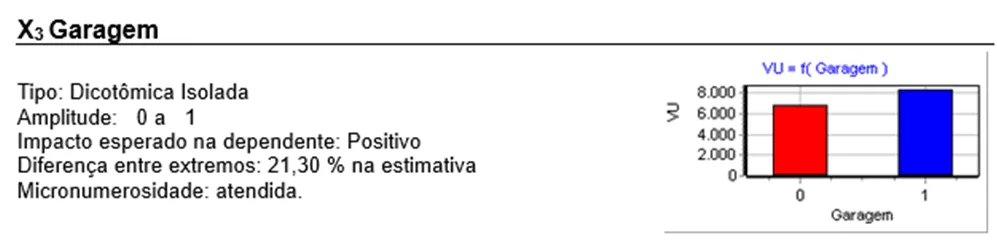
The independent variable dichotomous isolated Garage, being adopted the zero value to represent the buildings without garage and the value one to represent the buildings with garage.
3.1.2.4 BEDROOMS
Figure 3 – Pilotis variable analysis parameters
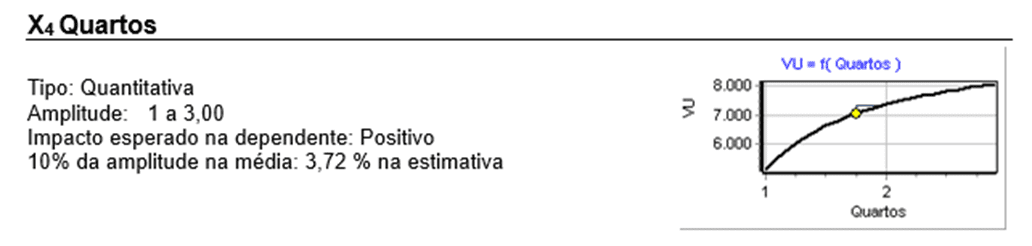
The quantitative independent variable Rooms has a positive impact on the dependent variable Unit Value (R$/m²). It is worth explaining that the samples were sampled with amplitude from 1 to 3.
3.1.3 NORMAL DISTRIBUTION
The importance of the normal distribution is given to the fact that as the sample size grows, regardless of the distribution of the original population, the sample distribution of the means tend to the normal distribution. (DANTAS, 2012) Normal distribution is one of the most commonly used distributions for modeling phenomena.
The normal distribution, in addition to its attractiveness due to its ease of mathematical treatment, has two practical reasons that justify its usefulness. The first says that normal distribution is the most suitable for population models in various situations; and the second refers to the fact that the sample distribution of many multivariate statistics is approximately normal, regardless of the form of the distribution of the original population, due to the effect of the central limit. (FERREIRA, 1996, p. 119)
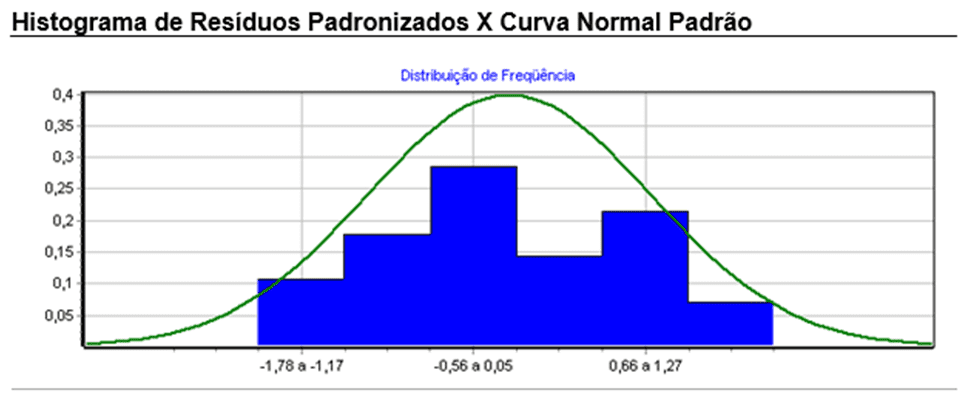
The graph containing the histogram of residues standardized by the standard normal curve was generated. The result presented is similar to the normal curve.
Graph 1 – Standardized residual histogram x standard normal curve
3.1.4 TACK
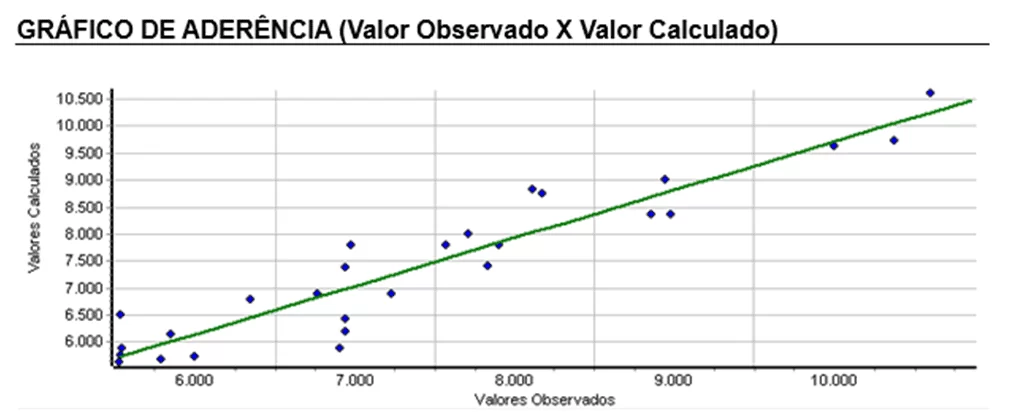
In the grip chart, the closer the points approach the reference line, the better the model fit. In the graph shown below the points have adequate adherence.
Graph 2 – Adherence Chart (observed value x calculated value)
3.1.5 WASTE ANALYSIS
The residuals of the model are randomly presented, as observed in the calculated value graph versus standardized residuals. Thus, it can be concluded that there is no violation of the basic assumptions with regard to homoscedasticity, that is, the points are randomly distributed around the horizontal line that passes at the origin, without any defined pattern, that is, indicating the acceptance of the hypothesis of constant variance for the error, a fundamental condition for the safety of the statistical tests performed.
Graph 3 – Value Distribution (adjusted values vs. standardized residuals)
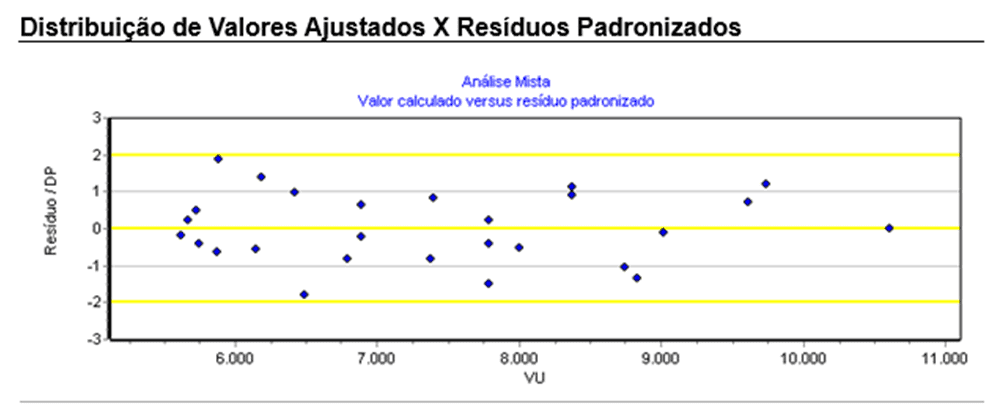
Errors are random variables with constant variance, that is, homocedatic.
3.1.6 ESTIMATE OF VALUES
After presenting the basic premises of the model, which proved acceptable, we chose to create two theoretical evaluation scenarios in order to estimate the impact of the Pilotis variable on the formation of the Unit Value (R$/m²), considering the other fixed variables.
3.1.6.1 FIRST SCENARIO
For the first scenario it was suggested a hypothetical property of 50.0 m², 2 bedrooms and no garage, varying only in relation to the pilotis.
Table 6 – Fashion Values for 80% confidence
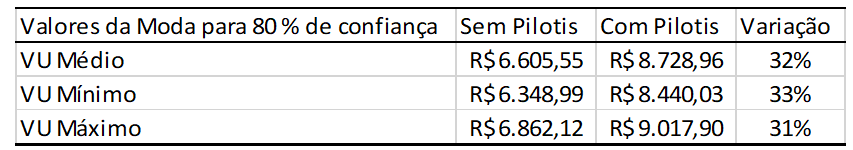
The results obtained show that the apartments present in buildings built on pilotis have an Average Unit Value of R$ 8,728.96, while the apartments built in buildings without pilotis presented an Average Unit Value of R$ 6,605.55, so a positive percentage change of approximately 32% in the Average Unit Value of the apartments located in buildings on pilotis was observed, when compared to the apartments located in JK blocks. The variation identified in this hypothetical scenario is in line with the empirical perception that the absence of pilots in JK blocks acts as a deletery characteristic to value formation.
3.1.6.2 SECOND SCENARIO
For the second scenario it was suggested a hypothetical property of 40.0 m², 1 bedroom and no garage, varying only in relation to the pilotis.
Table 6 – Fashion Values for 80% confidence
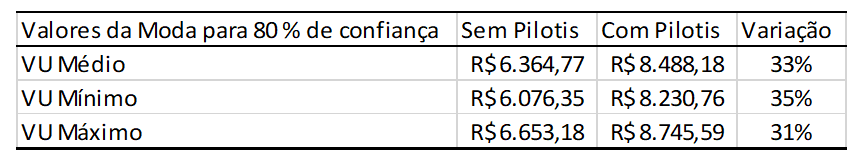
The results achieved do not differ significantly from the first hypothetical scenario. The percentage variation of the Average Unit Value of the apartment in a building with pilotis was approximately 33% higher, compared to the apartment located in a building without pilotis.
It is worth remembering that currently the district legislation provides that in case of total demolition of residential block without pilotis, it is possible to opt for the construction of a new residential block on pilotis.
4. CONCLUSION
The results confirmed what was once an empirical perception, that is, the pilotis variable is relevant in the formation of the unit value of properties located in Asa Sul, Brasília -DF. In addition, it can be confirmed that the absence of pilotis has a deletery influence on the formation of value. Moreover, the other variables initially identified proved relevant in the construction of the model presented.
When applied in two different scenarios, it was observed that the unit value of apartments located in buildings built on pilotis is approximately 32% higher than that of apartments built in JK blocks, without pilotis.
Another relevant point is that the methodology adopted and the software used proved to be adequate for the execution of the study.
The present work has attempted to contribute academically to the area of Evaluation Engineering.
REFERENCES
ABNT, ASSOCIAÇÃO BRASILEIRA DE NORMAS TÉCNICAS. NBR 14653-1 (2001): Avaliação de Bens – Parte 1: Procedimentos Gerais. Rio de Janeiro, 2001.
ABNT, ASSOCIAÇÃO BRASILEIRA DE NORMAS TÉCNICAS. NBR 14653-2 (2001): Avaliação de Bens – Parte 2: Imóveis Urbanos. Rio de Janeiro, 2011.
AMORIM, Cláudia Naves. FLORES, Alice Leite. Edifícios residenciais das superquadras do plano piloto, brasília: aspectos de preservação e conforto ambiental. Maceió, 2005.
ARIOLI, Alessandra T. et al. Arquitetura moderna de Le Corbusier nas habitações populares brasileiras. Belo Horizonte, 2015.
BRAULIO, Silvia Neide. Proposta de uma metodologia para avaliação de imóveis urbanos baseado em métodos estatísticos multivariados. Curitiba, 2005.
DANTAS, Rubens Alves. Engenharia de Avaliações – Uma introdução à metodologia científica. São Paulo, 2012.
FERREIRA, Daniel Furtado. Análise Multivariada. Lavras, 1996.
HOLANDA, Frederico. Na contramão do apartaide (2007). Disponível em http://www.fredericodeholanda.com.br/textos/holanda_2007_na_contramao_do_apartaide.pdf Acesso em 19/12/2018 às 19:00
REIS, Elizabeth. et al. Estatística aplicada 1. Lisboa, 2015.
[1] Specialist in evaluation, audit and engineering expertise – IPOG. Forestry Engineer – Federal University of Viçosa.
Submitted: June, 2020.
Approved: October, 2020.