ORIGINAL ARTICLE
LIMA, Leandro Jose Barbosa[1]. HAMZAGIC, Miroslava[2]. VIAGI, Arcione Ferreira[3]
LIMA, Leandro Jose Barbosa. HAMZAGIC, Miroslava. VIAGI, Arcione Ferreira. The optimization of human and material resources to increase competitivity of oil and gas service companies. Revista Científica Multidisciplinar Núcleo do Conhecimento. Year 07, Ed. 08, Vol. 07, pp. 05-27. August 2022. ISSN:2448-0959, Access link in: https://www.nucleodoconhecimento.com.br/engineering-mechanical-engineering/optimization-of-human, DOI: 10.32749/nucleodoconhecimento.com.br/engineering-mechanical-engineering/optimization-of-human
ABSTRACT
This work has as basis subjects related to resource planning tools such as Sales and Operations Planning (S&OP) and Enterprise Resources Planning (ERP) software and Lean. In this context, the guiding question is: How could human and materias resources be best optimized to deliver an operation with less safet risks, less emissions, less suceptability to market fluctuation condistions, profitability and competivitivty for both operators and service oil and gas companies? The objective of this study was to review existing methods to optimize the use of human and material resources on oil and gas service companies to prevent unavailability of assets or its failures over time. For this, it was adopted as methodology the bibliographic review and an example of a service company create through another article as a study case. As conclusion there is a proposition of best practices and a methodic process that can be directly used on the resource planning of other industries.
Keywords: Optimization, Enterprise Resources planning, Sales and Operations Planning, Oil and Gas, Service Companies.
1. INTRODUCTION
Even though the oil and gas are limited resources, and the world is transitioning to new fuels and ways of energy, it is still expected a high demand of energy and consequently of oil for the next decades to come, and an exponential increase on gas demand (INTERNATIONAL ENERGY AGENCY, 2021).
The oil and gas well exploration operations are complex, expensive and offers great risks, and even though there is science, best practices, lessons learned and mitigation plans to mitigate these, major problems still happens, just like it has happened in the Macondo well, USA, 2010, with the rig deep water horizon (SANTOS et al., 2019). In 2019, the Total Recordable Injury Rate (TRIR) was 0.92 injuries per million worked hours (SOCIETY OF PETROLEUM ENGINEERS, 2020). The reliability of equipment is essential to the well safety and perfect service delivery, so having a proper maintenance program is essential for well safety, as if the operation is done well in the first time, less work hours will be required, so less exposition to the risk (SOCIETY OF PETROLEUM ENGINEERS, 2020).
Given the scenario, the oil and gas exploration is highly dependant on a good and systematic planning, that includes evaluations of similar geology, water depth conditions and same area evaluations. Some costs are fixed, expected or could be statistically estimated, but unexpected variable costs, such as premium freight, extra rig days, equipment unavailability, could significantly impact the well construction schedule through Non-Productive Time (NPT), which will delay the production of the first oil and consequently the Return Over Investment (ROI), what could also generate other risks related to the seasonality of the market, when the delay is so high that production would start only during a crisis period with lower oil and gas prices. Just on rig rental daily costs the amount could be 1 million USD/day (AMORIM JUNIOR; SANTOS and AZEVEDO, 2019). Two other aspects to take into consideration are: by reducing well construction time, there is a consequent reduction on greenhouse gasses emissions, and potential risks for the workers involved on these operations.
The service companies, desiring to sell or rent their products or services and to win the bids, work strongly to demonstrate the availability, reliability and low failure repetition to attract the operators (companies that own the drilling license for a production block), so they don’t end up in the scenario described above – the costs of failures and unreliability are high for both companies (AMORIM JUNIOR; SANTOS and AZEVEDO, 2019), and now on the recent of energy transition discussions, and in commitment with the society, the service provider also wants to show its low contribution to operator´s scope 3 emission – greenhouse gas emission through the supply chain (O’SHEA et al., 2020). If we consider that in average the well drilling emits about 700 tons of CO2e/pad (U.S. ENVIRONMENTAL PROTECTION AGENCY, 2015) and that it takes around 60 days to drill this well (LIESKOVSKY; YAN, 2019), each drilling day would emit 11 tons of CO2e, or 486kCO2e per hour, so each hour of downtime of the rig does not cost only 1MM USD/day, but it also cost 11 tons of CO2e/day.
No matter the nature of the company, but mainly private institutions have its evaluations based on results, long term profits, so in this way there is an extreme interest to be competitive and attract investors, so they must demonstrate their ability to produce product and services that are competitive (GHAZALI and ANUAR, 2017). The management of costs, and consequently the human and materials resources is essential to measure this profitability (SILVA et al., 2010), this means that operators are willing to operate at low cost rates, with ontime well construction to ensure expected ROI. In the other hand, the service companies are willing to ensure cost, price, availability and reliability to attract these operators.
The drilling of a well involves different parties, this work will focus on the Drilling Services provider of Measurement While Drilling – MWD, Logging While Drilling – LWD and Directional tools, these tools are composed by several components, and there is a regular maintenance scheduled given the well drilling conditions and engineering limitations (ARAUJO JUNIOR et al., 2009).
In this context, the guiding question is: How could human and material resources be best optimized to deliver an operation with less safety risks, less emissions, less susceptibility to market fluctuation conditions, profitability and competitiveness for both operators and service oil and gas companies? The objective of this study was to review existing methods to optimize the use of human and material resources on oil and gas service companies to prevent unavailability of assets or its failures over time.
The analysis of this work will be based on “Manutenção Precisa S.A.” (ARAUJO JUNIOR et al., 2009), from a paper that uses fictitious data to demonstrate costing models analysis, and will take some assumptions for illustration purposes of the Planning and Production Control tools.
2. LITERATURE REVIEW
2.1 OIL AND GAS SERVICE COMPANIES CONTEXT
The oil and gas environment is segmented in upstream, midstream and downstream. The upstream is related to all well exploration and construction related activities, midstream is related to oil and gas exportation, transport, to the land, and finally the upstream is connected to the distribution and final supplier commercialization (THOMAS et al., 2001). This work is focused on the upstream, more specifically to the drilling services environment, which does not limit its application in other similar environments.
In the drilling services environment, the normal type of contract is to have the operators’ hiring rigs and drilling services companies to drill the borehole and later hire another company to cement and complete the well, among others. The drilling service companies normally operate on tool rental, meaning that tools are used by service company providers to drill the well on the pre-agreed well trajectory using purchased drill bits, plus rented steering motors or rotary steerable system with Measurement While Drilling, MWD, and in some occasions Logging While Drilling, LWD, technology (THOMAS et al., 2001).
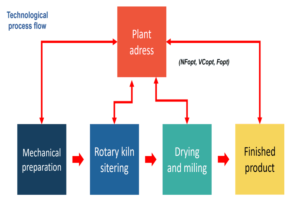
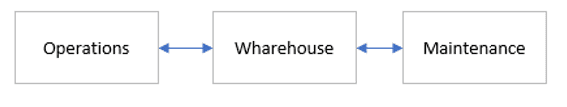
These tools are owned by the drilling service company that in most cases design and manufacture these tools; and these companies design specific maintenance programs, so when these tools return from the rig they are served to be used in a new job – oil and gas well drilling (THOMAS et al., 2001). As shown in the Picture 1, these tools are normally flowing from warehouse to offshore or onshore operation, and after use return to the base for maintenance, so they can be serviced and return to warehouse waiting for a new operation (ARAUJO JUNIOR et al., 2009).
Picture 1. Operational Flow
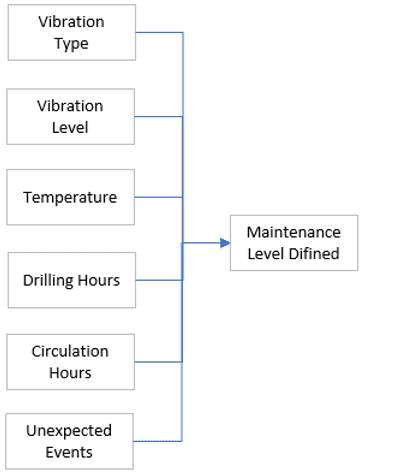
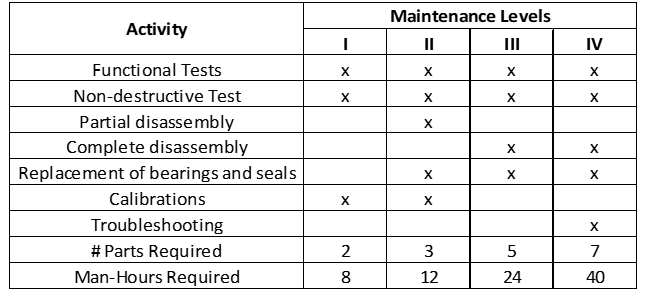
The maintenance levels are not only dependent on the amount of hours used for the drilling, but are also function of fluid circulation hours, temperature, vibration and other dynamic conditions that change from well to well, as reservoirs normally present geological conditions different from one are to another, most typically being a sealing rock, like shale, a permeable rock, where oil and gas are located, such as sandstone or limestone, and generated by other layer of shale on the bottom. This intercalating could cause dysfunction that might affect the drilling equipment triggering the different maintenance level, as shown on Picture 2 (ARAUJO JUNIOR et al., 2009).
Picture 2. Parameters Used to Determine the Level of Maintenance
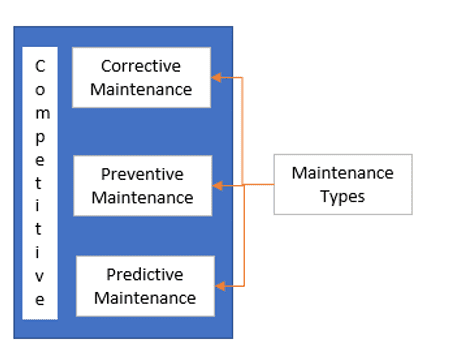
It’s also important to highlight that these maintenances are not only preventive, and some levels of corrective and predictive maintenance are applied on these tools, as part of the same strategy, what it is called competitive maintenance, a combination of all types of maintenance to reach the best economical value from it, as demonstrated on the Picture 3 showing that the selected level of maintenance depends on the benefit for the market, for example, in some cases it might be worth to wait for the failure to happen to replace the component as it is easily available and the impact on the cost of failure or lost production is low, in other words the criticality of the failure is low (PEREIRA, 2010). This imposes different types of planning from the material perspective (PEINADO and GRAEML, 2007).
Picture 3. Overall Representation of Competitive Maintenance
Given the rig costs its normally more economical to have the maintenance on the facilities, and not at rig site where the rig time cost is high and there are limitations on the space for specialized workforce (ARAUJO JUNIOR et al., 2009), so at rig site the only type of maintenance performed is the level ZERO maintenance, where tests and basic inspection is performed, what is one of the principles of TPM – Total Productive Maintenance (PEREIRA, 2010; LOZADA-CEPEDA; LARA-CALLE and BUELE, 2021).
Excluding what is done at rig site, here also referred as in the field, there are basically 4 types of maintenance possible to a tool, the Level 1 that is basically focusing on cleaning, basic inspection and testing, the level 2 that is related to the disassembly of some bigger modules, seals exchange and some calibrations, the level 3 that consists on full disassembly and inspection of all accessible parts, and finally the level 4 that happens when a fault has been identified or high level of maintenance variables have been reached. The table 1 illustrates the components, and for the matter of this paper, some random number of components and manpower impact will be considered to each level, as an example (ARAUJO JUNIOR et al., 2009).
Table 1. Maintenance Levels and Requirements
In the base it is fact of the Planning and Production Control Team (PPC) to review the details from the runs and work with the maintenance and materials team to get ready to receive the tools to the conditions they are required to be refurbished for the next deployment. Part of the responsibility of PPC is to review the Services & Operations Plan (S&OP) and predict on average what will be the requirements on materials and personnel for the maintenance team to perform the job (ARAUJO JUNIOR et al., 2009).
2.2 THE ACCOUNTING AND FINANCE BEHIND IT
There 3 basic types of financial reports that we have to understand, the balance sheet, focusing on what the company own or owe, the P&L, also known as Profit and Lost, based on the day-to-day transactions, accruals and the Cash Flow, that accounts for the money that is coming in and out of the bank (GRIGORAS-ICHIM and MOROSAN-DANILA, 2020).
The transactions related to the maintenance team impact all 3 main reports and is for the drilling services companies one of the main costs to the P&L. Giving the nature of the operation we might have more consumption of material what will impact either the P&L from the perspective of the transaction of taking material from warehouse to the equipment and affecting its estimated cost, and on the balance sheet as you are reducing your inventory (GRIGORAS-ICHIM and MOROSAN-DANILA, 2020).
All materials used on this equipment are imported leading to the need of periodic material review, while very few are purchased locally leading to less cost to the P&L and less impact on cash flow and inventory given that inventory could be on the local supplier and not into company stores (GRIGORAS-ICHIM and MOROSAN-DANILA, 2020; ARAUJO JUNIOR et al., 2009).
Two other important concepts to have in mind are the Capital Expenditures (CAPEX) and Operational Expenditures (OPEX); every day-to-day operation expenditure will impact the OPEX, and all investment in equipment, assets and building or other items that could be capitalize and depreciate over time is related to a CAPEX investment. From the materials management decision, the number of assets to operate will impact the CAPEX plan and might have similar behavior than inventory for the logic explained below (MAMUSHIANE; LYSKO and DLAMINI, 2018).
When a company decides to be very proactive and keep lots of “just in case inventory” ,there are important impacts to be considered such as where the company is investing the money, so in this case, purchasing more material than investing in innovation that could provide better results to investors, and to the balance sheet where most of resources available not as liquid. In some cases, there might be a decision to have extra inventory based on the lead time, that is the time it takes from the order to the moment the materials will be available to the warehouse team.
Building inventory has other impacts like risk of obsolescence, tax (immediate cost when it is imported to a location with more taxes, risk of damage, need of longer periods of cycle counting, use of resources, excessive incoming inspections, etc.). Depending on the standard variation of the demand and on the lead time, more inventories might be required.
2.3 RESOURCE PLANNING AND OPTIMIZATION TECHNIQUES
From the material and human resources prediction perspective, the simplest type of maintenance is the preventive maintenance, where it is easy to model when the material will be needed based on known expected conditions, created dependent type of demands, all other type of maintenance rely on statistics leading to independent demand, what generation standard deviations on the lead time and on the demand itself (PEINADO and GRAEML, 2007).
An important miss-conception about Just in Time, is that its intention is not to have zero stock as a goal, but zero stock as a vision, meaning that the organization goal should be to keep the minimum amount of inventory that would allow customer demands to be fulfilled.
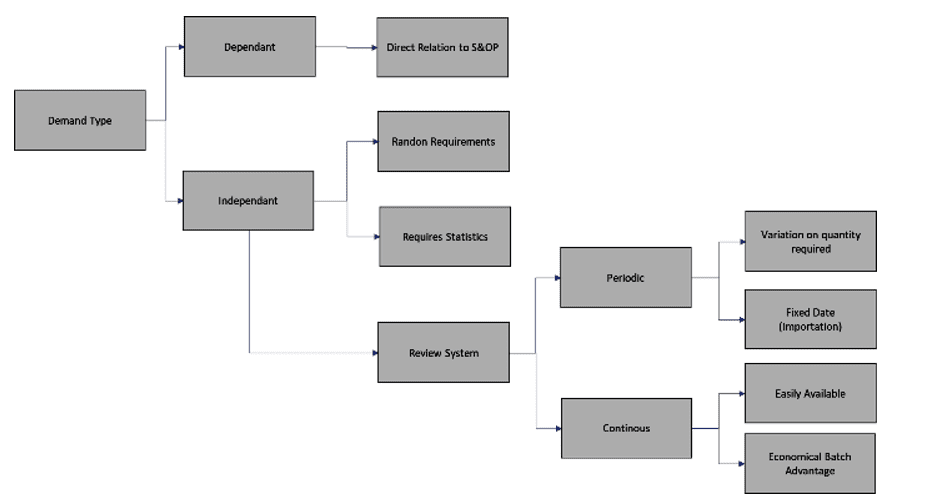
The resources could have a dependent or independent demand based on its characteristics and the type of maintenance. Dependent demand is everything that can be exactly related to the production need, for example the headcount related to the activity being performed, or parts that can be directly tie to the S&OP, and independent demand cannot be determined through a direct relation, as of indirect headcount such as plant accountant or a part that fail in random pattern (PEINADO and GRAEML, 2007).
On top of understanding the type of demand, it is critical to determine the type and frequency of the review that PPC team will do with the materials team when the demand type is considered independent, if that would be a continuous review or periodic review. The continuous review is normally related to material that is easy to produce and available for purchase, where the team works to determine what is the size of the economical batch to be purchased. The periodic review is tie to materials that have orders limited to fixed dates, like in situations where the material needs to be imported, very common on oil and gas service companies, so in this case the focus must be to understand to what level of service it’s intended to reach to answer to customer demands (PEINADO and GRAEML, 2007; ARAUJO JUNIOR et al., 2009). The Picture 4 summarizes what needs to be pre-evaluated in terms of the resource to proceed with the proper planning.
Picture 4. Representation of Demand Types and Requirements
Based on the demand type and review type, the material cost will have different impact to the P&L, the equation below summarize it Peinado and Graeml (2007):
Total cost = ordering cost + maintenance cost + purchase cost
Other decisions like the size of the safety stock, reorder point and when to purchase are mathematical decisions, and are function of cost, lead time, demand, level of service required (capability to attend customer needs) and their respective standard deviations (PEINADO and GRAEML, 2007). The ordering cost could include the cost of time from personnel working on PPC placing the orders, the cost of depreciation of the system used to order the resource, the cost of receiving inspection, number of orders in the period; the maintenance cost could be the cost of the HC working on warehouse, insurance cost, cost of capital immobilized, paid taxes, damages, cycle count costs, system depreciation costs, depreciation of the occupied area and CAPEX invested to store the material; the purchase cost is related to the HC of the procurement team, depreciation of system used, supplier survey costs, audit costs, etc.
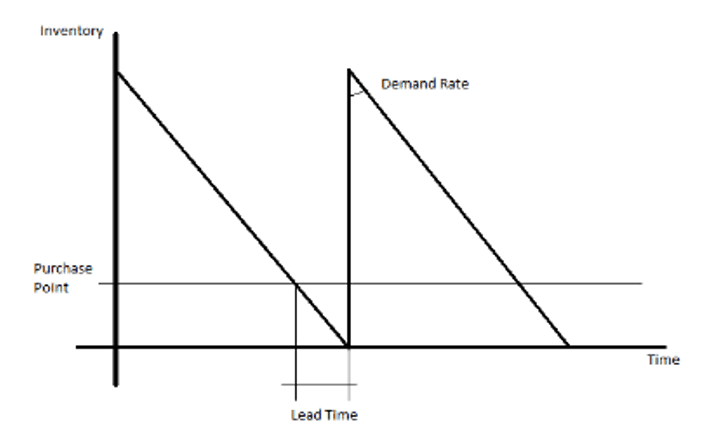
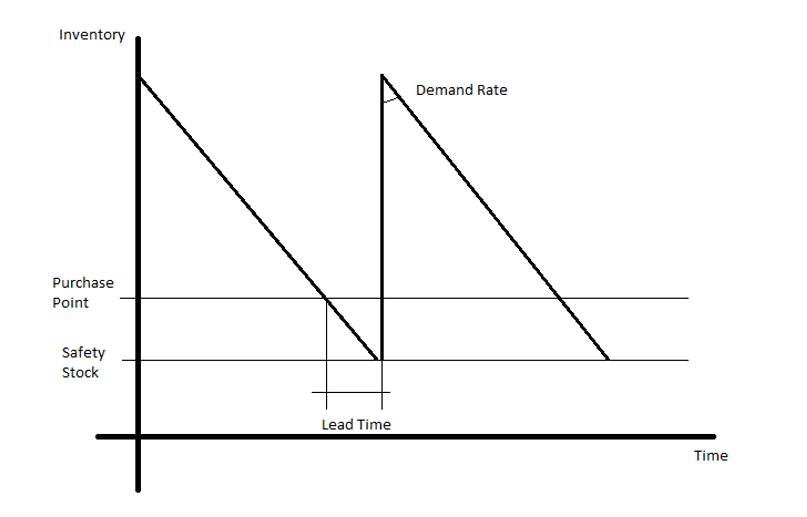
The behavior of the inventory over time follows the explanation on the Picture 5, where the main objective from the materials department is to use the mathematical methods to prevent production shortages. The inventory starts at a certain level and decay at demand rate, until it reaches as purchase point that takes in consideration the lead time to re-supply the material before it gets to zero:
Picture 5. Inventory Behavior Over Time
The math is not always that simple, as the demand is normally a demand average, and by being an average has a standard deviation, same as lead time, that also behaves like an average on the practical day to day, so it also has a standard deviation, so depending on the level of service that it is needed for the customer, more inventories will be needed.
The normal equation that describes that re-supply point is:
PR = d x LT,
Where:
PR = re-supply point, or purchase point, or re-order point,
d = Demand,
LT = Lead Time.
As an example, if an o-ring has a lead time of 3 weeks, and you have a demand of 5 o-ring, then your re-supply point would be when your inventory level reaches 15 units.
Now, the size of the economical batch, or how much to purchase is described by the formula:
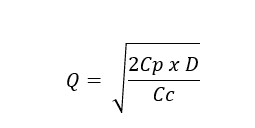
Where:
Q = size of the batch,
Cp = cost of ordering (fixed order cost),
D = demand (yearly),
Cc = inventory maintenance cost (capital cost).
In some operations, given the criticality it is needed to add to the Graph 6 another line, the safety stock, so it gets represented as follows, in these cases the goal is to prevent to get to zero:
Picture 6. Inventory Behavior Over Time, when a Safety Stock is Required
If we take in consideration the safety stock for a continuous review, then our equation changes to:

Where:
PR = re-supply point, or purchase point, or re-order point,
d = Demand,
TR = LT = Lead Time,
ES = Safety Stock.
If it is considered the periodic review the Re-supply Interval (IR) must be added to the re-supply point before multiplying by the demand, so PR = d x (TR+IR) + ES.
And, taking in consideration a variable demand and a constant lead time, the number of standard deviations from a normal function for the demand, and the demand standard deviation, the equation for safety stock is:

Where:
ES = Safety Stock,
Z = Number of Std Deviations,
TR = LT = Lead Time,
=Standard deviation from the demand.
Now, if the demand is constant and the lead time is variable the equation is:
 Where:
ES = Safety Stock,
Z = Number of Std Deviations,
d = Demand,
TR = LT = Lead Time,
=Standard deviation from the Lead Time.
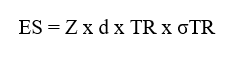
More common situations for the normal oil and gas world the equation the most fits consider the variable demand and the variable lead time, as follow:

ES = Safety Stock,
Z = Number of Std Deviations,
TR = LT = Lead Time,
=Standard deviation from the demand
=Standard deviation from the Lead Time,
d = Demand.
The number of Z can be determined from a normal distribution table, depending on the service level that is required for the customer, for example, for a safety level of 95%, Z would be 1.65.
To start all the material planning process, it is mandatory to understand the demand, and this will come from the S&OP (Sales & Operations Plan), it is not simple and easy to build a S&OP, as many variables may affect it, a key start point on it is to understand the market, so you can project the demand.
2.4 A PRACTICAL APPROACH OF PLANNING FOR AN UPSTREAM OIL AND GAS SERVICE SEGMENT
In drilling services, the demand would come from operating hours from the equipment that will be used, so typically it is required to know the demand hours from each equipment for each period, per Table 2:
Table 2. Expected Operations Hours per Technology
| Equipment | P01 | P02 | P03 | P04 | P05 | P06 | P07 | P08 | P09 |
| LWD | 500 | 100 | 300 | 100 | 400 | 500 | 800 | 600 | 1000 |
| MWD | 1000 | 500 | 400 | 600 | 600 | 500 | 1200 | 800 | 2000 |
| Motor | 300 | 100 | 300 | 500 | 200 | 0 | 500 | 400 | 2000 |
| Rotary Steerable | 700 | 400 | 100 | 100 | 400 | 500 | 700 | 200 | 500 |
Source: author.
Based on the table it is possible to determine how many maintenances will be required for each equipment on each period, so it is possible to convert the operating hours in number of maintenances, and based on that determine how much inventory will be required, and by when, and how many man-hours will be required, some extra important information:
Table 3. Maintenance Parameters per Technology
| Equipment | Man-hours/Maintenance | MTBM* | MTBF** | # Components | ARC*** |
| LWD | 80 | 100 | 1000 | 3 | 7.14 |
| MWD | 60 | 200 | 2000 | 3 | 6.07 |
| Motor | 40 | 200 | 5000 | 3 | 2.25 |
| Rotary Steerable | 50 | 100 | 1000 | 4 | 1.35 |
*MTBM – Mean Time Between Maintenances, **MTBF – Mean Time Between Failures, ***ARC – Average Repair Cost (kUSD). Source: author.
Derived from Tables 2 and 3, the number of maintenances is shown below:
Table 4. Number of Maintenances Derived from Table 2 and MTBM from Table 3
| Equipment | P01 | P02 | P03 | P04 | P05 | P06 | P07 | P08 | P09 |
| LWD | 5 | 1 | 3 | 1 | 4 | 5 | 8 | 6 | 10 |
| MWD | 5 | 3 | 2 | 3 | 3 | 3 | 6 | 4 | 10 |
| Motor | 2 | 1 | 2 | 3 | 1 | 0 | 3 | 2 | 10 |
| Rotary Steerable | 7 | 4 | 1 | 1 | 4 | 5 | 7 | 2 | 5 |
Source: author.
Man-Hours required, would total 8,540, from Table 5, or 950 man-hours monthly.
Table 5. Man-Hours required per Technology based on Number of Maintenances from Table 4 and Man-Hour/Maintenance from Table 3
| Equipment | P01 | P02 | P03 | P04 | P05 | P06 | P07 | P08 | P09 |
| LWD | 400 | 80 | 240 | 80 | 320 | 400 | 640 | 480 | 800 |
| MWD | 300 | 180 | 120 | 180 | 180 | 180 | 360 | 240 | 600 |
| Motor | 80 | 40 | 80 | 120 | 40 | 0 | 120 | 80 | 400 |
| Rotary Steerable | 350 | 200 | 50 | 50 | 200 | 250 | 350 | 100 | 250 |
| Total Man-hrs | 1130 | 500 | 490 | 430 | 740 | 830 | 1470 | 900 | 2050 |
Source: author.
Assuming that workers are effectively working 7 out of the 8 hours of the day, this means 87.5% efficiency, and considering that this person works 176hrs per month, with the 87.5% efficiency, this means 154 working hours per month, so in average 6 workers per month will be required to do this job and based on this scenario extra additional temporary resources should be planned for P09.
Studying the Bill of Material for these tools:
Table 6. Components Used per Technology
| Equipment | Part 1 | Part 2 | Part 3 | Part 4 |
| LWD | o-ring | PCB-A | Mandrel-A | N/A |
| MWD | o-ring | PCB-B | Mandrel-B | N/A |
| Motor | o-ring | Bearing | Elastomer | N/A |
| Rotary Steerable | o-ring | Bearing | Filter | Pump |
Source: author.
If we also add to the equation the failure kit of each one of these:
Table 7. Expected Failure Count based on MTBF from Table 3 and Year Total Hours from Table 2
| Equipment | MTBF | Year Total Hours | Failure Count | Repair Kit PN |
| LWD | 1000 | 4300 | 5 | LL001 |
| MWD | 2000 | 7600 | 4 | LL002 |
| Motor | 5000 | 4300 | 1 | LL003 |
| Rotary Steerable | 1000 | 3600 | 4 | LL004 |
Source: author.
The Table 8 presents a SWOT analysis over the S&OP:
Table 8. SWOT analysis for S&OP
| Opportunities | Threats |
| · When appropriately done can give advantage over competition due to availability;
· Allow timely negotiation with suppliers; · Time for HR to select best candidates for positions that will be open; · Time to plan in case of reductions; · Retention of employees in case of short downturn.
|
· When missing data could generate loss of customers due to unavailability;
· Higher prices in market for emergency purchase with suppliers; · Risk of inexistence of raw material through the supply chain; · Pressure for market share increase; · Pressure for result achievement; · Sudden changes in market conditions; · Risk on unnecessary cash expenditure; · Risk on Low Cash flow. |
| Strengths | Weakness |
| · Integration of company departments;
· Clear visibility on company directions; · Clear visibility on what generates more profit; · Tie expected revenue to activity and to costs; · Allow better planning for completion of internal training/competence. |
· Disputes for resources,
· Might generate top line adjustments, · Requires high knowledge on the technology, · Requires good information from the market, |
Source: author.
The S&OP is a key factor to achieve a good inventory and personnel plan, so based on the S&OP provided to the “Precisa S.A”, from sales department, the demand is the following:
Table 9. Demand of Parts per Month based on parts from Tables 6 and 7 and maintenance count from Table 4
| Parts | Part Cost (kUSD) | Lead Time
(months) |
P01 | P02 | P03 | P04 | P05 | P06 | P07 | P08 | P09 |
| O-ring | 0.01 | 2 | 19 | 9 | 8 | 8 | 12 | 13 | 24 | 14 | 35 |
| Bearing | 0.20 | 3 | 9 | 5 | 3 | 4 | 5 | 5 | 10 | 4 | 15 |
| PCB-A | 1.05 | 6 | 5 | 1 | 3 | 1 | 4 | 5 | 8 | 6 | 10 |
| PCB-B | 1.00 | 8 | 5 | 3 | 2 | 3 | 3 | 3 | 6 | 4 | 10 |
| Mandrel-A | 6.00 | 10 | 5 | 1 | 3 | 1 | 4 | 5 | 8 | 6 | 10 |
| Mandrel-B | 5.00 | 9 | 5 | 3 | 2 | 3 | 3 | 3 | 6 | 4 | 10 |
| Elastomer | 2.00 | 6 | 2 | 1 | 2 | 3 | 1 | 0 | 3 | 2 | 10 |
| Filter | 0.05 | 2 | 7 | 4 | 1 | 1 | 4 | 5 | 7 | 2 | 5 |
| Pump | 0.05 | 2 | 7 | 4 | 1 | 1 | 4 | 5 | 7 | 2 | 5 |
| LL001 | 2.50 | 10 | 0 | 0 | 0 | 1 | 0 | 1 | 0 | 0 | 1 |
| LL002 | 5.00 | 8 | 0 | 0 | 1 | 0 | 0 | 1 | 0 | 1 | 1 |
| LL003 | 7.50 | 9 | 0 | 0 | 0 | 0 | 0 | 0 | 0 | 0 | 1 |
| LL004 | 10.00 | 7 | 0 | 1 | 0 | 0 | 0 | 1 | 0 | 0 | 1 |
Source: author.
The variation on demand is not the only one for the complex cases experienced on real-life examples, but lead-time is also another information that might change over time, for this example, let’s consider the random numbers on Table 10, in months.
Table 10. Lead-time of parts over the 9 months of the operation
| Parts | P01 | P02 | P03 | P04 | P05 | P06 | P07 | P08 | P09 |
| O-ring | 1 | 1 | 1 | 1 | 1 | 1 | 2 | 1 | 1 |
| Bearing | 3 | 2 | 2 | 3 | 2 | 2 | 4 | 3 | 2 |
| PCB-A | 7 | 5 | 5 | 6 | 6 | 6 | 8 | 6 | 5 |
| PCB-B | 10 | 6 | 6 | 8 | 8 | 7 | 12 | 8 | 6 |
| Mandrel-A | 12 | 10 | 10 | 6 | 6 | 10 | 14 | 10 | 8 |
| Mandrel-B | 11 | 9 | 9 | 6 | 6 | 9 | 12 | 9 | 6 |
| Elastomer | 6 | 5 | 5 | 4 | 4 | 5 | 8 | 7 | 6 |
| Filter | 1 | 1 | 1 | 1 | 1 | 1 | 2 | 1 | 1 |
| Pump | 1 | 1 | 1 | 1 | 1 | 1 | 2 | 1 | 1 |
| LL001 | 12 | 10 | 10 | 6 | 6 | 10 | 14 | 10 | 8 |
| LL002 | 10 | 8 | 8 | 4 | 4 | 8 | 12 | 8 | 6 |
| LL003 | 11 | 9 | 9 | 5 | 5 | 9 | 13 | 9 | 7 |
| LL004 | 9 | 7 | 7 | 3 | 3 | 7 | 11 | 7 | 5 |
Source: author.
The Inventory maintenance cost on this example assumes a capital cost of 0.5% over the cost of total safety stock only, but models could include other capital costs immobilized, and the order cost is related to the cost of the headcount working on warehouse, inventory inspection, purchase and planning, divided by the total amount of orders, here 681 orders/year for a headcount of 4 people with a total fix headcount cost of 200kUSD/year, leading to 0.29kUSD/order.
Applying the concepts of inventory management, considering here all parts imported, in periodic review, and with a service level required of 99%, meaning Z=2.36, the Safety Stock, Size of Economical ordering batch and re-ordering point are as demonstrated on Table 11:
Table 11. Summary table with results of implementation of proposed methodology
| Parts | Lead Time
(months) |
Std Dev (LT – months) | Avg Demand | Std Dev (d) | Order Cost (kUSD) | Inventory Maintenance Cost (kUSD) |
Safety Stock | Size of Economical Batch | Re-order Point |
| O-ring | 2 | 0.4 | 16 | 8.9 | 0.29 | 0.017 | 33 | 81.6 | 65 |
| Bearing | 3 | 0.8 | 7 | 3.9 | 0.29 | 0.207 | 21 | 15.3 | 42 |
| PCB-A | 6 | 1 | 5 | 3.0 | 0.29 | 1.099 | 21 | 5.6 | 51 |
| PCB-B | 8 | 2.1 | 5 | 2.4 | 0.29 | 1.484 | 30 | 4.8 | 70 |
| Mandrel-A | 10 | 2.7 | 5 | 3.0 | 0.29 | 11.670 | 39 | 1.7 | 89 |
| Mandrel-B | 9 | 2.2 | 5 | 2.4 | 0.29 | 7.805 | 31 | 2.1 | 76 |
| Elastomer | 6 | 1.4 | 3 | 2.9 | 0.29 | 1.955 | 20 | 3.3 | 38 |
| Filter | 2 | 0.4 | 4 | 2.3 | 0.29 | 0.021 | 9 | 36.1 | 17 |
| Pump | 2 | 0.4 | 4 | 2.3 | 0.29 | 0.021 | 9 | 36.1 | 17 |
| LL001 | 10 | 2.7 | 1 | 0.5 | 0.29 | 0.923 | 7 | 2.7 | 17 |
| LL002 | 8 | 2.7 | 1 | 0.5 | 0.29 | 1.820 | 7 | 2.0 | 15 |
| LL003 | 9 | 2.7 | 1 | 0.3 | 0.29 | 2.548 | 7 | 1.7 | 16 |
| LL004 | 7 | 2.7 | 1 | 0.5 | 0.29 | 3.548 | 7 | 1.4 | 14 |
Source: author.
Understanding the demand type and the type of review system to be used, if independent, are the second most important task to be accomplished, after S&OP. The impact of inaccurate amount of inventory or personnel to the business, independently to the short-term impact to cash or P&L have the possibility to generate late unexpected costs, loss of revenue or loss of customers.
Data, math and a good S&OP are the proper way to plan for a successful materials and personnel planning for any given activity, especially for those with high service level requirements like the oil and gas industry where exposition of people to risk or failures are at stake. Once the level of service required is understood and all data is available, math comes into place to determine when to order and how much to order to meet the customer expectations and cost expectations to be successful in business.
The time invested on this initial task and to ensure the whole supply chain is aligned, is key, the focus cannot be only on the first level S&OP, or the second level material plan, but in the entire supply chain, which includes the number of suppliers, backup suppliers, assets planning, and raw material required to build the components needed for the outsourced material.
3. FINAL CONSIDERATIONS
No matter the type of business a good planning is key for resource optimization, in some business, like the oil and gas upstream service environment, other factors like the high costs, up to 1 million USD per day, and the risk of safety, emissions, extra exposure to risks, make it even more critical for it. The availability of resources is also key for the competitiveness of the business as customers might define their needs in a very seasonable environment, so suppliers with material available to provide the service could leverage their position in the market.
In this context, this article aimed to answer: How could human and material resources be best optimized to deliver an operation with less safety risks, less emissions, less susceptibility to market fluctuation conditions, profitability and competitiveness for both operators and service oil and gas companies? being possible to verify that to best optimize the resource (assets, inventory, and Human Resources) its first important to understand the demand, have a clear and precise S&OP, with a known Standard Deviation, all other decisions will be made as function of that and on the nature of the resource, so the type of demand, dependent or independent, and the type of review, continuous or periodic can be determined.
The usage of the concept just in time (minimum stock to keep the process running) cannot be mixed with absolute zero inventory or resources. Just in time means that material will be available on the required moment to answer the operations demand. Comparing different business environments (geographic, type of business, etc) for KPI comparison might be dangerous when looking at %of inventory over revenue, as each region, country or area might have its particularities. To make such type of comparison it is important to fully understand and create the appropriated weight factors.
Building the S&OP is not a simple function and might include a series of variables as oil and gas price in the market, types of the wells, new discoveries in the areas, risks and changes in the drilling environment. The numbers on the planning are mathematical therefore to achieve consistently the expected results the plan must be followed and frequently updated based on changes on S&OP, so it is not a onetime exercise, neither a one person exercise, it is constant and owned by the entire team.
Another important aspect on planning is the communication and diversity with the suppliers, as the plan is built it is critical to have the right number of suppliers, so the risk of any miss on delivered is controlled, and in some cases, as the oil and gas business is very volatile it is important to have contracts with fixed minimum purchases in order to prevent critical suppliers to go to bankruptcy – the supplier must be part of the processes and a constant assessment will support the business to win in the market place.
BIBLIOGRAPHY
AMORIM JUNIOR, D. S.; SANTOS, O. L. A.; AZEVEDO, R. C. de. A statistical solution for cost estimation in oil well drilling. Petroleum Sciences, p. 675-682, 2019. Available in: https://doi.org/10.1590/0370-44672018720183. Accessed on: August 11, 2022.
ARAUJO JUNIOR, A. H. de. et al. Modelo para Cálculo de Custos de Manutenção de Ferramentas de Perfuração de Poços de Petróleo. Rev. Cont. e Controladoria, p. 102-117, 2009. Available in: https://www.researchgate.net/publication/273169887_MODELO_PARA_CALCULO_DE_CUSTOS_DE_MANUTENCAO_DE_FERRAMENTAS_DE_PERFURACAO_DE_POCOS_DE_PETROLEO. Access in: August 11, 2022.
GHAZALI, M. R. MD.; ANUAR, H. S. Value Management: Implementation of Asset Life Cycle in one of Oil and Gas Service Company. International Journal of Advanced Engineering Research and Science, p. 67-72, 2017. Available in: https://ijaers.com/detail/value-management-implementation-of-asset-life-cycle-in-one-of-oil-and-gas-service-company/. Accessed on: August 11, 2022
GRIGORAS-ICHIM, C. E.; MOROSAN-DANILA, L. Short Incursion on Annual Financial Reports Versus Interim Financial Reports. ECOFORUM, p. 1-6, 2020. Available in: https://www.researchgate.net/publication/342216562_SHORT_INCURSION_ON_ANNUAL_FINANCIAL_REPORTS_VERSUS_INTERIM_FINANCIAL_REPORTS. Access in: August 11, 2022.
INTERNATIONAL ENERGY AGENCY. Net Zero by 2050. Paris, 2021. Available in: https://iea.blob.core.windows.net/assets/deebef5d-0c34-4539-9d0c-10b13d840027/NetZeroby2050-ARoadmapfortheGlobalEnergySector_CORR.pdf. Access in: August 11, 2022.
LOZADA-CEPEDA, J. A.; LARA-CALLE, R.; BUELE, J. Maintenance Plan Based on TPM for Turbine Recovery Machinery. Journal of Physics: Conference Series, p. 1-12, 2021. Available in: https://iopscience.iop.org/article/10.1088/1742-6596/1878/1/012034. Accessed on: August 11, 2022
LIESKOVSKY, J.; YAN, R. Time between drilling and first production has little effect on oil well production. U.S. Energy information administration, 10 September 2019. Available in: https://www.eia.gov/todayinenergy/detail.php?id=41253. Accessed on: August 11, 2022.
MAMUSHIANE, L.; LYSKO, A. A.; DLAMINI, S. SDN-enabled Infrastructure Sharing in Emerging Markets: CapEx/OpEx Savings Overview and Quantification. IST-Africa 2018 Conference Proceedings, p. 1-10, 2018. Available in: https://www.researchgate.net/publication/329311200_SDN-Enabled_Infrastructure_Sharing_in_Emerging_Markets_CapExOpEx_Savings_Overview_and_Quantification. Accessed on: August 11, 2022
MUNIEN, I.; TELUKDARIE, A. COVID-19 supply chain resilience modelling for the dairy industry. International Conference on Industry 4.0 and Smart Manufacturing, p. 591-599, 2021.
O’SHEA, R. et al. Using biogas to reduce natural gas consumption and greenhouse gas emissions at a large distillery. Applied Energy, v. 279, p. 1-20, 2020. Available in: https://doi.org/10.1016/j.apenergy.2020.115812. Accessed on: August 11, 2022
PEINADO, J.; GRAEML, A. R. Administração da Produção (Operações Industriais e de Serviços). Curitiba: UnicenP, 2007.
PEREIRA, M. J. Práticas de Manutenção. [S.l.]: Ciência Moderna, 2010.
PEREIRA, V. Falta de chips afeta o mundo todo -e Brasil importa 90% do que consome. CNN, 9 May 2021. Available in: https://www.cnnbrasil.com.br/business/falta-de-chips-afeta-o-mundo-todo-e-brasil-importa-90-do-que-consome/. Accessed on: August 11, 2022.
SANTOS, J. R. et al. Análise de integridade de poços de petróleo: avanços em termos de confiabilidade e risco. Encontro Nacional de Construção de Poços de Petróleo e Gás, p. 1-8, 2019. Available in: https://www.researchgate.net/publication/338123589_Analise_da_integridade_de_pocos_de_petroleo_avancos_em_termos_de_confiabilidade_e_risco. Accessed on: August 11, 2022.
SILVA, J. O. et al. Gestão estratégica de custos de produção do barril petróleo. Revista Electrónica de Ciências da Terra, p. 1-4, 2010.
SOCIETY OF PETROLEUM ENGINEERS. IOGP Reports Fewer Fatalities and Injuries in 2019. Journal of Petroleum Technology, 19 October 2020. Available in: https://jpt.spe.org/industry-sees-fewer-fatalities-and-injuries-2019. Accessed on: August 11, 2022.
THOMAS, J. E. et al. Fundamentos de Engenharia de Petróleo. Rio de Janeiro: Interciência, 2001.
U.S. ENVIRONMENTAL PROTECTION AGENCY. Greenhouse Gas Emissions Reporting From The Petroleum And Natural Gas Industry. Background Technical Support Document. U.S. Environmental Protection Agency, May 2015. Available in: https://www.epa.gov/sites/default/files/2015-05/documents/subpart-w_tsd.pdf. Accessed on: August 11, 2022.
[1] Master in Mechanical Engineering from the University of Taubaté (UNITAU), Graduated in Petroleum Engineering from Universidade Estácio de Sá (UNESA), and Graduated in Mechanical Technology with emphasis in Industrial Automation from CEFET/RJ, MBA in Business Management from Fundação Getúlio Vargas ( FGV), MBA in Project Management from CEFET/RJ Support Foundation, Specialist in Occupational Safety Engineering from Universidade Candido Mendes (UCAM), Specialist in Petroleum Engineering from Universidade Estácio de Sá (UNESA) and certified Radioprotection Supervisor by CNEN. ORCID: 0000-0002-6647-3914.
[2] Graduated in Architecture and Urbanism from the University of Taubaté, UNITAU, with a postgraduate degree in Marketing Management and Occupational Safety Engineering from the Polytechnic School of Pernambuco. Master in Regional Development Management from UNITAU and PhD in Production Engineering from Escola Politécnica da USP. ORCID: 0000-0001-8082-5763.
[3] Advisor. post-doctorate in Production Management (Post-doctoral internship program abroad -CAPES) carried out at the University of Padua, Italy, doctorate in Aeronautical and Mechanical Engineering from Instituto Tecnológico de Aeronáutica, master’s degree in Communication and Market from Faculdade Cásper Líbero and graduation in Mechanical Engineering from the University of Taubaté. Lato Sensu postgraduate degree in Production Management and Industrial Operations at FGV and Financial Management at UNITAU / INPG. ORCID: 0000-0002-0248-3689.
Enviado: Julho, 2021.
Aprovado: Agosto, 2022.