ORIGINAL ARTICLE
NASCIMENTO, Mario Brasil do [1], MEDEIROS, Sabrina Evangelista [2]
NASCIMENTO, Mario Brasil do. MEDEIROS, Sabrina Evangelista. Defragilization of fragile states: evaluation through a logit regression analysis. Revista Científica Multidisciplinar Núcleo do Conhecimento. Year 07, Ed. 10, Vol. 09, pp. 80-110. October 2022. ISSN:2448-0959, Access link in: https://www.nucleodoconhecimento.com.br/social-sciences/regression-analysis, DOI: 10.32749/nucleodoconhecimento.com.br/social-sciences/regression-analysis
ABSTRACT
The studies about fragile states in the international relations begins around the 1990s, and the issue remains active. According to the World Bank, in 2016, 1.8 billion people lived in fragile states. The projection shows that, in 2050, almost 10% of the global population will live in fragile contexts. Poverty, famine, child mortality, and violence denote some characteristics of state’ fragility. Many fragile states have been sanctuaries for terrorist groups, threatening global security. There are several indications of causes for fragility in the states, however, there is no universal consensus on this. International organizations, such as the Organization for Economic Co-operation and Development (OECD), find a way to tackle the fragility of states. The problem is: what are the significant variables to justify the defragilization of fragile states, once statistics show that, while one group of states in the world remains fragile or even deteriorated, another group is getting better gradually? The goal of this article is to present the results of research and the outcomes of logit regression analysis, of a group of states, from 2007-2016., which got defragilization. The analysis took into consideration 1,473 relevant observations involving 13 supposed explanatory variables. Some independent variables, such as international aid or investments on education, would appear to be significant, however, they were not. Conversely, the results were consistent with the improvement of state governance and reduction of infant mortality. The study opens an avenue for new researches to defragilization processes.
Keywords: Fragility, Fragile states, Defragilization, Governance, Child mortality.
1. INTRODUCTION
In the 1990s, it started the study of fragile states within International Relations. Initially, the study encompassed the so-called quasi-states, which presented weak governance, feeble authority and questionable sovereignty (JACKSON, 1990). The subject evolved to failed states, characterized by unstable policy, very frail self-government, and internal conflicts (Helman e Ratner, 1992). Zartman (1995) focused his studies on the collapsed states that would require a reconstruction of the institution “state” due to its critical situation. In 2000s, the fragility of states increased in significance due to the correlation between fragility and threats to international security.
In 2016, 1.8 billion of the global population, which corresponds to 24% of the total population in Earth, lived in fragile states (OECD, 2018) The trend projection shows that in 2030, there will be 7.08% of the world population in extremely fragility contexts, and in 2050, they will be 9.10%. In 2019, around 500 million people in extreme poverty were concentrated in fragile states and the trend for 2030 points out that more than 80% of people in extreme poverty will live in fragile states (p.6).
In 2016, the five states most impacted by terrorism were fragile states; and nine fragile countries, among fifteen, were involved in conflicts (p.7). Those matters justify the importance of this subject.
On the other hand, there is a group of fragile states improving over time. The problem is what there have been the causes of defragilization of states.
Some scholars have already researched the causes of fragility, such as trade openness or democracy, but there is no consensual answer regarding the roots of states’ fragility. Supposedly, engagements addressing causes of fragility should provoke defragilization processes. Therefore, the purpose of this article is to present the results of research of defragilization of a sample of fragile states, carried out by a logit regression, confirmed by linear regression, using the model of apparently unrelated regressions.
2. METHOD
The study design took six steps. First, selection of the universe of fragile states. Second, review of the literature in order to identify possible independent variables to explain the defragilization. Third, collection of data regarding each variable identified. Fourth, application of logit regression. Fifth, application of linear regression, using the model of apparently unrelated regressions to check the result. Finally, there was the analysis of the results.
The identification of states, which showed a defragilization process through the period of 2007 to 2016, among data of 177 states, observed three criteria. First, the sum of the fragile state index (FSI), from 2007 to 2017, must be smaller than the result of FSI in 2007 times 10. Posteriorly, the FSI in 2016 must be smaller than FSI in 2007.
![]() Equations 1 and 2 – Criterion for sample selection
Equations 1 and 2 – Criterion for sample selection
The procedure above resulted in a sample of 82 states for evaluation. Finally, the verification of the available data for those states resulted in 1,775 valid lines of observation to proceed with the statistical analysis.
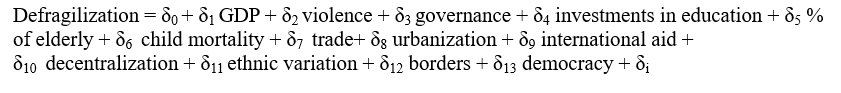
The finding of explanatory variables to justify the defragilization of states began with the identification of causes of fragility. The literature review pointed out the following leading causes: aspects:
Figure 1 – Graphic of most cited causes in literature review of fragile states
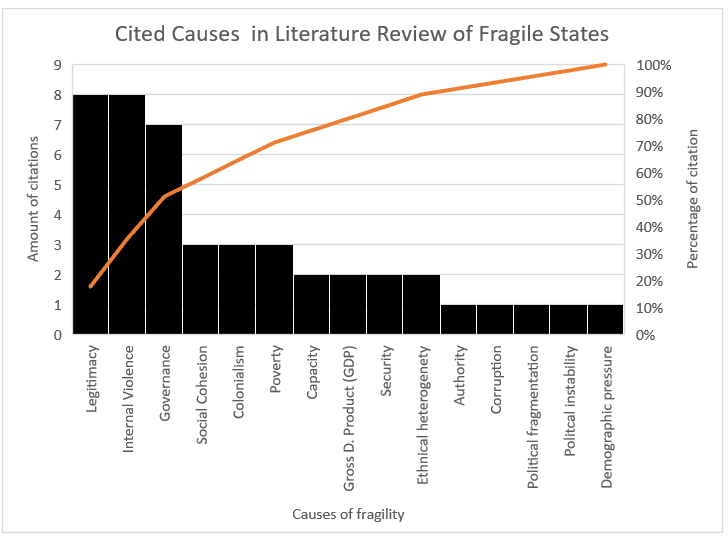
There are distincts perceptions of causes for fragility in the states. The State Failure Task Force Report: Phase III Findings suggested that ethnic composition is a driver of fragility of state (GOLDSTONE et al., 2000). The change in the structure of the population’s age within a state, from young to elderly, increases of pressure on basic services and infrastructure (PSN, 2012), which can be a cause of fragility. The matter of violence in fragile states reduces life expectancy by 12 years, in average (CARVALHO, 2006). Esty el al (1999) asserted that the combination of more urbanization e less gross domestic product (GDP) increased the risk of states’ fail. Nguendi (2012) asserted that, in the case of Africa, the artificial interstates limits have been the largest source of conflict and instability. Tsualen (2016) declared that the type of colonization and the duration of colonial control caused the fragility of states. According to the Organization for Economic Co-operation and Development, the lack of legitimacy is one of the main factors for a state’ fragility, as well the OECD highlights the interdependence between capacity and legitimacy (OECD, 2010). Marc et al. (2013) highlighted that fragility of states is not a problem of capacity, but encompassed social cohesion. The G7+, international intergovernmental organization formed for the purpose of representing fragile states, correlated reduction of fragility to actions on security, justice, work, good management and delivery of services to society (Jütersonke e KOBAYASHI, 2015). Brinkerhoff and Johnson (2008) affirmed that fragile states traditionally have incapable governments to provide basic services, security and economic opportunities, moreover, Brinkerhoff suggested that the decentralization of the states’ government would increase efficiency, equity and better governance. Further, Carment et al. (2008) proposed the determinants of state fragility in 2008 through the following model:

Source: Carment e al 2008 Determinants of State Fragility and Implications for Aid Allocation
The multiplicity of concepts of fragility of states, as well as distinct perceptions of causes of fragility, suggests that it is a multicausal problem with tough consequences to allocation of international aid (BERTOCCHI e GUERZONI, 2010). Based on the above causal variables of fragility, the proposed initial evaluation of defragilization – the process of reduction of fragility over time, was on the following model:
 Equation 4 – Initial equation for logit regression
Source: author itself
The research occurred based on fragile states’ data collection through available databases on the World Wide Web, with a predominance of those located in the World Bank, and the Fund for Peace.
Table 1 – Initial proposal of explanatory variables for defragilization of states
| VariABLE | SOURCE | ||
| GROSS DOMESTIC PRODUCT (GDP) | Definition
GDP per capita based on purchasing power parity (PPP). PPP GDP is gross domestic product converted to international dollars using purchasing power parity rates. An international dollar has the same purchasing power over GDP as the U.S. dollar has in the United States. GDP at purchaser’s prices is the sum of gross value added by all resident producers in the economy plus any product taxes and minus any subsidies not included in the value of the products. It is calculated without making deductions for depreciation of fabricated assets or for depletion and degradation of natural resources. Data are in current international dollars based on the 2011 ICP round (World Bank 2018).
Excel Table NY.GDP.PCAP.PP.CD https://data.worldbank.org/indicator/NY.GDP.PCAP.PP.CD?view=chart |
||
| VIOLENCE
(VIO) (intencional homicides per 100,000 people |
Definition
Intentional homicides are estimates of unlawful homicides purposely inflicted as a result of domestic disputes, interpersonal violence, violent conflicts over land resources, inter-gang violence over turf or control, and predatory violence and killing by armed groups. Intentional homicide does not include all intentional killing; the difference is usually in the organization of the killing. Individuals or small groups usually commit homicide, whereas killing in armed conflict is usually committed by fairly cohesive groups of up to several hundred members and is thus usually excluded (World Bank 2018)
Excel Table VC.IHR.PSRC.P5: https://data.worldbank.org/indicator/VC.IHR.PSRC.P5?view=chart |
||
| GOVERNANCE
(GOV) |
Definition
Reflects perceptions of the quality of public services, the quality of the civil service and the degree of its independence from political pressures, the quality of policy formulation and implementation, and the credibility of the government’s commitment to such policies. Daniel Kaufmann, Aart Kraay and Massimo Mastruzzi (2010).
Excel Table Government Effectiveness: http://info.worldbank.org/governance/wgi/index.aspx#home |
||
| INVESTMENTS IN EDUCATION (INVEDU) | Definition
General government expenditure on education (current, capital, and transfers) is expressed as a percentage of total general government expenditure on all sectors (including health, education, social services, etc.). It includes expenditure funded by transfers from international sources to government. General government usually refers to local, regional and central governments. (World Bank 2018).
Excel Table SE.XPD.TOTL.GB.ZS: https://data.worldbank.org/indicator/SE.XPD.TOTL.GB.ZS?view=chart |
||
| PERCENTAGE OF ELDERLY (ELD) | Definition:
Population ages 65 and above as a percentage of the total population. Population is based on the de facto definition of population, which counts all residents regardless of legal status or citizenship. (World Bank 2018).
Excel Table SP.POP.65UP.TO.ZS https://data.worldbank.org/indicator/SP.POP.65UP.TO.ZS?view=chart |
||
| CHILD MORTALITY (CMORTAL) | Definition
Infant mortality rate is the number of infants dying before reaching one year of age, per 1,000 live births in a given year. (World Bank 2018).
Excel Table SP.DYN.IMRT.IN https://data.worldbank.org/indicator/SP.DYN.IMRT.IN?view=chart |
||
| COMMERCIAL OPENING
(TRADE) |
Definition
Exports of goods and services (% of GDP) plus imports of goods and services (% of GDP)
https://data.worldbank.org/indicator/NE.EXP.GNFS.ZS?view=chart https://data.worldbank.org/indicator/NE.IMP.GNFS.ZS?view=chart |
||
| URBANIZATION
(URBAN) |
Definition
Urban population refers to people living in urban areas as defined by national statistical offices. The data are collected and smoothed by United Nations Population Division (World Bank 2018).
Excel Table SP.URB.TOTL.IN.ZS https://data.worldbank.org/indicator/SP.URB.TOTL.IN.ZS?view=chart |
||
| INTERNACIONAL AID
(INTAID) |
Definition
Net official development assistance (ODA) per capita consists of disbursements of loans made on concessional terms (net of repayments of principal) and grants by official agencies of the members of the Development Assistance Committee (DAC), by multilateral institutions, and by non-DAC countries to promote economic development and welfare in countries and territories in the DAC list of ODA recipients; and is calculated by dividing net ODA received by the midyear population estimate. It includes loans with a grant element of at least 25 percent (calculated at a rate of discount of 10 percent).
Excel Table: DT.ODA.ODAT.PC.ZS https://data.worldbank.org/indicator/DT.ODA.ODAT.PC.ZS?view=chart |
||
| DECENTRALIZATION
(DEC) |
Definition
Decentralization of levels of power and execution. Source: Daniel Treisman, Decentralization Dataset, 2008, http://www.sscnet.ucla.edu/polisci/faculty/treisman/ |
||
| ETHNIC VARIATION (ETHNIC) | Definition
Existence of more than one ethnicity in the same state.
Source: Weidmann, Nils B., Jan Ketil Rød and Lars-Erik Cederman (2010). “Representing Ethnic Groups in Space: A New Dataset”. Journal of Peace Research, in press. Contact Nils B. Weidmann (http://nils.weidmann.ws/), Princeton University Jan Ketil Rød (http://www.svt.ntnu.no/geo/jan.rod/default_e.asp), NTNU Trondheim Lars-Erik Cederman (http://www.icr.ethz.ch/people/cederman), ETH Zurich http://worldmap.harvard.edu/data/geonode:GREG_0vV |
||
| ARTIFICIAL BORDERS
(BORD) |
Definition:
Borders artificially defined, without the support of natural accidents for demarcation, disregarding anthropological issues of the communities surrounding the borders
Source: Alesina, Alberto, William Easterly, and Janina Matuszeski. 2006. Artificial states. Cambridge (Mass.): National Bureau of Economic Research. |
||
|
DEMOCRACIA (DEMOC) |
Definition:
Concept of democracy, embracing liberal as well as participatory ideas of democracy, which illuminate the phenomenon from different perspectives). It consists of a stepwise theoretical deduction of fundamental elements of democracy. The starting point is the premise that a democratic system tries to establish a good balance between the normative, interdependent values of freedom and equality and that this requires control. In order to guarantee these three fundamental principles and thus the quality of democracy, nine democratic functions (individual liberties, rule of law, public sphere, competition, mutual constraints, governmental capability, transparency, participation and representation) need to be fulfilled. Every function is further disaggregated into two components each, which finally, are measured by several sub-components and indicators. Fonte: http://www.democracybarometer.org/concept_en.html |
||
Source: Author itself based on the sources cited in the table.
3. RESULTS
After the collection, cleaning and data preparation, the database was submitted to the logistic regression through the statistical software EVIEWS 10 Student Version Lite. The results as shown as follows:
Table 2 – First round of logit regression with all potential explanatory variables
Dependent Variable: DEFRAG
Method: ML – Binary Logit (Newton-Raphson / Marquardt steps)
Date: 01/24/19 Time: 17:25
Sample: 2007 3781
Included observations: 1259
Convergence achieved after 3 iterations
Coefficient covariance computed using observed Hessian
| Variable | Coefficient | Std. Error | z-Statistic | Prob. |
| C | 1.217832 | 0.411171 | 2.961864 | 0.0031 |
| GDP | -3.09E-06 | 5.80E-06 | -0.533186 | 0.5939 |
| VIO | 0.004712 | 0.005339 | 0.882646 | 0.3774 |
| GOV | -0.010746 | 0.004109 | -2.615322 | 0.0089 |
| INTAID | 0.000805 | 0.001228 | 0.655182 | 0.5124 |
| ELD | 0.034237 | 0.017407 | 1.966884 | 0.0492 |
| INVEDU | 0.015201 | 0.007588 | 2.003456 | 0.0451 |
| CMORTAL | -0.010933 | 0.004240 | -2.578783 | 0.0099 |
| TRADE | -0.055147 | 0.034124 | -1.616079 | 0.1061 |
| URBAN | 1.66E-09 | 8.49E-10 | 1.960439 | 0.0499 |
| DEMOC | -0.039748 | 0.169912 | -0.233934 | 0.8150 |
| DEC | -0.133458 | 0.062712 | -2.128121 | 0.0333 |
| ETHNIC | -0.218242 | 0.188569 | -1.157363 | 0.2471 |
| BORD | -0.035156 | 0.214388 | -0.163982 | 0.8697 |
| McFadden R-squared | 0.026039 Mean dependent var | 0.510723 | ||
| S.D. dependent var | 0.500084 S.E. of regression | 0.493687 | ||
| Akaike info criterion | 1.371988 Sum squared resid | 303.4404 | ||
| Schwarz criterion | 1.429123 Log likelihood | -849.6667 | ||
| Hannan-Quinn criter. | 1.393460 Deviance | 1699.333 | ||
| Restr. deviance | 1744.766 Restr. log likelihood | -872.3828 | ||
| LR statistic | 45.43206 Avg. log likelihood | -0.674874 | ||
| Prob(LR statistic) | 0.000018 | |||
| Obs with Dep=0 | 616 Total obs | 1259 | ||
| Obs with Dep=1 | 643 | |||
Source: author itself, using the software Eviews 10 Student Version Lite.
In the first round of regression, there were nine non-significant variables among thirteen (p-value > 0.05). The second round of logit regression is as follows:
Table 3 – Final logit regression with the explanatory variables GOV e CMORTAL
Dependent Variable: DEFRAG
Method: ML – Binary Logit (Newton-Raphson / Marquardt steps)
Date: 02/19/19 Time: 18:35
Sample: 2007 3781
Included observations: 1764
Convergence achieved after 4 iterations
Coefficient covariance computed using observed Hessian
| Variable | Coefficient Std. Error z-Statistic | Prob. |
| C | 0.870808 0.190715 4.566018 | 0.0000 |
| GOV | -0.005354 0.002474 -2.163991 | 0.0305 |
| CMORTAL | -0.017725 0.002979 -5.950698 | 0.0000 |
| McFadden R-squared | 0.019731 Mean dependent var | 0.535147 |
| S.D. dependent var | 0.498905 S.E. of regression | 0.492277 |
| Akaike info criterion | 1.357494 Sum squared resid | 426.7553 |
| Schwarz criterion | 1.366806 Log likelihood | -1194.310 |
| Hannan-Quinn criter. | 1.360935 Deviance | 2388.620 |
| Restr. deviance | 2436.700 Restr. log likelihood | -1218.350 |
| LR statistic | 48.07948 Avg. log likelihood | -0.677046 |
| Prob(LR statistic) | 0.000000 | |
| Obs with Dep=0 | 820 Total obs | 1764 |
| Obs with Dep=1 | 944 |
Source: author itself, using the software Eviews 10 Student Version Lite.
In order to check whether the proposed adjusted model explains the phenomenon, it was applied the Hosmer – Lemeshow test. The Chi-square was not significant, suggesting good adjustment. The test is as follows:
Table 4 – Hosmer-Lemeshow Test
Goodness-of-Fit Evaluation for Binary Specification
Andrews and Hosmer-Lemeshow Tests
Equation: DEFRAG
Date: 02/19/19 Time: 18:38
Grouping based upon predicted risk (randomize ties)
| Quantile of Risk | Dep=0 | Dep=1 | Total | H-L | |||||
| Low | High | Actual | Expect | Actual | Expect | Obs | Value | ||
| 1 0.2091 | 0.4037 | 109 | 113.709 | 67 | 62.2905 | 176 | 0.55111 | ||
| 2 0.4059 | 0.4629 | 111 | 99.0291 | 65 | 76.9709 | 176 | 3.30885 | ||
| 3 0.4636 | 0.5110 | 93 | 90.6871 | 84 | 86.3129 | 177 | 0.12097 | ||
| 4 0.5111 | 0.5524 | 76 | 81.9815 | 100 | 94.0185 | 176 | 0.81698 | ||
| 5 0.5526 | 0.5700 | 81 | 77.2219 | 96 | 99.7781 | 177 | 0.32790 | ||
| 6 0.5700 | 0.5773 | 76 | 75.0255 | 100 | 100.974 | 176 | 0.02206 | ||
| 7 0.5773 | 0.5868 | 64 | 73.5635 | 112 | 102.437 | 176 | 2.13613 | ||
| 8 0.5870 | 0.5957 | 79 | 72.3918 | 98 | 104.608 | 177 | 1.02067 | ||
| 9 0.5958 | 0.6093 | 59 | 70.1272 | 117 | 105.873 | 176 | 2.93501 | ||
| 10 0.6095 | 0.6759 | 72 | 66.2629 | 105 | 110.737 | 177 | 0.79395 | ||
| Total | 820 | 820.000 | 944 | 944.000 | 1764 | 12.0336 | |||
| H-L Statistic | 12.0336 | Prob. Chi-Sq(8) | 0.1497 | ||||||
| Andrews Statistic | 14.6234 | Prob. Chi-Sq(10) | 0.1464 | ||||||
Source: author itself, using the software Eviews 10 Student Version Lite.
The next test executed was the check of intervals of confidence, as follows:
Table 5 – Test of coefficient confidence intervals
Coefficient Confidence Intervals
Date: 02/19/19 Time: 18:39
Sample: 2007 3781
Included observations: 1764
| 90% CI | 95% CI | 99% CI | ||
| Variable | Coefficient | Low High | Low High | Low High |
| C | 0.870808 | 0.556945 1.184672 | 0.496757 1.244860 | 0.379026 1.362591 |
| GOV | -0.005354 | -0.009426 -0.001282 | -0.010207 -0.000501 | -0.011735 0.001026 |
| CMORTAL | -0.017725 | -0.022627 -0.012823 | -0.023567 -0.011883 | -0.025406 -0.010044 |
Source: author itself, using the software Eviews 10 Student Version Lite.
The multicollinearity test showed the variance inflation factor (VIF) smaller than 10, which indicates no multicollinearity.
Table 6 – Test of existent multicollinearity
| Model | No standard coefficients | Standard coefficients | t | Sig. | Statistics of collinearity | |||
| B | Standard Error | Beta | Tolerance | VIF | ||||
| 1 | (Constant) | ,712 | ,046 | 15,603 | ,000 | |||
| GOV | -,001 | ,001 | -,074 | -2,159 | ,031 | ,465 | 2,152 | |
| CMORTAL | -,004 | ,001 | -,211 | -6,114 | ,000 | ,465 | 2,152 | |
Source: author itself, using the software Eviews 10 Student Version Lite.
The verification of the existence of outliers showed that there was no discrepant value. Among 1,775 observations, 1,473 were analyzed, which represents 83% of the available universe. 17% of cases were flawed. After the analysis of 13 potential predictor variable, just governance (GOV) and child mortality (CMORTAL) were significant. The model with the variable GOV was significant with p-value < 0.05. The model without independent variable (only with the constant) presented 52.1% of chance toward defragilization of fragile states. On the other hand, the model including the variables GOV and CMORTAL indicates 57.6% of chance of defragilization. The variable GOV was a significant predictor with odds ratio: 0.9938, and confidence index: 95%, varying from 0.988 to 0.999. The variable CMORTAL also was a significant predictor with odds ratio: 0.983, and confidence index: 95%, varying from 0.9777 to 0.990.
The equation, which defines the probability of defragilization of fragile states, would be:
 Equation 5 – Equation for calculation of probability of defragilization of fragile states
Source: author itself
The seemingly unrelated regressions model aimed to avoid the possibility of evaluation’s contamination by the distinction of states among themselves. The method checked: 1) the F Test (evaluation of null hypothesis); 2) Breusch-Pagan Test (panel least squares), and 3) Hausman Test. The results showed that the F Test had p-value < 0.05, the cross-section Brusch-Pagan had p-value < 0.005; and the Chi-square for the Hausman Test was suitable.
Through the cross-section random effects method, the fragility for states in process of defragilization process might be expressed by the following formula:
![]() Equation 6 – Random effect equation with governance and child mortality variables
Equation 6 – Random effect equation with governance and child mortality variables
Source: author itself.
4. DISCUSSION
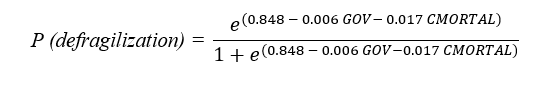
The statistical results from a sample of fragile states showed that governance and reduction of child mortality are the two variables that explain the phenomenon of defragilization in fragile states. Such variables responded the question concerned of causes that have promoted defragilization of fragile states, considering that other variables, such as international aid, democracy or reduction of violence, would may be significant, but they were not. Although it seems that states are long-established institutions, they (states) are not. States are relatively new creations within the scope of human development (CASTRO, 2012). Such situation certainly contributes to the low capability of governance among young states. The following chart shows the amount of states by period of independency, most of them with less than 100 years of establishment.
Figure 2 – Graphic of independent states by period
According to the Convention on the Rights and Duties of States (1933) defined that State, as a person under international law, needs to have: 1) permanent population; 2) territory; 3) government; and 4) ability to enter into relations with other states. While some people confound a state as a government, Bluntschli (2000) and Kukathas (2008) assert that there is a misguided attempt to equate them, once it does not exist. The state is a combination of government and governed. The government has to have authority to carry out its mission to manage the state’ capacity well while the governed provides legitimacy to the government to perform its mission. However, fragile states traditionally have unable governments to ensure basic security, services and economic opportunities, and insufficient legitimacy to maintain citizens’ trust (BRINKERHOFF e JOHNSON, 2008). Notice that the United Nations, by peacekeeping operations try to bringing failed (i.e. fragile) states back to life, often after decades of conflict (ANNAN, 2006), however it was proved that UN peacekeeping operations interfere negatively on the fragile states indices (NASCIMENTO, 2016).
Regarding the concept of defragilization, digital research through the internet scholar sources showed that there is no specific study about such a theme. The unique record about this subject was, “the “defragilization” of states can be viewed as a process whereby societies develop mechanisms for nonviolent conflict and dispute resolution institutions” (NOOR et al., 2010). Under another perspective, Carment et al. (2013), in a study on the transition of fragile states from 1980 to 2010 (using the Country Indicators for Foreign Policy – CIFP), concluded that successful transitions out of fragility (transition can be understood as a defragilization process) are processes of improvement of authority, legitimacy and capacity of the state.
In 1994, Esty et al.(1995) conducted statistical research on fragile states. Initially, they selected 600 variables related to the phenomenon of fragility. Of that amount, 75 received high priority, however, according to Esty et al., the simplest and most accurate model was restricted to openness to international trade, infant mortality and the level of state democracy. As Esty et al. highlighted, infant mortality is not a direct cause of frailty and, in the same way, it is understood that it is also not a direct cause of weakening, but it is an indicator that shows an improvement in quality of life. The reduction in infant mortality does not occur by chance. On the contrary, it is the result of governance actions in the area of public health, including vaccinations, sanitation, and security among others. This thinking is consistent with the concept of governance used by Work Bank, which says it is intrinsically linked to public services provided to the population and to public policies implemented by the Government (ESTY et al., 1995).
In 2007, the European Commission pointed out that governance deficit was the main cause of state fragility, and the governance shortcomings and failures were in lack of political legitimacy compounded by very limited institutional capacities linked to poverty (HOUT, 2013). Unfortunately, governance is another concept that lacks unity and consensus (MESSINEO e WANG, 2011) among academics, institutions or international organizations, once it is very comprehensive (MALIK, 2022). Despite the various problems, Malik suggested indicators selected among those strongly correlated with better test scores, with large samples; and preferably those produced by private agencies due to the accuracy requirement.
Table 7 – Governance indicators
| ECONOMIC GOVERNANCE | POLITICAL GOVERNANCE | ADMINISTRATIVE GOVERNANCE |
| Inflation | Corruption | Quality of the bureaucracy |
| Budget Deficit – % GDP | Ethnical Tension | Capacity |
| Financial Deficit – % GDP | Government Stability | Effectiveness |
| Public expenses in health care – % GDP | Rule of law | Accountability |
| Public expenses in education – % GDP | Socio-economic conditions | |
| Official vs. parallel exchange rate ratio | Freedom of expression | |
| Non-discrimination | ||
| Political Participation |
Source: own author elaborated based on data from Malik and Antem (ANTEM, 2009).
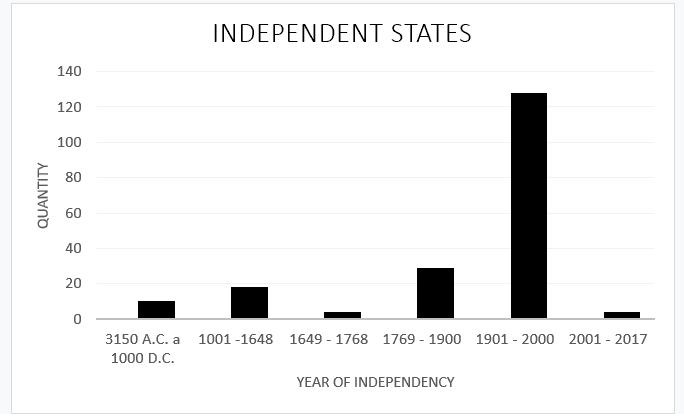
The following graphics show the correlation between defragilization and the improvement of governance, as well as defragilization and the reduction of infant mortality, proving the importance of those variables.
Figure 3 – Graphic of relationship between defragilization and governance
Figure 4 – Graphic of relationship between defragilization and infant mortality
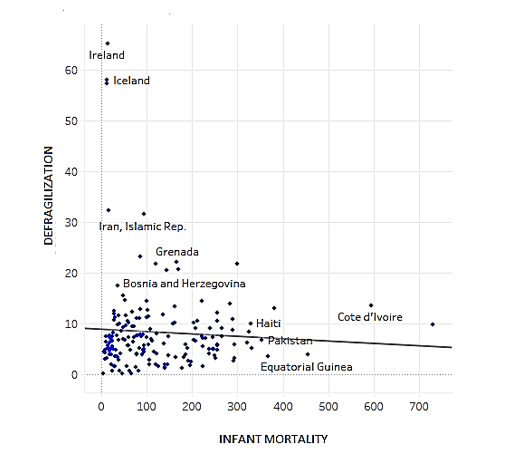
A 2019 study by the Fund for Peace, about the Caucasian states Georgia, Armenia and Azerbaijan, which presented defragilization, showed significant economic improvements despite existent conflict issues. Georgia has reduced: 1) infant mortality by 50% since 2008; 2) the poverty rate to around 40% between 2008 and 2016; and 3) the homicide rate by 90% in a decade.
The 2022 Report from Fund for Peace highlighted 10 most improved states regarding defragilization in the period 2012-2022: 1) Uzbekistan, 2) Bhutan; 3) Moldova, 4) Indonesia, 5) Côte d’Ivoire, 6) Timor-Leste, 7) Cape Verde. 8) Vietnam, 9) Georgia, and 10 Cuba. The comparison between defragilization and governance, in the period of 2006 – 2020, for those states is as follows:
Figure 5 – Uzbekistan: relationship between defragilization and governance
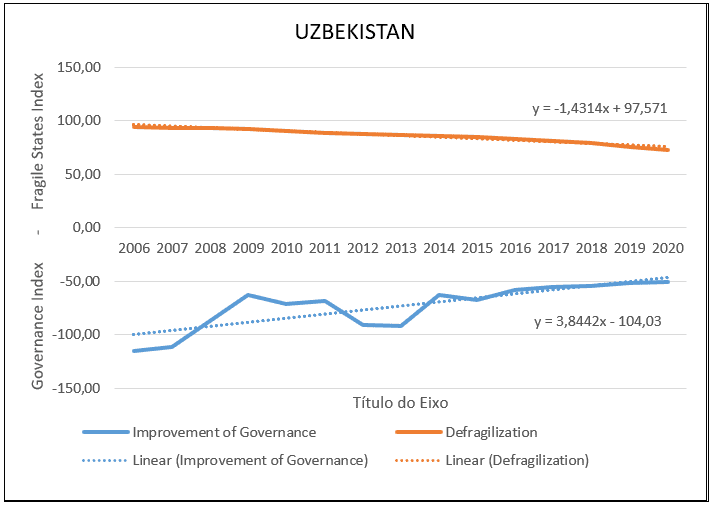
Figure 6 – Bhutan: relationship between defragilization and governance
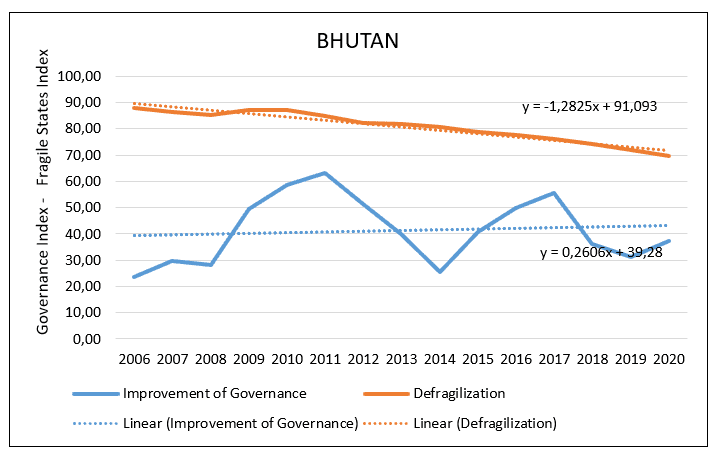
Figure 7 – Moldova: relationship between defragilization and governance
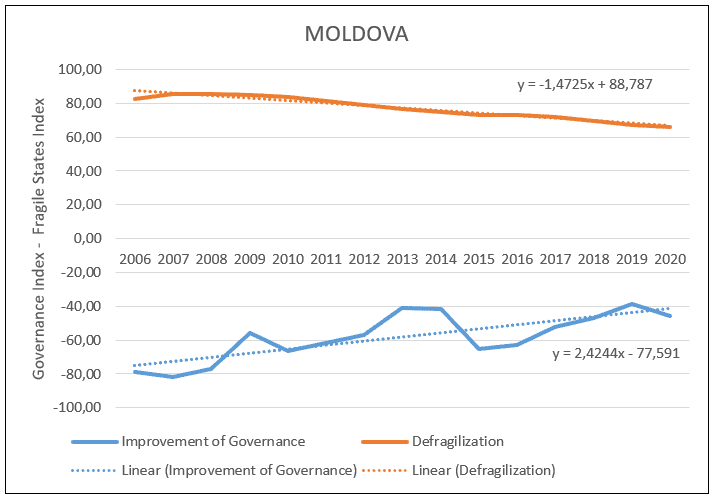
Figure 8 – Indonesia: relationship between defragilization and governance
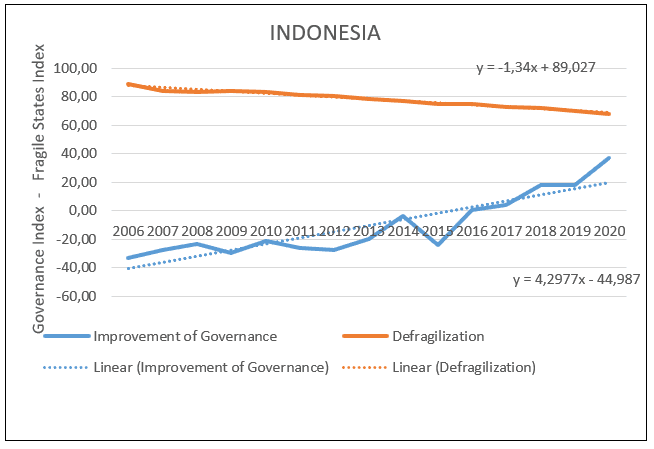
Figure 9 – Côte D’Ivoire relationship between defragilization and governance
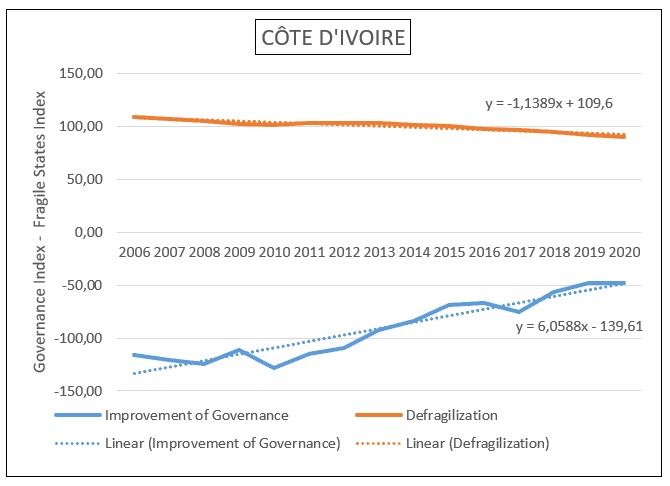
Figure 10 – Timor Leste: relationship between defragilization and governance
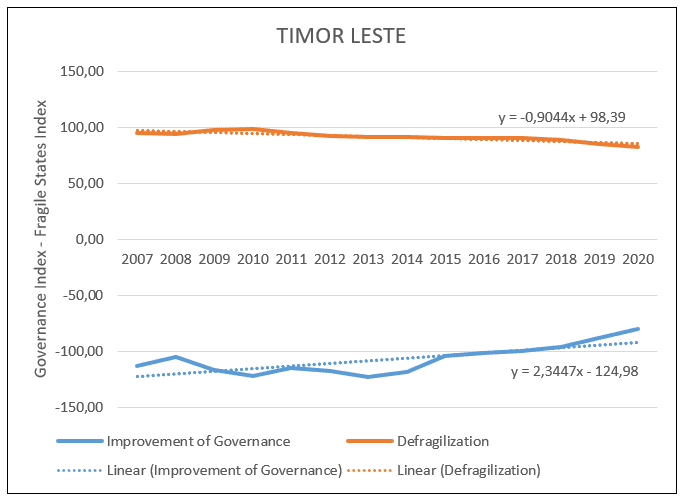
Figure 11 – Cape Verde: relationship between defragilization and governance
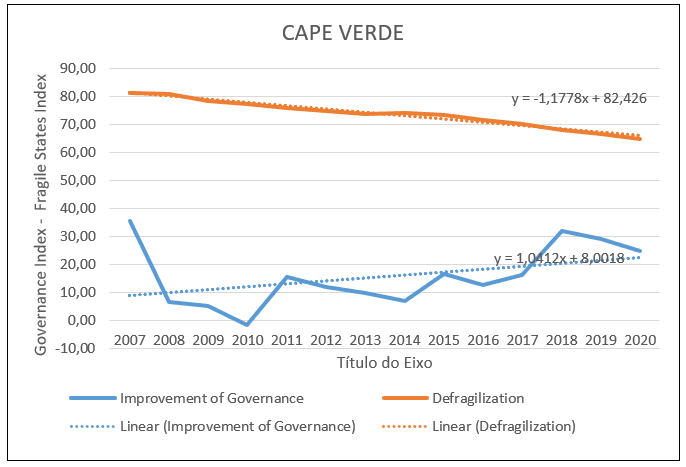
Figure 12 –Vietnam: relationship between defragilization and governance
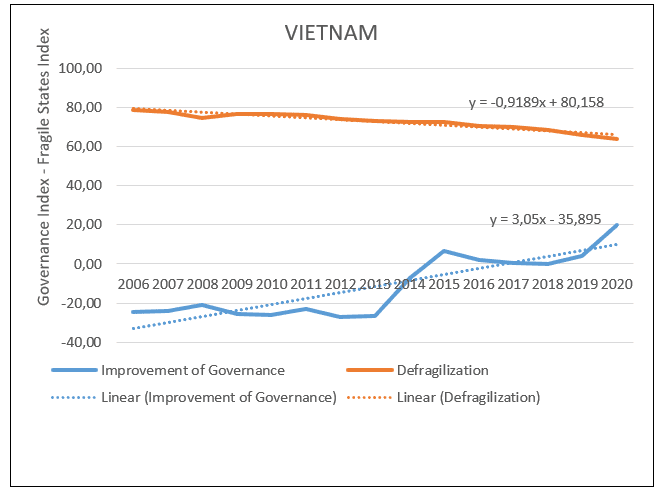
Figure 13 – Georgia: relationship between defragilization and governance
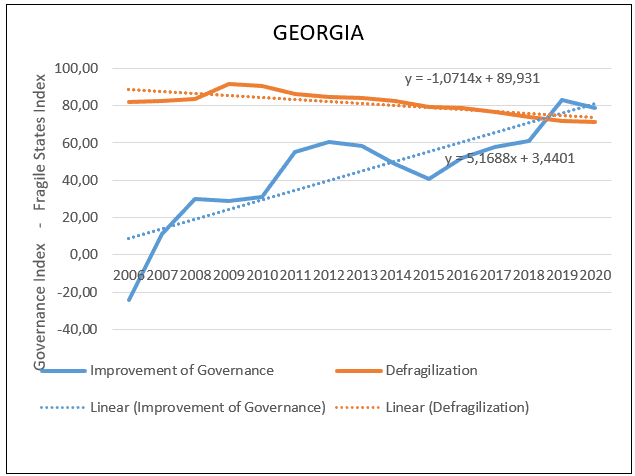
Figure 14 – Georgia: relationship between defragilization and governance
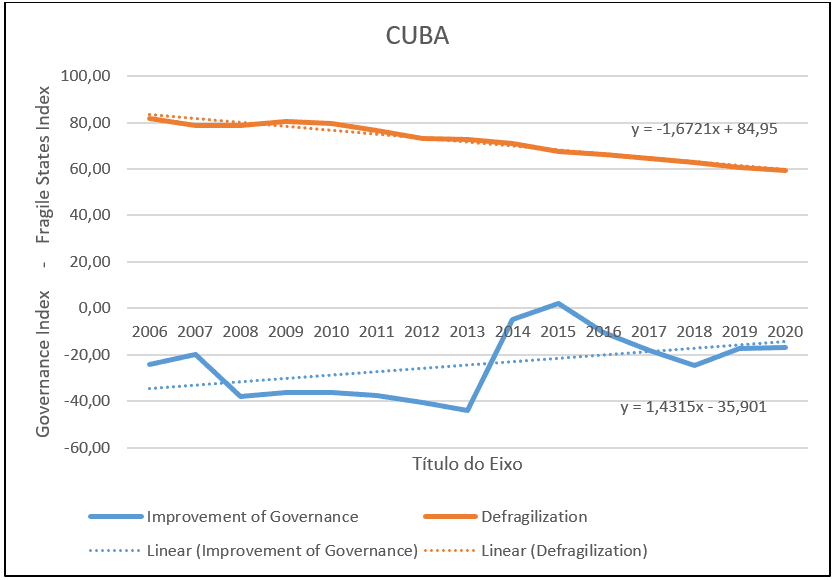
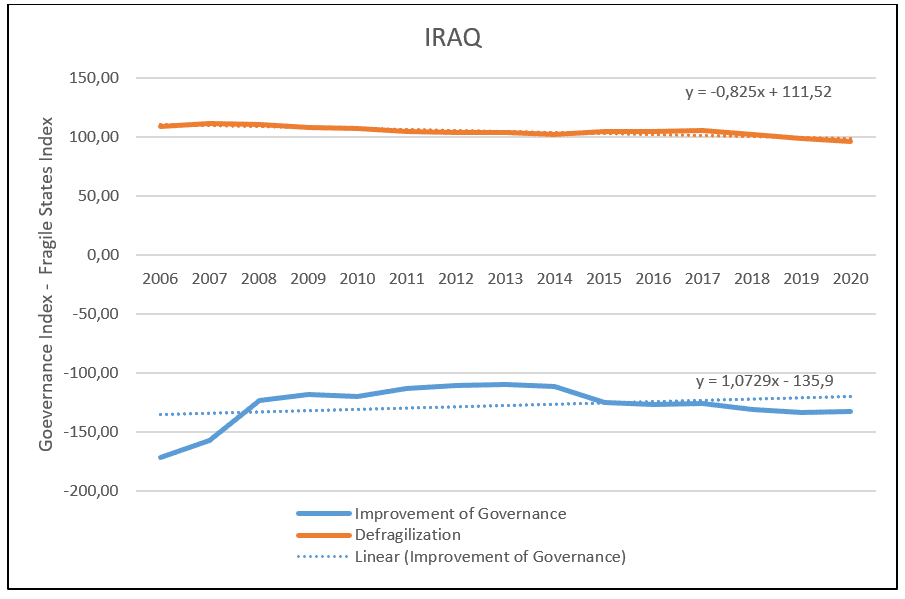
The comparison between the behavior of fragility and the performance of governance presented by the aforementioned states is consistent with the statistical results and the literature review, which supports the proposed thesis. Tanaka and Yoshikawa presented the case study of Iraq, through the helping of the Japan International Cooperation Agency (JICA). The review of construction projects management undertaken by Iraqi government officials has produced a decrease in lapses and an improvement in state governance (TANAKA e YOSHIKAWA, 2013). As a consequence is possible to see the gradual reduction of fragility indices in Iraq.
Figure 15 – Iraq: relationship between defragilization and governance
5. CONCLUSION
The process of defragilization of states is a set of continuous and prolonged actions with the aim of reducing the weaknesses of state institutions and society. The research carried out suggests that it is not a natural process but induced and fostered by exogenous and endogenous forces, especially promoted by good governance.
The initial logic suggested that the improvement of the predominant factors for the state’s weakening process, such as per capita domestic product, GDP growth, opening to international trade, and the state’s level of democracy, would result in defragilization of states. However, the logistic regression performed, involving data from 2007 to 2017, embracing a universe of 115 states, showed another scenario. The explanatory variables governance and infant mortality reduction were significant and apparently vital contributors to fragility decrease. The infant mortality reduction had a more significant effect on the state’s defragilization process (NASCIMENTO, 2019). Some scholars understand that, in fact, this variable does not directly represent defragilization, but is intrinsically related to the process of improving governance in public health, sanitation, security, food and reduction of socio-economic inequalities. Concrete cases of improvement of governance, in fragile states, show the reduction of fragility and suggest a consistent correlation.
In order to avoid endogeneity and bias issues, a linear regression with the model of apparently unrelated regressions was used and it confirmed the result of significance of the explanatory variables governance and infant mortality..
The result of this research is relevant to guide and prioritize the future actions of stable states and international organizations upon fragile states regarding investments and monetary aid. The results open windows for new investigations about what areas of governance have to be prioritized in fragile states.
REFERENCES
ALESINA, Alberto; EASTERLY, William; MATUSZESKI, Janina. Artificial states. Cambridge (Mass.): National Bureau of Economic Research. 2006.
ANNAN, Kofi. Panel Discussion on the occasion of the International Day of United Nations Peacekeepers. 2006.
ANTEN, Louise. Strengthening Governance in Post-Conflict Fragile States. The Hague: Netherlands Institute of International Relations “Clingendael. http://www.clingendael.nl/cscp/news/2009/20090611_new_cru_paper_strengthening_governance_i. 2009.
BAKER, Pauline H. Reframing Fragility and Resilience: The Way Foward. 2017.
BERTOCCHI, Graziella; GUERZONI, andrea. The fragile definition of state fragility. Modena: Università degli Studi di Modena y Reggio Emilia, Dipartimento di Economia Politica. 2010
BLUNTSCHLI, Johann Kaspar. The Theory of the State. Batoche Books. 2000.
BRINKERHOFF, Derick W; JOHNSON, Ronald W. Good Enough Governance in Fragile States: the Role of Center-Periphery Relations and Local Government. 2008.
CARMENT, David; PREST, Stewart; SAMY, Yiagadeesen. Determinants of State Fragility and Implications for Aid Allocation: An Assessment Based on the Country Indicators for Foreign Policy Project. United Nations University. 2008.
CARMENT, David; SAMY, Yiagadeesen. Assessing State Fragility: A Country Indicators for Foreign Policy Report. CFIP Report. 2012.
CARMENT, David; SAMY, Yiagadeesen; LANDRY, Joe. Transitioning Fragile States: A Sequencing Approach. The Fletcher Forum of World Affairs. Vol 47:2, Summer. 2013.
CARMENT, David; LANDRY, Joe; SAMY; Yuagadeesen; SHAW, Scot. Towards a theory of fragile state transitions: evidence from Yemen, Bangladesh and Laos. Third World Quaterly, 36:7, 1316-1332. 2015.
CARVALHO, Soniya. Engaging with fragile states: an IEG review of World Bank support to low-income countries under stress. World Bank. https://openknowledge.worldbank.org/bitstream/handle/10986/7155/382850Revised01gile0states01PUBLIC1.pdf;sequence=1. 2006
CASTRO, Thales. Teoria das Relações Internacionais. Brasília: FUNAG. 2012.
Convenção Sobre Direitos e Deveres dos Estados. 1933. Accessed August 10, 2018http://honoriscausa.weebly.com/uploads/1/7/4/2/17427811/convencao_sobre_direitos_e_deveres_dos_estados-12.pdf.
DI JOHN, Jonathan. Conceptualising the causes and consequences of failed states: a critical review of the literature. London: Crisis States Research Centre. 2008.
ESTY, Daniel C; GOLDSTONE, Jack A; GURR, Ted Robert; SURKO, Pamela T; UNGER, Alan N. Working Papers State Failure Task Force Report. 1995.
European Report on Development. Development in a Context of Fragility Focus on Africa. 2009.
Fund for Peace. 2018. Accessed October 4, 2022. http://fundforpeace.org/fsi/.
GOLDSTONE, Jack; GURR, Ted; HARFF, Barbara; LEVY, Marc; MARSHALL, Monty; EPSTEIN, David; KAHL, Colin; WOODWARD, Mark; SURKO, Pamela; UNGER, Alan. State Failure Task Force report: phase III findings. Accessed August 29, 2018. https://www.raulzelik.net/images/rztextarchiv/uniseminare/statefailure%20task%20force.pdf. 2000
GRÄVINGHOLT, Jorn; ZIAJA, Sebastian; KREIBAUM, Merle. State Fragility: towards a multidimensional empirical tipology. 2012.
HELMAN, Gerald; RATNER, Steven R. Saving failed states. Foreign Policy. Winter 92, Issue 9, p:3-16. 1993.
HOUT, Will. EU Statebuilding through Good Governance. in The Routledge Handbook of International Statebuilding, Abingdon: Routledge, p: 362-74. 2013.
JACKSON, Robert. States and Quasi-states”, chapter 1 in Quasi-states: Sovereignty, International Relations and the Third World, Cambridge University Press. 1990.
Kaplan Seth. Fixing fragile states. Policy Review. (152): 63-77. 2008.
____________. Fixing Fragile States: a country-based framework. Norwegian Peacebuilding Resource Centre. 2015.
Kukathas, Chandran. A Definition of the State. Presentation at a conference on “Dominations and Powers: The Nature of the State, University of Wisconsin, Madison, March 29, 2008.
Malik, Adeel. State of the Art in Governance Indicators. United Nations Development Programme. Human development report office. Background paper for HDR. 2002.
Marc, Alexandre; Willman, Alys; ASLAM, Ghazia; REBOSIO, Michelle; Balasuriya, Kanishka. Societal Dynamics and Fragility: Engaging Societies in Responding to Fragile Situations. 2013.
Mcloughlin, Claire. Topic Guide on Fragile States. Governance and Social Development Resource Centre. University of Birmingham, UK. 2012.
Messineo, Carol; WANG, Per Egil. Approaches to Governance in Fragile and Conflict Situations: A Synthesis of Lessons. Social Development Department. The World Bank. 2011.
Nascimento, Mario Brasil. United Nations Peacekkeping Operations in Fragile States: Improvement or deterioration of a state’s fragility. Master Thesis submitted to the Faculty of American Public University. Charles Town. West Virginia. 2016.
__________________________. O Processo de Desfragilização de Estados: Lições para Melhoramento de Estados e, Situação de Fragilidade. Tese de Doutorado apresentada na Atlantic International University. 2019
NATIONAL DEFENSE UNIVERSITY FORT MCNAIR DC AFRICAN CENTER FOR STRATEGIC STUDIES, and SIEGLE, Joseph. Stabilizing Fragile States. http://oai.dtic.mil/oai/oai?&verb=getRecord&metadataPrefix=html&identifier=ADA589401. 2011
Naudé, Wim A; Amelia Uliafnova Santos Paulino; Mark McGillivray. Fragile states:causes, costs, and responses: a study prepared by the World Institute for Development Economics Research of the United Nations University (UNU-WIDER). Oxford, U.K.: Oxford University Press. http://search.ebscohost.com/login.aspx?direct=true&scope=site&db=nlebk&db=nlabk&AN=395482. 2011.
Nguendi, Francis. Africa’s international borders as potential sources of conflict and future threats to peace and security. Institute for Security Studies. No 233, May 2012.
Noor, Mina; DOUMA, Nynke; DER HAAR, Gemma van; HILHORST, Dorothea; DER MOLEN, , Irna van; STEL, Nora Multi-Stakeholder Processes, Service Delivery and State Institutions. Theoretical framework & Methodologies. Working Paper. Nº 0030. Peace Security and Development Network. 2010.
OECD.The State’s Legitimacy in Fragile Situations. 2010.
______. states of fragility: Highlights. 2018
PSN (Population and Sustainability Network). Population Dynamics and Fragile States. PSN Briefing Paper; April 2012. London. Accessed August 29, 2018. http://populationandsustainability.org/wp-content/uploads/2014/10/Population-Dynamics-and-Fragile-States-Briefing.pdf. 2012.
Rothberg, Robert. Failed States, Collapsed States, Weak States: Causes and Indicators in State Failure and State Weakness in a Time of Terror. 2003.
Silva, Mario. Failed and Failing States: Causes and Conditions. Thesis Irish Centre for Human Rights National University of Ireland Galway. 2012.
Tanaka, Seiki; Yoshikawa, Masanori. Establishing Good Governance in Fragile States Through Reconstruction Projects: Lessons from Iraq. Global Economy and Development. Working Paper 56 January 2013. Brookings. 2013.
TUSALEM, Rollin F. The Colonial Foundations of State Fragility and Failure. Polity 48 (4):445-495. 2016.
Vallings, Claire, and Magüi Moreno Torres. Drivers of fragility: what makes states fragile? [London]: Dept. for International Development. 2005.
Zartman, William. Introduction: Posing the Problem of State Collapse in Collapsed States: the Disintegrations and Restoration of Legitimate Authority, Boulder, London, UK. 1995
APPENDIX REFERENCE FOOTNOTE
3. β0 is the intercept, considering the other factors equal to zero; β1 is the logarithm of gross domestic product (GDP) per capita for purchasing at parity; β2 is the predictor of GDP growth; β3 demo is the level of democracy; β4 trade is the trade openness, represented by the ratio between the sum of exports and imports, and GDP, and εi is the normal disturbance or error term with the usual properties.
[1] Doctorate in International Relations – Atlantic International University. Master in International Relations – American Military University. Master in Hemispheric Security and Defense – National Academy of Political and Strategic Studies of Chile. Master’s in Military Sciences – Army Command and General Staff School. Postgraduate in Hemispheric Security and Defense – Inter-American Defense College. Postgraduate in Mathematics – Vale do Jacuí Foundation. Postgraduate in Cryptography and Network Security – Universidade Federal Fluminense. Bachelor of Business Administration – Universidade do Sul de Santa Catarina. Bachelor of Military Sciences – Academia Militar das Agulhas Negras. ORCID: 0000-0003-1973-594X.
[2] Advisor. ORCID: 0000-0003-4954-3623.
Sent: October, 2022.
Approved: October, 2022.