LANDIM, Jorge de Lima [1], LIMA, Jaylton Matos [2], LESSA, Avanir Carlos [3], QUINTINO, Luís Fernando [4]
Landim, Jorge de Lima. Et al. J&J Sensor for osmosis conductivity monitoring system. Revista Científica Multidisciplinar Núcleo do Conhecimento. 03 year, Ed. 09, Vol. 06, pp. 57-74 September 2018. ISSN: 0959-2448
SUMMARY
This article aims to present prototype and assist in the development of future developments of similar systems, serving as the basis for its improvement. The article described the osmosis sensor whose function analyzed aspects of water quantities and properties, demonstrating significant results for better use of water, due to several applications, for example, osmosis, which is responsible for Analyze the conductivity and temperature of the water, causing it to be purified to be able to be used in the next step of the system. In the course of this article the J&J sensor of osmosis was developed, and this detailed, specified can be computerized, so that a person of few technical information can understand this system and with adequate training, execute it. Thus, it was elaborated hardware that will facilitate its use, being this innovative and that proved to be effective, low cost and easy accessibility. The prototype was assailed and tested in the laboratory and satisfactorily obtained the identification of water under specified demineralization conditions.
Keywords: osmosis, conductivity, Sensor.
INTRODUCTION
A control system is a set of electrical, electronic and mechanical components that work to make "smart" decisions about a process. According to (OLIVEIRA, 2012), most of the controllers use the complex electronic circuits (such as processors) to perform the process measurement and take the appropriate actions.
The water is present in almost everything, as in the air in which we breathe, in the soil, in the plants and in our bodies. Based on this, if a person takes a certain amount of contaminated water, she will be sick or even may die due to water not purified or appropriate for human consumption. This also occurs with machines that make use of water, whether for production, refrigeration or cleaning that will decrease their production capacity, useful life and even become useless in a given function (Rheinnheimer, 1998).
For this purpose, the machines that depend on water for production or refrigeration have the need to go through a filtration system, whose name of the system is reverse osmosis, which is nothing more than a system with a set of previously developed filters, with the The purpose of removing impurities and minerals that damage the equipment.
For many, it will only be a filter system, but within the context of areas such as chemistry, pharmacy, health and engineering, it is a more complex system than just a home filter, being a control system that allows evidence through samples Carried out in specialized laboratories and/or, in an equipment installed in the reverse osmosis itself, which evidences whether the final result (product) is in accordance with the expected and specified.
This control and analysis equipment is developed through a mathematical modeling that presents a result (Bega, 2011).
The best known parameters are Ph (hydrogenic potential), temperature, PPM (particles per million) and conductivity. Through the Ph of the water it is possible to identify the water viscosity. In the case of equipment there is concern about PPM, temperature and conductivity and for a better understanding the context of the importance of water conductivity (Fernande, 2013) was approached.
The water sampling in PPM is an analysis through a probe formed by two electrodes separated to one cm ² of distance from each other, aiming to analyze the amount of particles existing in the distance of one cm ².
This sampling is performed through a fixed input voltage, taking due care with the type of tension applied, being necessary care regarding the material analyzed and the quality of the water, which contains ions that when applied a voltage causes the ions Expanding, thus creating results.
Temperature is also a factor that can interfere with the results. Ideally, this water when analysed is the closest to a temperature of 25 º C.
For the modeling, the conductivity of the water was interpreted as the inverse of the electrical resistance, that is, the electrical resistance as its name suggests oppose the passage of the electric current and when higher this resistance will be this electric current That passes through it. The conductivity is the part contrary to this resistance, that is, it is the capacity that a medium has to propagate (drive) the electric current in the mineralized water, treating as well as a water rich in mineral salts.
This conductivity tends to be high obliging this way the installation of a system that will control this condition. Thus, in order to decrease the conductivity of water in this medium was possible through mathematical modeling, defining with precision and objectivity the result. Once the value of the result was specified, it was possible to develop the system, which aims to measure the result of this product (demineralized water).
Dealing with the environment of chemistry and engineering, the electrical conductivity in the vast majority has its representation by solids in mineral-rich water. Two solids have a highlight:
- The compounds that have negative loads, having in their layer of valence free electrons that are the ionic compounds, phosphates, chlorides, sulfates.
- The other are those with positive loads, with loss of electrons in the valence layer, which are cationic compounds, whose examples are sodium, iron, calcium, aluminum and ammonia (VILLAS, 2013).
When it comes to the electrical conductivity of a given sample, this, in turn, is being quantified a large quantity of compounds gathered in this show, some of which are negative and other positive. These compounds in solution allow the passage of electricity, in distilled or deionized water. This water that contains only H2O, its conductivity is close to zero uS/cm ², that is, it is in some way an insulating water of null value of electrical conductivity.
The equation to express the electrical conductivity is:

Your unit is siemes (S), (Bega, 2011).
GOAL
Our article describes the operation of a conductivity sensor controlled by a microcontroller PIC-18f4520 with a working range from 0 to 00, 55us/CM ¹. This system evidences through a 16×2 LCD display the value obtained in the conductivity sensor, which is transmitted to an operating amplifier model lm741 that has a gain adjusted through a potentiometer of 100kω. This value is sent to the PIC-18f4520 microcontroller, where it is shown on the 16×2 LCD display.
The microcontroller is also responsible for reading the internal and external temperature sensor, model LM35. To highlight the value obtained on the LCD display was developed an HMI system with three menus:
- The first, the internal temperature in degrees Celsius (INT).
- The second, the external temperature in degrees Celsius (EXT).
- The third, the conductivity in ΜS/CM ¹ (COND).
The microcontroller is programmed to work from 0 to 00, 55us/CM ¹, which allows the operation of an output with an alternating current switching (AC) and allowing a reverse osmosis to work, producing demineralized water with a factor of Purity from 0 to 00, 55us/CM ¹. If this value is exceeded by the programmed maximum value, the system disconnects the output and thus does not allow contamination of the water already produced and stored in appropriate reservoirs, and thus fulfilling the proposed objective that was to monitor and control a Reverse osmosis system avoiding contamination failures, if filters fail (Miyadaira, 2014).
Operation
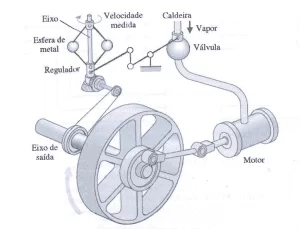
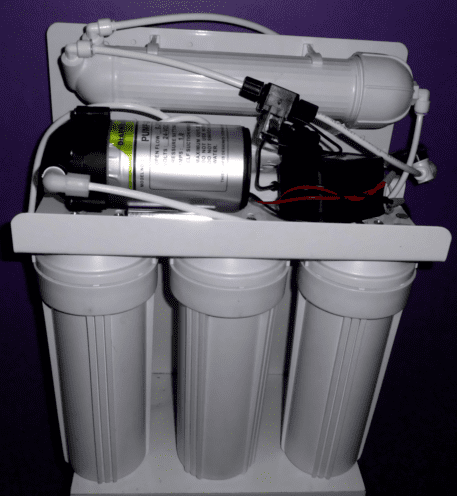
Reverse osmosis are separation steps that use a pressure to force a solution through a membrane that retains the solute on one side and allows the solvent to pass to the other side. In Figure 01 It is possible to visualize a reverse osmosis model Water System. The osmosis system is more formally forcing the solution of a region of high solute concentration through a membrane to a region of low solute concentration, through the application of an external pressure that exceeds osmotic pressure (MAJOP, 2011).
Figure 1: Reverse osmosis model.
In order for every reverse osmosis system to function correctly, a monitoring process should be placed, where it indicates that the treated water is with correct solutes values and applicable conductivity. The objective is that the conformity of industrial, pharmaceutical and hospital processes that use this system will ensure that this resource is treating that water without anomaly.
The conductivity sensor measures the ability to drive an electrical current between two electrodes with a distance of one cm ² between them. The electric current flows through the transport of the ion resulting in conductivity value (US/cm ²), also known as (MHO) and are measured in micro Siemens, due to Siemens being a very large unit (Bega, 2011).
For the conductivity sensor measuring the conductance, it is important to find the conductivity of the water in the sample. To determine the conductivity, the following equation is used:
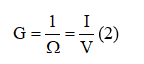
Where, G represents the conductance. A DDP (potential difference) is applied to both electrodes. The resulting current is proportional to the conductivity of the water in the sample. This current is converted into a voltage that will be read into the Pic 18f4520 microcontroller and demonstrated through the 16×2 LCD display.
The application of the conductivity sensor is to find the concentration of solids and dissolved total calcium.
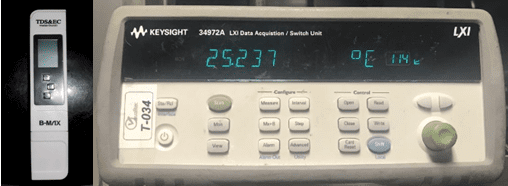
To calibrate the sensor is being used a portable TDS & EC (Hold) sensor model B-MAX and data acquisition, Agilent 34972a for temperature. (Splabor; 2012).
Control Board
In Figure 2 It is possible to identify the portable analyzer that was used with reference for adjusting the conductivity sensor and analyzer for temperature.
The characteristics of the sensor used TDS & EC model B-MAX.
Conductivity 0 to 9999us/cm.
TDS 0 to 9999PPM.
Celsius 0.1 to 80.0 º C.
Fahrenheit 32.0 to 176.0 º F.
The characteristics of the temperature standard used Agilent model 34972 ª with thermocouple type T.
Temperature -200 to 200 º C
Figure 2: TDF and EC analyzers.
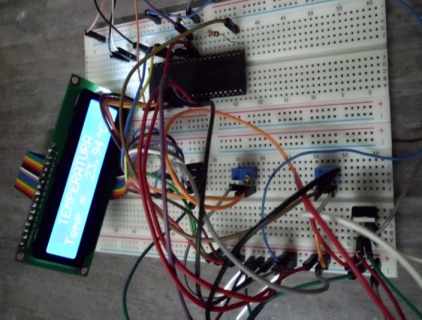
For simulation of the project was used an LCD display model 16×2 interconnected to a microcontroller PIC, model 18f4520 with external crystal 4MHz, all installed in the Protobord with maximum applied voltage of 5v as can be seen in the figure
Figure 3: Prototype Protobord simulation.
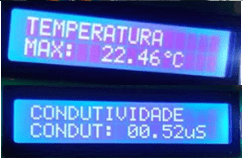
In Figure 4 is possible a demonstration of reading the temperature sensor in degrees Celsius and reading the conductivity sensor seen through the 16×2 LCD reader.
Figure 4. Display of LCD 16×2.
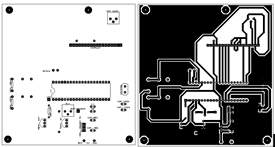
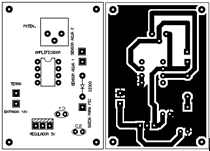
In Figure 5 It is possible to visualize the Layout of the control board with microcontroller, pic-18f4520, for the operation was adopted a transformer of 6v/1a, a voltage regulator 7805 to provide the working voltage of the pic-18f4520 (Capuano, 2013).
Figure 5: Description of Duplex Control Board components.
Materials and methodology
The conductivity is defined as the capacity of a material in conducting (ɪ) electric current, represented by the Greek letter σ or K, can be defined as the ratio between the density of the current (j) and electric field (e) We have, the intensity of the current in certain Solutions is dependent on the electrical resistance that is associated with this same solution. (RAMALHO, 2009).
Figure 6: Conductivity analysis system with electrodes.
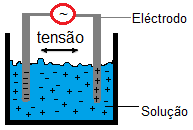
To avoid a change in the measured values, a tension was adopted and for the resistance between the electrodes the Ohm (Ω) Law applies.
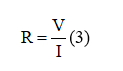
R represents the electrical resistance, ohm (Ω), V represents the electrical voltage (Volt), I represents the electric current, sustain (a). In Figure 6 It is possible to identify the behavior of ions in a solution (RAMALHO, 2009).
Another dependence of the conductivity in relation to the measurement is related to the area of the electrode surface and also the distance from each other. For this it is used a geometric constant (), which represents a cell constant where the conductivity can be defined using the equation:
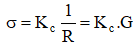
The cell constant is the inverse of the meter. Thus, the equation that defines the conductivity:
![]()
As ρrepresents resistivity, resistance can be defined through the equation:

Where it represents the distance between the electrodes, "a" represents the area between the electrodes, being,. (RAMALHO, 2009). It is very important to note that the cell constant (), since it is used in the equation to indicate the resistance and the value of conductivity.
In the prototype is used a model of concentric electrode presented in Figure 6, which allows a constant, with values from 0.01 to 0.1.
For the development of this prototype, research was conducted through books and academic articles related to the subject of conductivity (RAMALHO, 2009).
The micro-controller-pic18F4520 with external 4MHz clock was used, since it was understood that best suited to the experiment in question was also used the operational amplifier LM741c in this. Since the voltage applied to the electrode needs to be converted to an effective value that can be adjusted through the potentiometer of 10kω for signal adjustment, it was necessary to convert the applied voltage to effective value. For temperature reading, the LM35 was used where it was interconnected with pic18F4520 and adjusted by programming as a correction factor of 1023bits, corresponding to the maximum working voltage of the Circuit 5 V. List of components are in table 1.
Table 1-List of components
| Quantity | Description |
| 1 | PIC – 18f4520 |
| 1 | Crystal 4 MHZ |
| 1 | 16×2 LCD Display |
| 1 | 741 LM |
| 2 | LM35 |
| 2 | 7805 |
| 2 | Μf-25v Capacitors 1000 |
| 3 | Μf-25v Capacitors 100 |
| 2 | 33PF Capacitors |
| 1 | Capacitor 1PF |
| 5 | Diodes 1n4007 |
| 3 | Resistor 10 kω |
| 1 | Resistor 100 Ω |
| 2 | Trimpot 10 kω |
| 1 | Trimpot 100 kω |
| 1 | Transformer 6v/1a |
| 2 | No lock buttons |
| 1 | Relay 5v/10a/120VAC |
| 1 | BC547 |
| 1 | 555 |
Source: authors, 2018.
RESULTS AND DISCUSSIONS
During the development of the prototype was found great difficulty in finding adequate material, which allowed a mathematical modeling referencing the conductivity of water in terms of control by a sensor. After finding the appropriate material, another difficulty was found that was referenced to the values obtained that were not coherent with the value read by the pattern. As a solution was adopted the LM358 amplifier model and started a controller per window which was not obtained success since, the conductivity value was very low and not allowing an accurate adjustment in the maximum value obtained. After some research has been taken into consideration that the microcontroller Pic 18f4520 itself allows this maximum control adjustment, once programmed the conversion variable. Thus, it was possible a gain adjustment that allowed a value adjustment by comparison with the adopted standard. Using an operational amplifier model, LM741, which can be seen its schematic diagram in Figure 7 and to evidence the reading values, was adopted the LCD display model 16×2, which in the first line is referenced the parameter in analysis and in the second line Lower the Read value is identified, this HMI system has three menus which can be varied through two one-step buttons and another returns.
Figure 7: Conductivity sensor plate.
After programming, reading tests were performed at some collection points. Both were satisfactory for the proposed objective that was to control and monitor a reverse osmosis system through a water conductivity sensor.
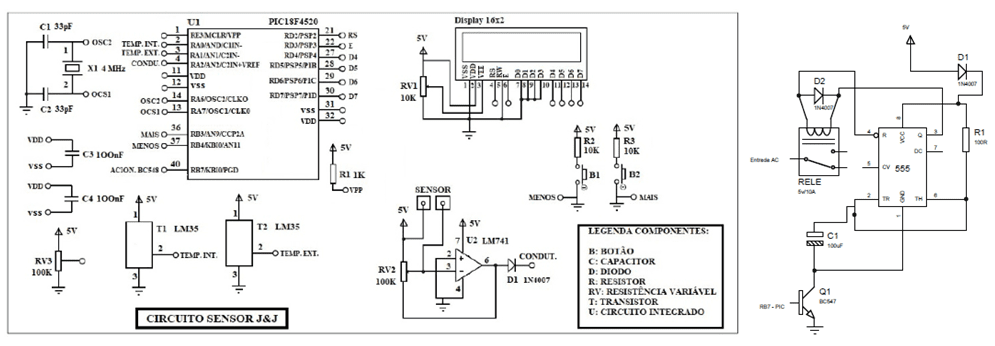
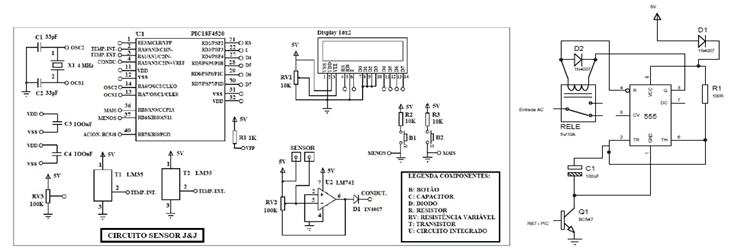
In Figure 8 It is possible to check the schematic diagram of the prototype with the appropriate components.
Figure 8: Schematic diagram.
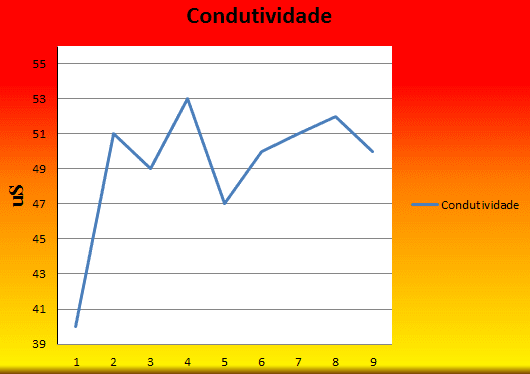
To show the results, a test was carried out to demonstrate the functioning of the conductivity sensor. The values displayed on the LCD display were annotated in Table 2 and a graph was developed with the information in Figure 9.
Table 2 – Sensor conductivity test data.
| ΜS value | Time min. |
| 40 | 1 |
| 51 | 2 |
| 49 | 3 |
| 53 | 4 |
| 47 | 5 |
| 50 | 6 |
| 51 | 7 |
| 52 | 8 |
| 50 | 9 |
Source: authors, 2018.
During the conductivity test the sensor showed little variation within the maximum control value 55, Μs. The values were recorded at 1-minute intervals in the 9-minute period.
Figure 9: Test graph with conductivity sensor.
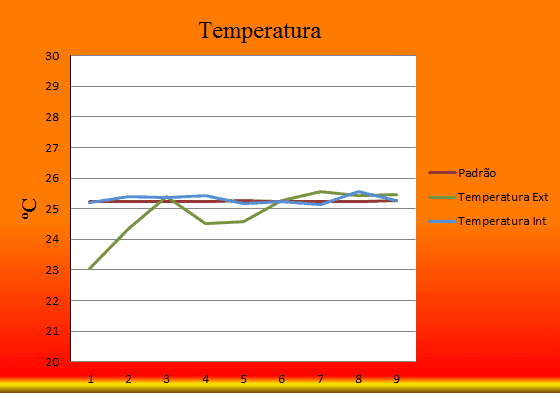
In Figure 10, it was possible to visualize the temperature values of the internal, external LM35 sensors and the standard sensor used (thermocouple type T).
Figure 10: Test graph with temperature sensors.
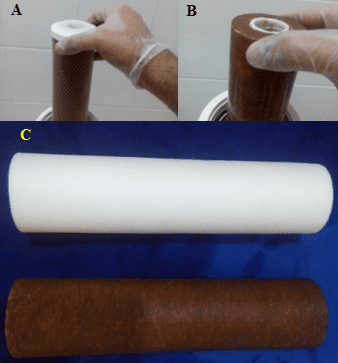
After a certain time of use it is necessary to perform the exchange of reverse osmosis filters. This time is established through studies of results obtained in this exchange being the first the visual as to the conditions of this filter and another medium is through analysis of water conductivity values. In Figure 11, it features an activated carbon filter and a 5 Μ filter. At the time of exchange after one month of use and a comparison with a filter 5 µs in use. This justifies the importance of the conductivity sensor for the control of demineralized water, since this contamination was arrived at the Demineralized water reservoir would have contaminated the line, impregnated the pipe damaging the machine and Final product.
Figure 11: A – Charcoal filter, B – Filter 5 Μ, C – Comparison of the filter before and after the exchange. Source: authors, 2018.
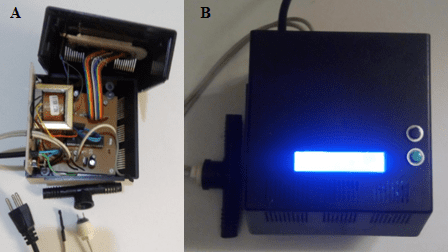
For osmosis control was installed a cable with a 10a outlet that has the voltage supply interrupted when the system detects a conductivity superior to the programmed that is 00.55 µs. As shown in Figure 8, to power this socket, the system waits 10 seconds to start its operation in order to prevent a turn-off oscillation from occurring, i.e. the system waits 10 seconds each time the power supply is interrupted. Base of the transistor BC 547. Opino RB7 of the PIC-18F4520 microcontroller is responsible for this keying. The system also has a fuse protection at the entrance. In Figure 12 it is possible to visualize the finished prototype with the conductivity and internal temperature sensor.
Figure 12: A – Internal part of the prototype, B – external part of the prototype.
CONCLUSION
The osmosis monitoring system demonstrates in a methodological way the creation of a reliable system according to the study and application of the content. The prototype was applied to readings of quantities cited in article. In a manner that presents context damage, the prototype assures the proposed objectives. However, improvements can leave the device with more information about the water to be demineralized, the quantity of products to be used, the prediction of exchange of filters, communication between the HMI and supervisory systems.
This product by which it is being demonstrated clearly evidences how any system can be improved, the J&J sensor has technical capability and specifies to please both the buyer and the user. Its market value is totally within the sales standards as a component table of easy acquisition, demonstrated its simple use as seen in its operation.
For the process by which the prototype was appropriate is a new model strategy where everything will be visible to the user since what is happening in the system according to standards and until its shutdown for possible errors of procedures with indicators. For its modeling is able to be installed in places of easy access and its visible reading will please anyone who uses the J&J sensor. Because of what has been commented, it is the question that our prototype can be used for several structures, where the same was Tested in high flows without variations, but for the principle of activity the same resulted in excellent values with low flows.
By observing the aspects analyzed graphically, it is understood that the response of the conductivity sensor presented is very appropriate, due to its low variation and reliably of its use, since also the temperature analysis, compared with A standard where the sensor has recorded minimal variations compared to other equipment.
Conclusion-Dry the results were significant and effective. This way the J&J sensor can be used reliably.
BIBLIOGRAPHICAL REFERENCES
Bega, Alberto Egídio; Delmée, Gerard Jean; Cohn, Pedro Estéfano; , Roberto , Ricardo; Finkel, Vitor Schmidt. Industrial Instrumentation. 3rd edition Rio de Janeiro: publisher, Interciência,2011.
Carano, Francisco Gabriel; MARINO, Aparecida Mendes. Electrical and Electronics Lab. 24th Edition – São Paulo: Editora Érica, 2013.
Fernande, Alexandre. The measurement of ph and conductivity, Sanepar 2013. Available in <https: www.gehaka.com.br/downloads/apresentacao_sanepar.pdf="">.</https:> Access: March 31, 2018.
Majop, products for swine farming. Reverse Osmosis – Learn about this water purification process. September 2011. Available at <http: www.majop.com.br/artigo%20t%c3%89cni.o%20osmose%20reversa%20entenda%20o%20seu%20funcionamento%20.pdf="">(Access: 18/05, 2018).</http:>
Miyadaira, Alberto Noboru. Microcontrollers PIC18 learn and schedule in Language C. 1st edition São Paulo: Editora, Erica, 2014.
Nise, S. Norman. Sisrtheme Engineering Control. 6th edition Rio de Janeiro: Editora, LTC, 2012.
Ogata, Katsuhiko. Modern control engineering. 5th edition São Paulo: Editora, Pearson, 2010.
OLIVEIRA, André shneider de. Control and automation. 1st edition – Curitiba: Editora LT, 2012.
RAMALHO, Sérgio Manoel Cordeiro. Conductivity Sensor with signal conditioning. October 2019. Available in <https: fenix.tecnico.ulisboa.pt/downloadfile/395139408909/dissertacaosensorcondutividadeversaofinal.pdf="">.</https:> Accessed on 25 May 2018.
Santos, Ana; SOUZA, Robson Oliveira. Electrical conductivity and acidification of water used in herbicide application in RIO Grande DO SUL. November 1998. Available in< http://www.scielo.br/pdf/cr/v30n1/a16v30n1.pdf="">. Accessed May 01, 2018.
Splabor. Conductivity unit of measurement that determines the electrical potential of a sample. December 2012. Available in< http://www.splabor.com.br/blog/?s="condutividade">. Access Em21 March 2018.
VILLAS, Mariana; Mauro. How and why I measured the electrical conductivity with multiparameter probes. Posted on 12/03/2013.
<https: www.agsolve.com.br/noticias/como-e-porque-medir-a-condutividade-eletrica-ce-com-sondas-muiltiparametros="">.</https:> Access: April 13, 2018.
Zanco, Wagner da Silva. Microcontrollers PIC18 with Language C. 1st edition São Paulo: Editora, Erica, 2010
Annex I
Figure 13: Schematic diagram.
[1] He has technical training in electronics, 2010, graduating in electronic engineering from Faculdade Carlos Drummond de Andrade – Tatuapé – SP, has a course of leadership offensive phase I and phase II by VOLVO of Brazil where he started as a geometry technician, promoted to Almoxarife A and head of warehouse, has knowledge and practice in validation and thermal qualification in the area, hospital, pharmaceutical and food industry, currently works with clinical engineering by the company Formedical
[2] Graduated in electronic engineering from the faculty Carlos Drummond de Andrade – Tatuapé – SP, has technical course in medical equipment, technicians in electronics, resides in the state of currently works with clinical engineering
[3] Professor Master Advisor, of the undergraduate courses in electronic engineering and Industrial Automation at Faculdade Carlos Drummond de Andrade – Tatuapé – SP, graduated in electrical engineering from the Federal University of Juiz de Fora (1977). Master's degree in electrical engineering from the Federal University of ABC.
[4] Coordinator of undergraduate courses in electronic engineering and Industrial Automation at Faculdade Carlos Drummond de Andrade – Tatuapé – SP