ORIGINAL ARTICLE
MACHADO, Guilherme Isaias Debom [1], VARGAS, Fabian Luis [2], COSTA, Celso Maciel da [3]
MACHADO, Guilherme Isaias Debom. VARGAS, Fabian Luis. COSTA, Celso Maciel da. Analysing extreme value theory efficiency in probabilistic wcet estimation with block maxima. Revista Científica Multidisciplinar Núcleo do Conhecimento. Year 05, Ed. 12, Vol. 18, pp. 131-154. December 2020. ISSN:2448-0959, Access link in: https://www.nucleodoconhecimento.com.br/electrical-engineering/block-maxima, DOI: 10.32749/nucleodoconhecimento.com.br/electrical-engineering/block-maxima
SUMMARY
The execution time is a requirement as much important as the computed result when designing real-time systems for critical applications. It is imperative to know the possible execution times, especially when some system delay may incur in equipment damages or even in crew injuries. With that in mind, the current work analyzes different techniques to define the Probabilistic Worst Case Execution Time (pWCET) using the Extreme Value Theory (EVT). Since probabilistic methodologies have been widely explored, this study aims to assure how accurate the pWCET estimations are when applying EVT knowledge. This analysis aims to compare system pWCET estimations to this real behavior, predicting the upper bound execution limits of two algorithms on MIPS processor. Further, this work regards the Block Maxima technique, which select the highest measured values to define a probabilistic distribution that represents the analyzed system. Based on the outcomes the Block Maxima technique points some limitations as requiring a large number of samples to get a reliable analysis. The obtained results have shown that EVT is a useful and trustworthy technique to define pWCET estimations.
Keywords: Extreme Value Theory, EVT, Probabilistic Worst Case Execution Time, pWCET, Block Maxima.
1. INTRODUCTION
Developing computational systems requires predictability about the environment and system operation. For several applications, execution time is an imperative requirement to ensure execution accuracy and reliability. Delays in aerospace systems, for instance, might jeopardize the equipment integrity as well as crew safety.
Worst Case Execution Time (WCET) is an important parameter, in order to ensure accuracy under critical conditions. Knowing the WCET allows the system to act in acceptable time for all execution possibilities.
Nevertheless, system complexity might jeopardize the process to find the WCET. Predicting all execution cases in intricate systems increase design time and the cost. Several hardware components, such as cache memory, have random behavior, which vary the execution time for each execution case.
Alternatively, it is possible to find, empirically, the execution time probability as for different executions cases and set a probability distribution of the system. Then, it is possible to estimate the probabilistic Worst Case Execution Time (pWCET) using that distribution and defining the worst scenario for some low enough probability.
Gil et al (2017) have shown the open challenges regarding the pWCET definition. Having a more critical view on the state of art of the current literature, this paper points out theoretical problems about Extreme Value Theory (EVT) application vulnerability, such as sample set representativeness and the software and hardware characteristics correlation with some minimal sample amount for correct (i.e., trustful) analysis.
Lima; Bate (2017) have proposed the Indirect Estimation in Statistical Time Analysis (IESTA) technique, which relies on hardware randomization to compensate system’s intrinsic uncertainties. This approach aims at trying to solve system uncertainty issues. However, it disregards uncertainties in pWCET definition technique.
Starting from this point, the proposed work analyzes the EVT efficiency to estimate pWCET for critical real-time systems as compared against simulation of a softcore processor widely used for space applications. The objective is to discover EVT limitations and to correlate EVT and systems characteristics with the analysis of the outcome uncertainty.
EVT is based on statistic and probabilistic knowledge and literature has a lack of works evaluating the accuracy of this technique when applied to real-time systems. EVT is widely used in Hydrology and earth science, for instance.
The proposed work considered two algorithms to first statically define the WCET and then, empirically collect execution times by simulating the system. Once EVT uses the collected samples to define the pWCET, the efficiency and reliability of this technique is tightly dependent on how it collects and analyze the sample, in order to determine the pWCET.
2. THE WORST CASE EXECUTION TIME
The program WCET is the time upper bound to execute the program code in a specific processor. WCET is essential to real time system schedulability analysis and time warranty, especially on hard real time systems (STARKE, 2012). However, the instructions execution time is no longer constant though.
Abella et al. (2014) classified some methods to find WCET into three different approaches: Static Deterministic Timing Analysis (SDTA), Static Probabilistic Timing Analysis (SPTA) and Measurement-Based Probabilistic Timing Analysis (MBPTA).
2.1 STATIC DETERMINISTIC TIMING ANALYSIS
Static Deterministic Timing Analysis (SDTA) employs a detailed system model to derive a safe WCET upper bound (WILHELM et al., 2008). SDTA techniques demand a hardware structural knowledge. Cache analysis, for instance, requires a placement and replacement function expertise.
The Static Analysis dismisses task execution or its simulation on hardware. Static Analysis regards all possible executions path in the task code. Then, it constructs a Control Flow Graph (CFG) to describe those paths. After code analysis, SDTA determines (for all iterations upper bounds of loops in the graph) the longest (i.e., the most time consuming) path of the graph to find the WCET.
2.2 STATIC PROBABILISTIC TIMING ANALYSIS
The Analytic Method, also called Static Probabilistic Timing Analysis (SPTA), is applicable when a system component or the environment affect the random behavior or time probability. For instance, a random cache replacement (ABELLA et al., 2014). Cucu-grosjean et al. (2012) explain that SPTA derives system model probabilities. Nevertheless, this method requires a considerable information amount about execution behavior, even reducing the required information about program and platform.
SPTA method analyses software in structural level and instruction level and uses a hardware behavior model to estimate the worst-case time behavior in a pWCET distribution. This distribution may contain cases for all possible input data, software and hardware states and executions paths in code. Therefore, SPTA does not execute the real hardware and, due to that, it depends largely on the hardware model accuracy. Abella et. al. (2014) affirm that SPTA is not totally able to analyze multi-path programs and it is more pessimistic than the measure based method.
2.3 MEASURED BASED TIMING ANALYSIS
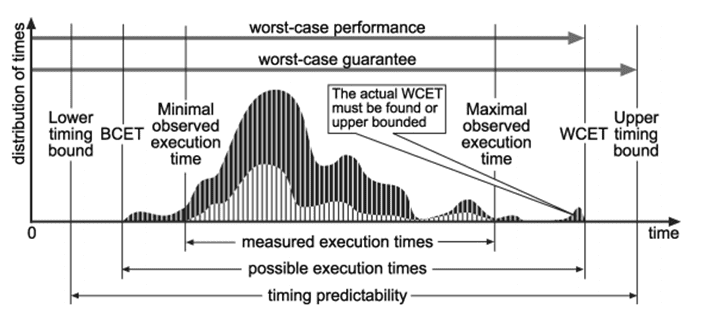
According to Wilhelm et al. (2008) Measured Based Timing Analysis (MBTA) simulates or executes basic blocks code in hardware. The basic blocks are tasks code or tasks code snippets and every simulation or execution time is measured. Vary input data allow to cover all the execution paths and discover the worst case. MBTA defines the Best Case Execution Time (BCET) as the shortest execution time measured while the WCET is the longest execution time measured one. Besides that, the measured time during a unique execution is considered a sample. Every measured sample compounds an occurrence distribution, which in turn allows one to find the respective execution time occurrence probability.
Figure 1 depicts an MBTA example. The distribution depicts the occurrence number of each execution time. The white distribution describes a single case samples occurrence, all samples considering the same input data. The dark distribution describes all cases occurrences, considering all samples.
Figure 1. Example of a Measured Based Time Analysis.
3. THE PROBABILISTIC WORST-CASE EXECUTION TIME
Gil et al. (2017) affirms that Static Analysis is unpractical for complex hardware components. On the other hand, MBTA finds a WCET but not necessarily the true worst-case execution time. The Probabilistic Worst Case Execution Time (pWCET) intends to solve this MBTA problem.
The probabilistic Execution Time (pET) is a Probabilistic Distribution Function, which describes the execution time probability to a given system. Figure 2 shows a Distribution pET example. Figure 3 depicts a Cumulative Distribution Function (CDF), which is a cumulative sum of PDF function.
Figure 2. System Execution Time PDF.
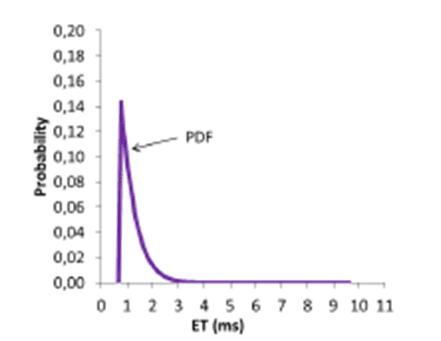
Figure 3. CDF and 1 – CDF.
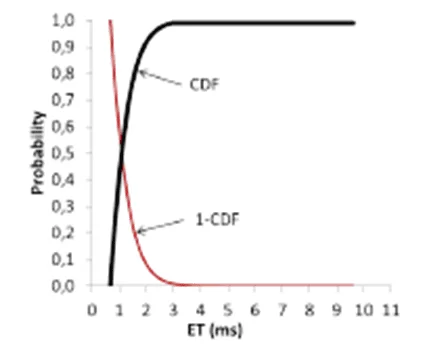
With pET, it is possible to find some probability p for a given time value t. Furthermore, it is possible to relate WCET information to pET distribution and to define the probabilistic Worst Case Execution Time (pWCET). For instance, it was observed that the system consumes until 2ms to run around 90% of all possibilities of a give code (Figure 3). The probability increases to 99% of the samples considering 3ms. In this example, one can consider to have found the WCET (i.e., the pWCET) equal to 2ms (with a probability of 90%) and equal to 3ms (with a probability of 99%).
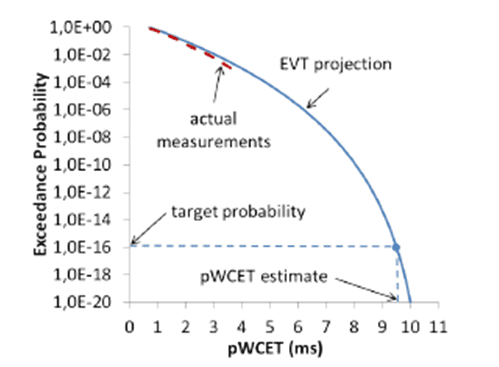
From this reasoning, an empirical probability distribution with all measured execution times must be compound in order to find the pWCET. From this empirical distribution, it is possible to define an Empirical Cumulative Distribution Function (ECDF). Extreme Value Theory (EVT) compares ECDF to an existing probability function (i.e., a statistical model that better fits the “1 – CDF” curve). In other words, the pWCET parameter is the worst-case execution time for a given probability threshold (Davis, Burns and Griffin, 2017). Figure 4 shows the example of a pWCET estimative for the probability of p = 10-16.
Figure 4. pWCET estimative example (p = 10-16).
4. EXTREME VALUE THEORY
EVT is a mathematical method to estimate the extreme values probability of known rare events (EDGAR; BURNS, 2001). This technique results in the maximal (or minimal) distribution function values of n samples collected and modelled with random variables. The EVT method is similar to Central Limit Theory, but estimating the extremes instead of the average.
To define pWCET is imperative to collect the system execution time samples. Gil et al. (2017) claim that the process objective is to analyze the extremes samples (maximum). There are two techniques to select the extremes samples, a Block Maxima (BM) selection or just picking all the samples higher than a defined threshold, Peak-over-threshold (POT) technique.
Single-path programs has a code with only one possible execution path. Applying EVT in that code is useful to measure time variation in hardware response, since the execution code is always the same. Cucu-grosjean et al. (2012) described the steps to apply EVT in single-path programs, in order to obtain a stable result:
- Collect observations: the author initially suggests a sample set with approximately 100 execution times observed. Afterwards, in each round the must be added as the previously described process.
- Grouping: This step may use a technique, as Block Maxima or Peak-Over-Threshold, to convert the measured frequency distribution into a suitable EVT distribution.
- Fitting: It uses the empirical distribution, 1 – ECDF actually, to estimate the GEV distribution; hence, it defines the GEV parameters as the calculation previously described.
- Comparison: It compares, according to CRPS metric, the current round distribution to the previous round.
- Converge: If the difference between distributions does not reach a given threshold, as defined by CRPS metrics, the process starts a new round at step 1. Otherwise, to consider the distribution converged, it is necessary to collect more samples doing a few more rounds; the author suggests five consecutive rounds in this step.
- Tail extension: this step defines the final GEV parameter values for probabilities under the threshold.
Several fields apply EVT nowadays, such as engineering, financial, earth science and traffic predict. Hydrology, for instance, applies EVT to estimate an abnormal flooding event probability, e.g., defining the maximum flow rate which a given flow gate must support. Estimated pWCET is commonly associated to a desired probability threshold. Applying EVT to predict upper bound limits of complex processors projects might require lower costs than applying static methods (SILVA; ARCARO; OLIVEIRA, 2017).
Lima and Bate (2017) define EVT generically in four steps. (a) Collect a desired random variable (or r.v.) samples. (b) Select the maximum samples in a. (c) Find a statistical model to fit the selected samples in b. (d) Validate the model. Then (e) determine an upper limit (probability threshold) based on the model found in c since that model was validated in d.
Lima; Dias and Barros (2016) presented a technique to observe how much the EVT distribution fits on the ECDF: the quantile-quantile graph (QQ-plot). It is, essentially speaking, a plot of the empirical quantile observed values against the target distribution quantiles. This graph shows a distribution quantiles in one axis, while it similarly shows the compared distribution quantiles in the other axis. So if those distributions are equal, the graph will show a straight line, like x = y. Figure 5 shows a quantile-quantile graph example, in which the x axis shows the model quantiles while the y axis shows the empirical quantiles.
Figure 5. Quantile-quantile graph example.
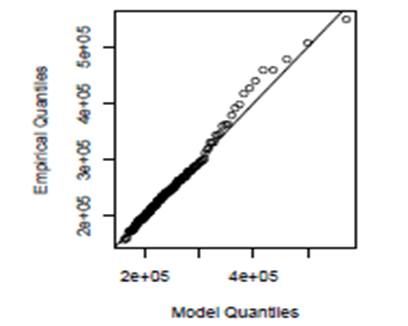
Some scenarios may require a higher samples number to analyze or different block number and/or block size to fit the model. In this case, the only constraints are the spending time and the costs to collect all the measured execution time (LIMA; DIAS; BARROS, 2016).
5. BLOCK MAXIMA APPROACH
The EVT initial objective is to collect the proper values that compound the distribution tail of the system behavior model and fit this model into a GEV distribution. After collecting samples, in Block Maxima approach, EVT groups all samples into blocks of equal sizes and then, selects the maximum value of each block. Then, it creates a maxima block with the maximum values of all the blocks. Alternatively, EVT may select more than one maximum sample value per block, by picking up all the samples above a given arbitrarily defined threshold (CUCU-GROSJEAN et al., 2012).
The maximum values selection affects EVT outcomes directly as far as the total observations number. Regarding BM method, the block size might embarrass the distribution fitting. Cucu-grosjean et al. (2012) emphasize that the larger the block size, the better it is to fit the tail. However, the block size is directly correlated to the number of blocks, considering that the total samples number is constant. For instance, 1000 samples may be divided into 10 blocks of 100 samples or into 100 blocks of 10 samples or even into 1 block of 1000 samples. The samples number in final maxima block is exactly suited to the same number of blocks. Therefore, increasing the block size decreases the final maxima block.
Cucu-grosjean et al. (2012) hold the view that the Block Maxima theoretical basis affirms that if some data fits a known CDF, then the maxima block of those data fits the same known CDF.
To apply EVT under BM approach, the maxima block must converge with one of three possible distributions: Gumbel, Weibull or Frechet. There are three parameter do describe those distributions: shape (ξ ), scale (s) and location (m).
The Generalized Extreme Value (GEV) comprehends those three distributions. Using GEV, the shape parameter value indicates which distribution to use. If ξ < 0 the distribution is Weibull, if ξ > 0 the distributions is Frechet and ξ = 0 indicates the distribution Gumbel. Peak-Over-Threshold approach uses the Generalized Pareto Distribution (GPD) instead.
6. METHODOLOGY ANALYSIS
This work analyses the EVT method according to the Block Maxima technique. Since result is statically determined, the approach uses different parameters values such as block size, the number of blocks and number of samples generated for the experiment, in order to identify limitations on the EVT estimation.
Comparing different analysis results of a given algorithm, running it with different input values, and changing EVT parameters values, must evidence the constraints or limitations of EVT application for real-time systems. Therefore, it is possible to point out characteristics that may jeopardize the EVT results for pWCET. The pWCET method efficiency depends on the difference between WCET computed and the WCET obtained by simulation of soft-core processor (assumed as the golden reference). Results with smaller difference are considered more efficient, while results with larger differences suggest less effectiveness of the pWCET method.
It is worthy pointing out that the processor simulation process assumes the number of clock cycles required to execute the algorithm, in order to compute the WCET.
6.1 BUBBLE SORT CASE
The first analyzed context is an ordering vectors algorithm named Bubble Sort. This is a simple algorithm, widely employed in literature. In this case, Bubble Sort must order an eight positions vector. The statically defined WCET is 826 executed instructions.
Since the literature do not specifies the criteria for splitting samples in basic block, in this work it divides samples in basic blocks according the order they were collected. For instance, regarding blocks with 100 samples, the first basic block would contain the 1st to 100th samples.
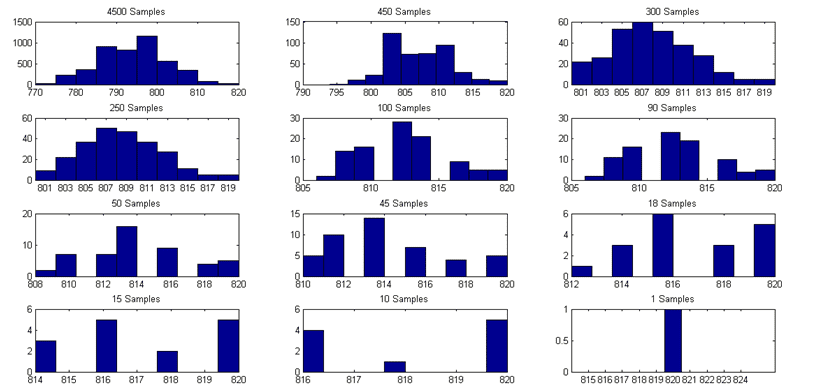
This Block Maxima analysis regards 4500 samples and compares different basic blocks sizes, as the Figure 6 depicts:
Figure 6. Different block sizes for Basic Blocks and Maxima Block.
The first scenario considered basic block as one sample size and, therefore, the maxima block contains all 4500 collected samples. On the other hand, the last one regards a unique basic block, which implies in only one sample for Maxima block: the highest value sample.
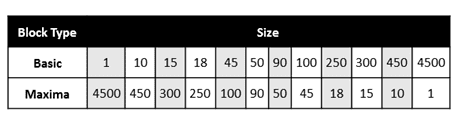
The literature affirms that basic blocks must contain enough samples to represent the execution behavior properly. Figure 7 shows maxima blocks histograms for different maxima block sizes.
Figure 7. Maxima block histograms.
Analyzing histograms is possible to realize how the maxima block representability decrease as the samples number becomes lower. From 90 samples to below, the histograms seem describing a completely different system than those with more than 90 samples. The pWCET outcome analysis must count on this characteristic.
Defining EVT distribution requires the parameters values only, thereafter it can compare the defined distribution and the ECDF defined empirically. Figure 8 displays the quantile-quantile plots for different maxima block sizes.
Figure 8. Maxima block quantile-quantile plots.
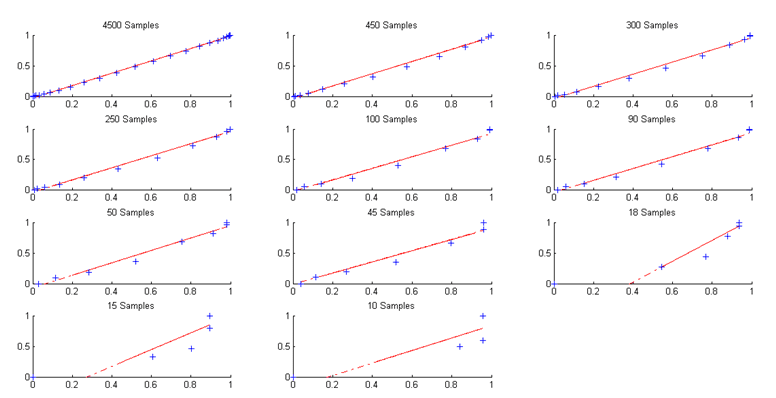
Similarly to histograms, the quantile-quantile plots points that fitting the empirical and the EVT distributions is harder as long as the number of samples in maxima block is lower. It is important to enhance that it is not even possible to define a distribution for a unique value, as the one sample maxima block case.
Finally, Table I shows the pWCET outcome for each maxima block case. The probability threshold value is 10-3 and the statically defined WCET is 826.
Table I. Bubble Sort on Block Maxima approach.
| Maxima Block Size | pWCET(10-3) | WCET | Difference |
| 4500 | 818 | 826 | 8 |
| 450 | 822 | 826 | 4 |
| 300 | 823 | 826 | 3 |
| 250 | 823 | 826 | 3 |
| 100 | 824 | 826 | 2 |
| 90 | 824 | 826 | 2 |
| 50 | 823 | 826 | 3 |
| 45 | 826 | 826 | 0 |
| 18 | 820 | 826 | 6 |
| 15 | 820 | 826 | 6 |
| 10 | 820 | 826 | 6 |
| 1 | 820 | 826 | 6 |
According to the pWCET results, the higher difference between the WCET and the outcome occurs for 4500 samples. This difference decrease as long as the sample number decreases. For 45 samples the difference is zero, the found pWCET value is equal to the WCET one. The outcome below 45 samples are clearly inconsistent.
It is important to point that according to histograms and quantile-quantile plots, maxima blocks with less than 90 samples the requirements described on literature are not satisfied. On the other hand, filtering no maximum sample, like the 4500 case, also affect the outcome. Since the 4500 maxima block has the higher difference between the statically WCET and the probabilistic one.
Considering the outcome values and the maxima block analysis, it is possible to deduce that the best results comes regarding 300 to 90 samples in analysis. In other words, regarding 2% to 7% of the total samples in EVT analysis with maxima block approach increase the outcome accuracy.
6.2 FINITE IMPULSE RESPONSE FILTER CASE
Other algorithm regarded in this work is the FIR Filter, commonly employed in digital filters. This algorithm receives two parameters. The number of samples and the filter order. The first variable may assume values from 1 to 64, whereas the second variable may assume only the even values from 1 to 64 (32 different values). Considering the possible values each variable can assume, there are 32×64 possible cases, which means 2048 different cases. The WCET statically defined for this algorithm is 59223 executed instructions.
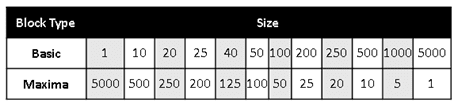
This Block Maxima analysis regards two different scenarios. The scenario A considers all possible results and each outcome is unique since it does not repeat the algorithm input values. The scenarios B collects samples disregarding the input parameters repetition. There are 2048 samples for scenario A (Figure 9) and 5000 samples for scenario B (Figure 10):
Figure 9. Different block sizes for Basic Blocks and Maxima Block (A).
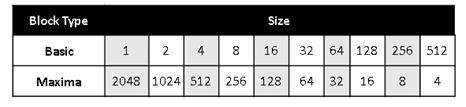
Figure 10. Different block sizes for Basic Blocks and Maxima Block (B).
Literature claims that basic blocks must contain enough samples to represent the execution behavior properly. Figure 11 and Figure 12 show histograms for maxima blocks with different sizes.
Figure 11. Maxima blocks histograms (A).
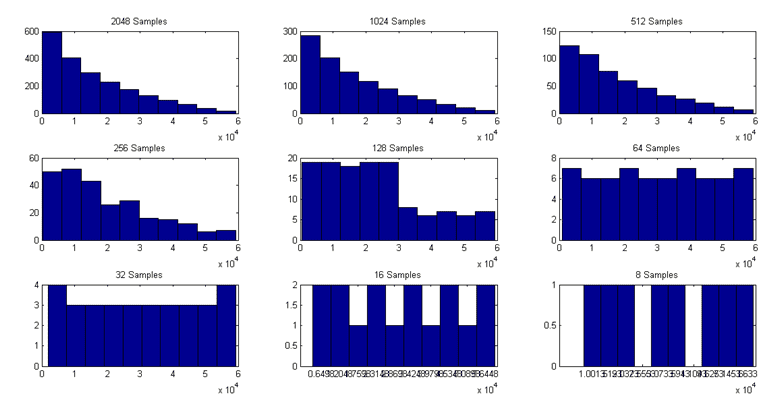
According to these histograms, the maxima block representability decrease as the samples number becomes lower. From 128 samples to below, the histograms do not represent the execution behavior properly, since it has less information. For this reason, the image disregard the histogram related to the maxima block with four samples. These histograms characteristics likely affect the pWCET outcome.
Figure 12. Maxima blocks histograms (B).
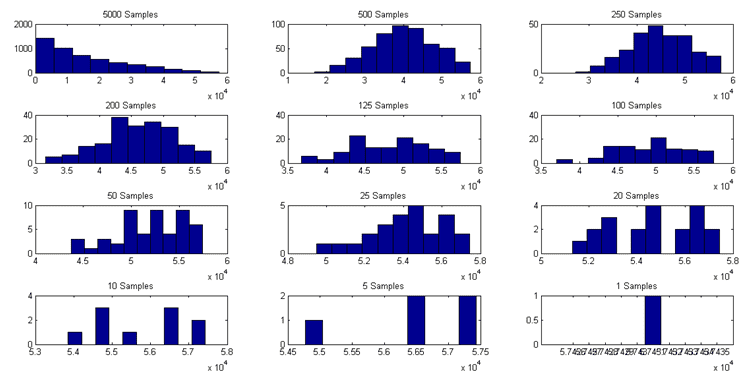
Similarly, to the histograms in last image, the maxima block representability decreases when regarding less samples. On the other hand, unlike the scenario A, from 125 samples to below, the histograms do not represent the execution behavior properly, since it has less information. These histograms characteristics likely affect the pWCET outcome.
Although EVT distribution requires only these parameters values on its definition, comparing the defined distribution and the ECDF (empirically defined) might be useful to observe how these distributions fit. Figure 13 and Figure 14 depict the quantile-quantile plots for different maxima block sizes regarding A and B.
Figure 13. Maxima block quantile-quantile plots (A).
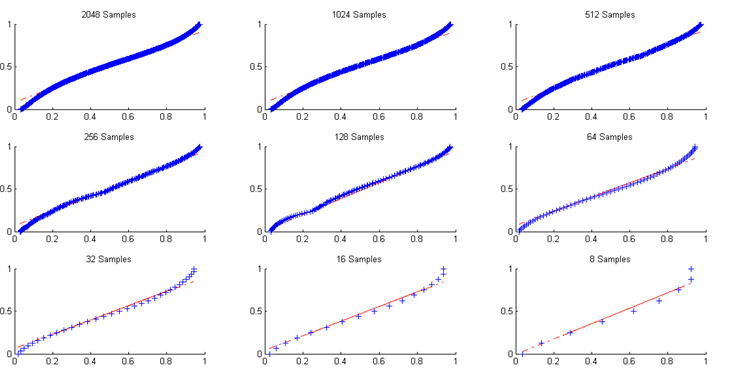
The image shows a similar behavior in almost every Maxima block, B does not presents the same linearity according to Figure 14.
Figure 14. Maxima block quantile-quantile plots (B).
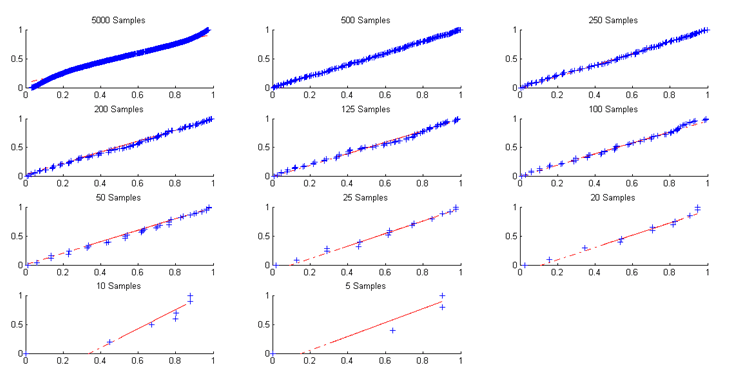
Like histograms, the quantile-quantile plots points that regarding a lower number of samples in maxima block affect analysis. In this case, it influences how the empirical and the EVT distributions fit with small samples amount. It is important to enhance that it is not even possible to define a distribution for a unique value, as the one sample maxima block case.
Decreasing the number of samples in maxima block increases considerably the distributions differences. Regarding A, the lowest difference is 0.041, which occurs when Maxima block has 128 samples collected from 128 basic blocks, each basic block have 16 samples. Comparing all maxima block sizes in this scenario, 128 seems ideal.
Besides that, differences in scenario B does not seems linear. Although, the lowest difference value is 0.026, when Maxima has 500 samples collected from 500 basic blocks, each basic block having 10 samples.
It is worthy to enhance that the better options for this scenarios according to this work are the following Maxima block sizes: 128, 200 and 250 samples. That means the better options have the following basic blocks size: 10, 16 and 20 samples.
Finally, Table II and Table III show the pWCET outcome for each maxima case. The probability threshold value is 10-3 and the statically defined WCET is 59223.
Table II. FIR Filter on Block Maxima approach, scenario A.
| Maxima Block Size | pWCET(10-3) | WCET | Difference |
| 2048 | 225527 | 59223 | 166304 |
| 1024 | 210630 | 59223 | 151407 |
| 512 | 184534 | 59223 | 125311 |
| 256 | 146892 | 59223 | 87669 |
| 128 | 107117 | 59223 | 47894 |
| 64 | 64277 | 59223 | 5054 |
| 32 | 64647 | 59223 | 5424 |
| 16 | 65196 | 59223 | 5973 |
| 8 | 65429 | 59223 | 6206 |
| 4 | 59220 | 59223 | 3 |
According to Table II, as larger the maxima block, the worse the pWCET estimation is. The difference between the pWCET(10-3) and the static WCET is 166304 for 2048 samples. On the other hand, when Maxima block has only four samples, the difference is 3. In addition, it is important to point that Gevfit function returned an error message for the Maxima with four samples (Table VI). Thus, the lowest outcome difference is 5054 and occurs for 64 samples.
The histogram comparison (Figure 11) shows that maxima blocks represents the algorithm execution behavior when having 128 samples or more. Regarding this assumption, the best outcome difference is 47894, for 168 samples. Table VIII also shows that 168 samples have the best fitting between the EVT defined distribution and the empirical one, the maximal difference is 0.041 and the average difference is 0.019. When comparing the 64 samples case, the maximal difference is 75.6% higher and the average difference is 94.7% higher than 128 samples case. Therefore, different analysis pointed the 128 samples case as more reliable and assured. However, the EVT results pointed the 64 samples as more accurate.
Considering this cases, it is possible to deduce that the best samples amount in Maxima block for this analysis is among 3% and 6% of the total collected samples.
Table III shows the EVT outcomes for scenario B:
Table III. FIR Filter on Block Maxima approach, scenario B.
| Maxima Block Size | pWCET(10-3) | WCET | Difference |
| 5000 | 209131 | 59223 | 149908 |
| 500 | 58547 | 59223 | 676 |
| 250 | 58820 | 59223 | 403 |
| 200 | 58658 | 59223 | 565 |
| 125 | 58608 | 59223 | 615 |
| 100 | 58261 | 59223 | 962 |
| 50 | 57837 | 59223 | 1386 |
| 25 | 57796 | 59223 | 1427 |
| 20 | 57819 | 59223 | 1404 |
| 10 | 57430 | 59223 | 1793 |
| 5 | 57430 | 59223 | 1793 |
| 1 | – | 59223 | – |
According to Table III, the worst outcome occurs for 5000 samples, when the difference between the EVT distribution and the ECDF is 149908. Despite that, the best-obtained result value is 58547, which means a difference of 676, for 500 samples. The difference worsens as the Maxima block has fewer samples.
The histograms analysis (Figure 12) depicts that maxima block represents the algorithm execution behavior with 200 samples or more. Besides that, the Gevfit function returned an error message for 10, 5 and 1 sample (Table VII), so its outcomes might be ignored.
The fitting analysis (Table IX) also pointed the 500 samples case as the best one. The maximal difference is 0.026 and the average difference is around 0.007. The 250 samples case is the second best. However, when comparing it, the maximal difference is 53.8% higher and the average difference is 71.4% higher than the 500 samples case. Thus, all analysis and the EVT outcomes point 500 samples case as more reliable and accurate.
Regarding this cases, by deduction, the best samples amount in Maxima block for this analysis is among 5% and 10% of the total collected samples.
7. CONCLUSIONS
This work analyzes Probabilistic Worst Case Execution Time (pWCET) estimates based on the Extreme Value Theory (EVT) and according to Block Maxima technique, pointing out the process limitations related to that. Two algorithms were used as case studies: Bubble Sort and Fir Filter. In addition, this work considers processor simulation and disregards hardware uncertainty. It uses MIPS architecture processor, single core, to assemble and simulate the selected algorithms.
The number of samples and their empirical distribution affects the probability threshold. For this reason, the study-cases in this works regards the probability of 10-3 and not the standard for avionic systems, 10-9.
The methodology applied the Extreme Value Theory (EVT) in the sample sets following the Block Maxima approach, comparing the outcomes by different input parameters. In Bubble Sort analysis the most reliable and accurate outcomes have a Maxima block with 2% to 7% of the total samples. Besides that, FIR Filter analysis pointed that with 3% to 10% of all samples.
Based on this work EVT is a useful and trustable technique to define pWCET. Block Maxima technique seems easy and reliable since both algorithms had proper outcome values. As limitations, it is worthy to point the large number of samples required to feed a good Maxima Block. Further, this work do not cover limitations regarded to sample ordering when creating basic blocks.
As future work, there are some recommended subjects as assure whether the samples ordering affect Block Maxima technique, compare a larger amount of algorithms and analyze the number of samples and the outcomes reliability.
BIBLIOGRAPHY
ABELLA, Jaume et al. On the Comparison of Deterministic and Probabilistic WCET Estimation Techniques. 2014 26th Euromicro Conference On Real-time Systems, Madrid, Spain, v. 1, n. 26, p.266-275, jul. 2014. IEEE.
BERNAT, Guillem; COLIN, Antoine; PETTERS, Stefan M.. WCET analysis of probabilistic hard real-time systems. 23rd Ieee Real-time Systems Symposium, 2002. Rtss 2002., Austin, Texas, Usa, p.1-10, dez. 2002. IEEE Comput. Soc.
BRADLEY., James Vandiver. Distribution-free statistical tests. Englewood Cliffs, N.j: Prentice-hall, 1968. 388 p.
BUTTAZZO, Giorgio C.. Hard Real-Time Computing Systems: Predictable Scheduling Algorithms and Applications. Pisa: Kluwer Academic Publishers, 2011. 524 p.
CAZORLA, Francisco J. et al. PROARTIS: Probabilistically Analysable Real-Time Systems. Acm Transactions On Embedded Computing Systems, New York, Ny, Usa, v. 12, n. 2, p.1-26, 1 maio 2013. Association for Computing Machinery (ACM). http://dx.doi.org/10.1145/2465787.2465796.
CAZORLA, Francisco J. et al. Upper-bounding Program Execution Time with Extreme Value Theory. 13th International Workshop On Worst-case Execution Time Analysis (wcet 2013)., Germany, p.64-76, jul. 2013.
COSTA, Celso Maciel da. Sistemas Operacionais – Programação concorrente com Pthreads. Porto Alegre: Edipucrs, 2010. 212 p.
CUCU-GROSJEAN, Liliana et al. Measurement-Based Probabilistic Timing Analysis for Multi-path Programs. 2012 24th Euromicro Conference On Real-time Systems, [s.l.], p.1-11, jul. 2012. IEEE. http://dx.doi.org/10.1109/ecrts.2012.31
DAVIS, Robert I.; BURNS, Alan; GRIFFIN, David. On the Meaning of pWCET Distributions and their use in Schedulability Analysis. Rtops – Real-time Scheduling Open Problems Seminar. Dubrovnik, Croácia, p. 1-4. 27 jun. 2017. Disponível em: <http://www.cister.isep.ipp.pt/rtsops2017/RTSOPS17_proceedings.pdf>. Acesso em: 04 nov. 2018.
EDGAR, S.; BURNS, A.. Statistical analysis of WCET for scheduling. Proceedings 22nd Ieee Real-time Systems Symposium (rtss 2001) (cat. No.01pr1420), London, Uk, v. 22, n. 1, p.215-224, dez. 2001. IEEE Comput. Soc.
GIL, Samuel Jimenez et al. Open Challenges for Probabilistic Measurement-Based Worst-Case Execution Time. Ieee Embedded Systems Letters, [s.l.], v. 9, n. 3, p.69-72, set. 2017. Institute of Electrical and Electronics Engineers (IEEE). http://dx.doi.org/10.1109/les.2017.2712858.
GRIFFIN, David; BURNS, Alan. Realism in Statistical Analysis of Worst Case Execution Times. 10th International Workshop On Worst-case Execution Time Analysis (wcet 2010), Dagstuhl, Germany, v. 15, n. 1, p.44-53, jul. 2010.
KOSMIDIS, Leonidas et al. PUB: Path Upper-Bounding for Measurement-Based Probabilistic Timing Analysis. 2014 26th Euromicro Conference On Real-time Systems, Madrid, Spain, p.1-12, jul. 2014. IEEE. http://dx.doi.org/10.1109/ecrts.2014.34.
LIMA, George; BATE, Iain. Valid Application of EVT in Timing Analysis by Randomising Execution Time Measurements. 2017 Ieee Real-time And Embedded Technology And Applications Symposium (rtas), [s.l.], p.187-197, abr. 2017. IEEE. http://dx.doi.org/10.1109/rtas.2017.17.
LIMA, George; DIAS, Dario; BARROS, Edna. Extreme Value Theory for Estimating Task Execution Time Bounds: A Careful Look. 2016 28th Euromicro Conference On Real-time Systems (ecrts), [s.l.], p.1-12, jul. 2016. IEEE. http://dx.doi.org/10.1109/ecrts.2016.20.
MISSOURI STATE UNIVERSITY (Missouri). Mars: MIPS Assembler and Runtime Simulator. Disponível em: <https://courses.missouristate.edu/KenVollmar/mars/>. Acesso em: 15 fev. 2020.
OLIVEIRA, B.; SANTOS, M. M.; DESCHAMPS, F. Cálculo do tempo de execução de Códigos no Pior Caso (WCET) em aplicações de tempo real: um estudo de caso. Revista Eletrônica de Sistemas de Informação, v. 5, n. 1, p. 1-10, 2006.
OLIVEIRA, Rômulo Silva de; FRAGA, Joni da Silva; FARINES, Jean-marie. Sistemas de Tempo Real. Florianópolis: Ufsc, 2000.
PAOLIERI, Marco et al. Hardware support for WCET analysis of hard real-time multicore systems. Proceedings Of The 36th Annual International Symposium On Computer Architecture – Isca ’09, Austin, Tx, Usa, v. 36, n. 9, p.57-68, jun. 2009. ACM Press.
SHAW, Alan C.. Sistemas e Software de Tempo Real. São Paulo: Bookman, 2003.
SILVA, Karila Palma; ARCARO, Luis Fernando; OLIVEIRA, Romulo Silva de. On Using GEV or Gumbel Models When Applying EVT for Probabilistic WCET Estimation. 2017 Ieee Real-time Systems Symposium (rtss), [s.l.], p.220-230, dez. 2017. IEEE. http://dx.doi.org/10.1109/rtss.2017.00028.
STARKE, Renan Augusto. UMA ABORDAGEM DE ESCALONAMENTO HETEROGÊNEO PREEMPTIVO E NÃO PREEMPTIVO PARA SISTEMAS DE TEMPO REAL COM GARANTIA EM MULTIPROCESSADORES. 2012. 200 f. Dissertação (Mestrado) – Curso de Pós-Graduação em Engenharia de Automação e Sistemas, Universidade Federal de Santa Catarina, Florianópolis, 2012.
THEILING, Henrik; FERDINAND, Christian; WILHELM, Reinhard. Fast and Precise WCET Prediction by Separated Cache and Path Analyses. Real-time Systems, [s.l.], v. 18, n. 2/3, p.157-179, abr. 2000. Springer Nature. http://dx.doi.org/10.1023/a:1008141130870.
VARGAS, Fabian; GREEN, Bruno. Preliminaries on a Hardware-Based Approach to Support Mixed-Critical Workload Execution in Multicore Processors. In: SECOND INTERNATIONAL CONFERENCE ON ADVANCES IN COMPUTING, CONTROL AND NETWORKING, 2., 2015, Bangkok, Thailand. Second International Conference on Advances In Computing, Control And Networking. Bangkok: IRED, 2015. p. 23 – 27.
WILHELM, Reinhard et al. The worst-case execution-time problem—overview of methods and survey of tools. Tecs, [s.l.], v. 7, n. 3, p.1-53, 1 abr. 2008. Association for Computing Machinery (ACM). http://dx.doi.org/10.1145/1347375.1347389.
ZICCARDI, Marco et al. EPC: Extended Path Coverage for Measurement-Based Probabilistic Timing Analysis. 2015 Ieee Real-time Systems Symposium, San Antonio, Tx, Usa, v. 1, n. 1, p.338-349, dez. 2015. IEEE. http://dx.doi.org/10.1109/rtss.2015.39.
[1] Master’s student in Electrical Engineering, graduated in Computer Engineering.
[2] Ph.D. Degree in Microelectronics from the Institut National Polytechnique de Grenoble (INPG).Researcher of the Brazilian National Science Foundation (CNPq).
[3] Professor at State University of Rio Grande do Sul (Uergs), Porto Alegre, Brazil.
Submitted: December, 2020.
Approved: December, 2020.