GUIMARÃES, Valéria Aparecida [1]
LARA, Alexander Prado [2]
PUTTINI, Ricardo Staciarini [3]
GUIMARÃES, Valéria Aparecida; LARA, Alexander Prado; PUTTINI, Ricardo Staciarini. Application of Points Analysis by Function in SOA Projects. Multidisciplinary Scientific Journal. Edition 08. Year 02, Vol. 01. pp. 88-102, November 2017. ISSN:2448-0959
summary
Estimating the size of software to be development is indispensable for obtaining a reliable estimate of costs and deadlines. One of the most widely used and documented measurement techniques for obtaining software size is Function Point Analysis (APF), which, however, has its applicability to projects that use the Service Oriented Architecture (SOA) frequently questioned. This work presents the results of the APF application in a fully developed system using the SOA approach, which allowed a later comparison of the APF produced estimates with effort, term and real costs of the project.
Keywords: Software Estimation, Software Measurement, APF, SOA.
1. Introduction
Estimate the size of a software to be developed is indispensable to obtain a reliable estimate of costs and deadlines (WILKIE, 2011), but to carry out this type of estimation adequately is pointed out in the literature as one of the biggest challenges faced by managers in this area (PRESSMAN , 2011; Willeken, 2011, KAUR, 2016). Roetzheim (2000), for example, has conducted extensive research for 18 years, which has concluded that the major causes of software project failures are related to poor cost estimates and execution times, and not to technical, political or team development problems.
Although not an exact science, due to the influence of human, technical, environmental and political variables (SOARES, 2013), measurement techniques (and metrics) of software can contribute significantly to the generation of more assertive estimates, which reduces the discrepancy between what was estimated and what was done, as well as detecting trends and anticipating problems, providing more efficient cost control, reducing risks, improving quality and ensuring that business objectives are achieved (FLORAC, 1997). (1998).
One of the most widely used and documented measurement techniques for obtaining the functional size of a software is FPA (Function Point Analysis) (IFPUG, 2010; WILKIE, 2011; SOARES, 2013). This method was first published in the mid-1970s by Allan Albrecht (ALBRECHT, 1984) and improved by the International Function Point Users Group (IFPUG), and is already consolidated and widely used worldwide (IFPUG, 2010; Page 2 The method uses Function Points (PF) as the unit of measure (IFPUG, 2010).
Despite the consolidation of APF as a technique for sizing the software functional size (LINDSKOOG, 2009; IFPUG, 2010) and the continuous effort to improve and evolve the method, there are scenarios in which its adoption is not direct. Software projects that follow the Service-Oriented Architecture (SOA) approach – architecture for software development whose fundamental principle is the construction of reusable and interoperable services (ERL, 2005), is part of the list of contexts where the APF application is questioned .
Discussions about the applicability of the method to SOA projects have been ongoing and many challenges still need to be overcome for adoption. (GENCEL, 2008; LINDSKOOG, 2009; GOMES, 2012). This difficulty arises from several factors, in which the fact that, in SOA projects, many functionalities are designed for reuse, which makes it common that the scope of a project extrapolates the functional scope of the application being developed ( ERL, 2005). In addition, in SOA, complex systems need to be decomposed into services and much of the analysis and design effort is tied precisely to the process of decomposition and subsequent recomposition of services. This process requires the explicit application of methods and principles for obtaining low coupling, compositing, standardization and transaction mediation, among others, that are not present in the development of conventional software (ERL, 2008). Thus, the stress estimation metrics and benchmarks used for traditional development could not be applied directly to SOA projects (LINDSKOOG, 2009; FARRAG, 2015).
In this context, this article presents results of a case study that involved the measurement, through the APF, of software developed entirely using the SOA approach for later comparison with the effort, term and actual costs imposed in the implementation of the software. The work was developed from data collected from a real project, from which the authors had unrestricted access.
This article is organized as follows: Section 2 briefly presents the basic concepts related to FP Analysis and SOA approach, as well as the main scientific works that guided the proposal. Section 3 presents the adopted Work Methodology, while section 4 presents results obtained. Finally, section 5 brings the main conclusions and final comments.
2. Concepts
2.1 Function Point Analysis (APF)
As previously mentioned, the APF is a technique for measuring software development or maintenance projects maintained by the International Function Point Users Group (IFPUG), which aims to obtain the functional size in "Function Points "(PF), considering the user's point of view (IFPUG, 2010). The IFPUG publishes and maintains the CPM (Counting Practices Manual), which contains the rules and procedures that must be followed to ensure more consistent results in the APF application (IFPUG, 2010).
Organizations can apply this international standard to measure the size of a software in order to: (i) estimate the effort, cost and time required to develop, maintain and improve the software; (ii) provide support for quality and productivity analysis; (iii) provide a normalization factor for software comparison (IFPUG, 2010). Its use has several benefits, such as: objective counting rules, independence of the technological solution and programming language, and the possibility of generating estimates already in the early stages of the software life cycle (SISP, 2015).
The application of the method involves performing the following steps detailed in CPM (2010): (i) obtaining the available documentation; (ii) identify the purpose and type of the count, determine the scope of the count and the boundary of the application; (iii) measure data functions, which are the functional requirements of the user for data storage and / or retrieval and are classified in Internal Logical Files (ALI) – logical data groups held within the application boundary, and External Interface Files (IEE) – are only referenced by the application being measured; (iv) measure the transactional functions, which are functions provided to the user for data processing by an application, and are classified in (a) External Inputs (EE) – responsible for data processing or control information that originates outside the application frontier; (b) External Consultations (CE) – responsible for sending data or control information that goes outside the application boundary; (c) External Outputs (SE) – responsible for sending data or control information that goes outside the application boundary, including additional processing logic, in addition to what is identified in an External Consultation; (v) calculate the functional size; (vi) document and report the count. That is, from the project documentation or software and from the user's point of view (functional requirements) are derived the FPs in terms of the offered features and data involved. Given the amount of FP and based on models such as the Simplified Estimation Model (Vazquez, 2012) or the COCOMO II Model (Boehm, 2009), the effort, time and cost of a project are derived.
2.2 Service Oriented Architecture (SOA)
SOA is an architecture approach to software development whose fundamental principle is the construction of reusable and interoperable services (ERL, 2005). According to ERL (2005), Service is a fundamental unit of service oriented logic (solution logic), that is, the application's functionalities are made available in the form of service.
A logic is considered service-oriented when some principles, known as SOA principles, are applied to a significant extent of the solution (ERL, 2005). According to ERL (2008) there are eight these principles: (I) standardization of contract; (II) low coupling of services; (III) abstraction of service; (IV) service reuse capacity; (V) autonomy of service; (VI) independence of state of service; (VII) service visibility (discovery capability); and (8) service composition capability.
SOA seeks, through the application of the principles: to increase the alignment between business and IT; federalization (access to services is standardized so as to unify the vision of its consumers); the diversity of suppliers; return on investment (ROI); and organizational agility; as well as reducing the weight of IT in the organization (ERL, 2008). In this way, SOA allows you to build applications that respond faster to business demands, since services are built in a standardized way, being able to interoperate (communicate) with each other in a standard and transparent way, regardless of platform, suppliers or technologies which were built or are executed.
Although it has existed for some time, SOA has gained relevance only from the mid-2000s (ERL, 2005). According to a recent survey (WinterGreen, 2014), the SOA market is growing rapidly. The survey report indicates that the SOA market reached $ 5.7 billion in 2013 and could reach $ 16.4 billion by 2020. This significant growth is due to the fact that SOA offers more efficient automated processes and gives IT the ability to invest a larger share of the budget in growing the business. In addition, with decoupled (standalone) software solutions, SOA services can be efficiently reused.
3. Presentation of the Adopted Work Methodology
Measurement through the use of FP to obtain the functional size of the REFERENCE PROJECT, carried out by applying the counting rules defined in the CPM (IFPUG, 2010), aimed to identify, through a comparative analysis, what would be the cost , real time and effort expended in the realization of the project and result obtained from the application of the APF. In this way, it was possible to evaluate if the use of APF would be adequate for the measurement of the project (developed under the SOA approach).
3.1 Project Choice
The choice of the project to be used occurred naturally, since the company where the authors work was contracted to structure the adoption of SOA by an organization that, for reasons of secrecy of information, will be called contractor in the course of this article. The main objective of the project was to structure the SOA adoption by the contractor. Activities were developed for the structuring, development, deployment and monitoring of the SOA adoption program, through the execution of activities that included, among others, the creation of a fully developed system using the SOA approach and which will be called REFERENCE PROJECT during the course of this article.
3.2 Measurement of the REFERENCE PROJECT
The measurement of the REFERENCE PROJECT through the use of FP was performed after the software implementation and implementation was completed. In this way, we choose to perform a detailed count, which considers in addition to the number of transactional functions, the functional complexity (Low, Medium, High) of each function individually. In addition to the artifacts produced during the development of the project, access to the software was used as measurement inputs. We also count on the expert opinion of the members of the project team.
3.3 Estimating the Effort of Software Projects
Several models to estimate effort of software projects, based on PF, are currently available, being the Simplified Model of Estimates (Vazquez (2012)) and COCOMO Model II (Boehm, 2009) most used (SISP, 2015). In this work, we use the Simplified Model of Estimates, the same one used by SISP (2015).
4. Experimental Results
4.1 REFERENCE PROJECT
In this section we present the actual results obtained from the execution of the REFERENCE PROJECT, which includes information about the project team, effort, term and costs of the project.
4.1.1 Project Team
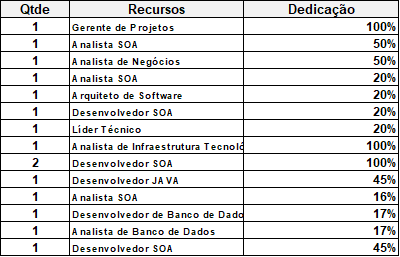
Table 1 presents the team allocated for the development of the solution. Information is presented on the number of people who participated in the project by type of resource / role, the role of the resource allocated in the team with its respective percentage of participation and the relative dedication, in percentages, of a specific resource / role over of the entire project.
4.1.2 Timeframe and Effort Made
The REFERENCE PROJECT lasted 6 months and the actual effort was measured by recording hours at JIRA, a tool that enables project tracking through activity logging and reporting. Table 2 shows the effort expended in carrying out each stage of project development.
Table 2: Effort Made REFERENCE PROJECT
| Project Phase | Hours |
| Business Modeling and Analysis | 1076 |
| Implementation | 826 |
| Theses and Deployment | 268 |
| Total Hours | 2170 |
4.1.3 Cost Realized
The cost was calculated by converting hours to UST (Technical Service Unit), which is the medical unit used to quantify the work. That is, the amount of man-hour is converted into UST according to contractual definition for derivation of costs. The UST calculation takes into account the complexity of the activity performed (low, medium and high). Table 3 presents the result of the conversion of hours / UST for each phase of the project.
Table 3: Cost Realized PROJECT REFERENCE
| Project Phase | Hours | UST |
| Modeling and Analysis | 1076 | 1765 |
| Implementation | 826 | 894 |
| Theses and Deployment | 268 | 304 |
| Total Hours | 2170 | 2963 |
Considering the contracted UST amount of R $ 247.50, the project had a total cost in the amount of R $ 733,342.50
4.1.4 Overall Result
Table 4 presents the summary of effort, time and cost provided in the implementation of the reference project, which will serve as a basis for comparative analysis with the result of measuring the functional size of the software through the use of PF.
Table 4: Overall Outcome
| PROJECT REFERENCE | |
| Effort (hours): | 2170 |
| Term (months): | 6 |
| Cost (R $): | R $ 733,342.50 |
4.2 Functional Size Measurement – IFPUG
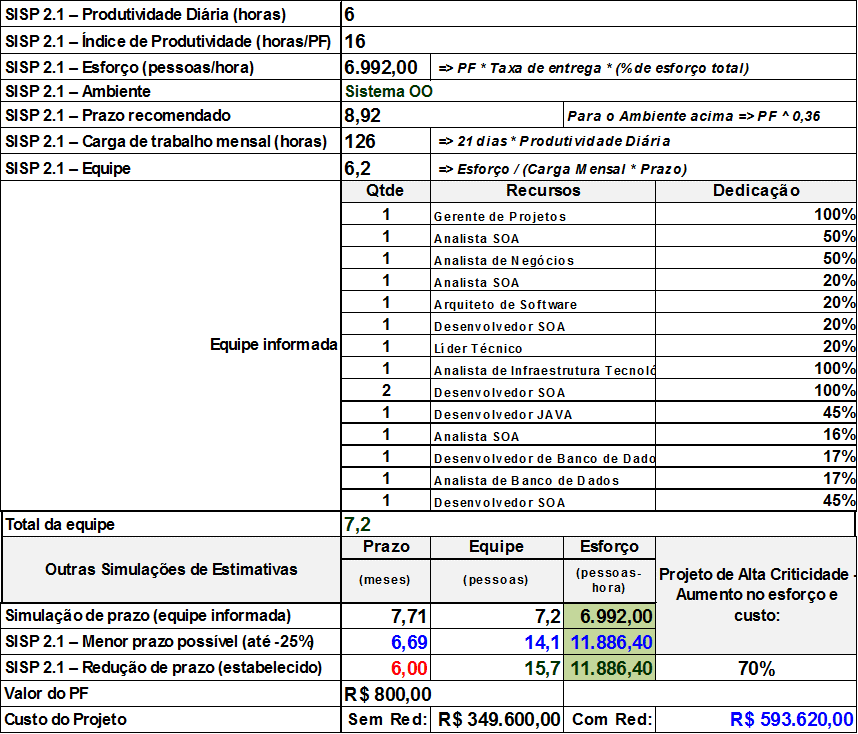
The functional measurement of software size through the use of FP considered the application as a whole, with the functional view from the user's point of view, as recommended by the IFPUG standard APF (IFPUG, 2010). Table 5 presents the purpose (purpose or purpose of the measurement) and scope of Measurement (set or subset of applications to be measured). Table 6 shows, briefly, the result of the count, which corresponds to the value of the functional size of the REFERENCE PROJECT. The Lead, Effort, Team and Cost derivation were determined based on the Simplified Estimates model, which is presented in Table 7.
Table 5: Functional Scenario Measurement PROJECT REFERENCE
| Functional Scenario | |||
| Purpose of Measurement | Functional size measurement (APF IFPUG) of the reference project developed as part of the contractor's SOA adoption program. | ||
| Scope of Measurement | Applications of the REFERENCE PROJECT | ||
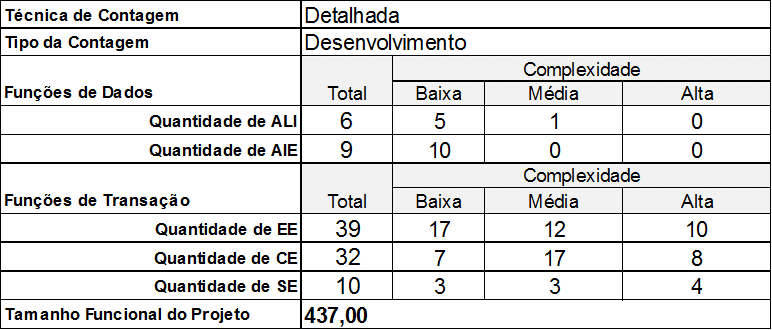
Counting Technique: determines whether the count will be indicative, estimated or detailed. The indicative count is based only on information about the data functions, ie the number of existing logical files (ALIs and AIEs). The estimated count considers, in addition to the amount of data functions, information about transaction functions, so that users' requirements need to be more detailed. For detailed counting, in addition to the number of transactional functions, it is necessary to determine the functional complexity (Lower, Mean, High) of each function individually (NESMA, 2015).
Counting Type: Three counting types are possible: (i) Development: measure of the functionality provided to users considering the first installation of the software. (ii) Improvement / Maintenance: Regarding the modifications, ie, functionality included, modified or excluded, for an existing software. (iii) Application: measure of the functionality that an application offers the user. An Application is a cohesive set of automated procedures and data, which aims to support a business objective and is composed of one or more components, modules or subsystems (IFPUG, 2010).
Functional Size of the Project: Refers to the value of the functional size of the REFERENCE PROJECT.
Daily Productivity (hours): Refers to the amount of productive hours a person has on the day. In this work, it was considered 6 hours / day, as recommended by (SISP, 2015).
Productivity Index (hours / FP): Refers to the number of hours dedicated to the production of 1 FP. The determination of the value of the productivity index depends on several factors, which may include, among others, the technological platform, safety, performance, usability and size of the project. Each organization should have its own productivity table, taking into account historical data from previous projects.
Effort (person/hour): Refers to the number of hours to be dispensed in the delivery of the project, that is, the delivery of the determined functional size. It is calculated based on the project's functional size and productivity index (Size (PF) x Productivity Index (HH / PF)).
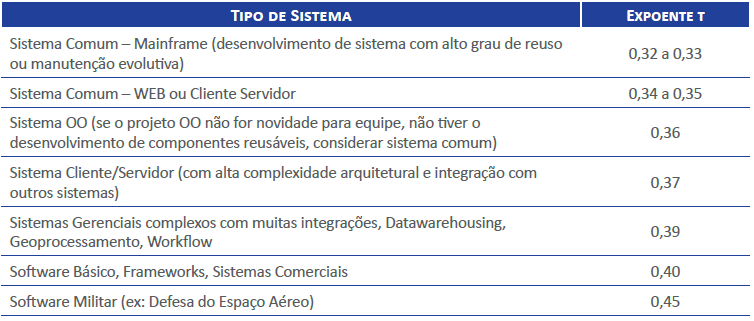
Environment: Refers to the exponent to be used in the formula for determining the recommended term. Table 1 presents the available options. In this, the "OO System – Object Oriented System" was selected, which more closely approximates the characteristics of an SOA project.
Recommended Deadline: It is calculated according to Capers Jones formul[Jones,2007]a.
Monthly Workload (hours): Refers to the number of working hours worked per month per person.
Team: Refers to the amount of resources needed to develop the project and consideration should be given to the percentage of allocation of the resource to the project. In the result presented, the project team of 6.2 resources could correspond, for example, to a team of 12 people with 50% allocation and a project leader with a 20% allocation to the project.
Informed Staff: Refers to the team that has effectively worked on the project development. Its objective is to support other simulations of effort and time and the distribution of resources in the team according to the dedication of each one to the project.
Other Estimates of Estimates: Other simulations of Estimates were generated based on the informed team and considering reduction of term. The value of the function point used was defined based on historical references of the CONTRACTING company. The costs of the project were calculated without considering the reduction of term and considering the reduction of term.
5. Conclusions
5.1 Critical Review of Proposal
From the analysis of the results obtained through the application of the APF and execution of the REFERENCE PROJECT it was concluded that the real cost of the SOA project and the one obtained from the measurement by means of FP resulted in significantly different values (actual cost: R $ 733,342 , 50 and estimated cost: R $ 349,600.00). It was also observed a significant difference between the effort required for project development and actual effort (actual effort: 2170 hours and estimated effort: 6992 hours). The actual and estimated cost (actual cost: R $ 733,342.50 versus estimated cost: R $ 593,620.00) only showed relatively close values when the cost derivation estimation method considers the reduction of the term for the development of the project in relation to the ideally recommended one ( actual term: 6 months vs. recommended period: 7.71 months).
In this way, it was possible to conclude that the APF presented very different results in relation to the actual results obtained, and is therefore not suitable for the measurement of SOA projects. In addition, the APF does not account for non-functional requirements, which are very frequent in SOA applications, such as reuse and service composition. In addition to not allowing the fragmented measurement of the solution, ie the measurement individually per service. This is a very desirable feature when it comes to SOA project measurement, which may involve building a complete solution or just a subset of those services, and may even involve building only a specific service.
5.2 Limitations and Future Work
The work done was limited to measuring one project only. In addition, only one estimation method was used for derivation of effort, cost and time. In future work, the application of APF to a greater diversity of projects and use of other estimation methods can bring benefits insofar as it will provide greater reliability in the conclusions obtained. It will also be of great relevance to propose a specific method for measuring the size of SOA software, which seeks to follow the purest IFPUG concepts in relation to the functional measurement, but also consider the need for fragmented measurement of the solution as well as the measurement of the requirements.
References
ALBRECHT, Allan J. IBM CIS & A Guideline 313. AD / M Productivity, 1984.
BOEHM, B.W. Software Cost Estimation with COCOMO II. Prentice Hall, New Jersey, 2009.
CALAZANS Angelica; LISBOA Irina; Reply with quote Evaluation of the General Characteristics of Systems in Function Point Analysis – APF through the application of GQM – Goal, Questions, Metrics. VII International Symposium on Software Process Improvement. Sao Paulo. November 2011.
ERL, Thomas. Service-Oriented Architecture: Concepts, Technology, and Design. Crawfordsville: Prentice Hall PTR, Aug. 2005.
ERL, Thomas. SOA Principles of Service Design. Prentice Hall, 2008.
FARRAG, Esraa A .; MOAWAD, Ramadan; IMAM, Ibrahim F. An Approach for Effort Estimation of Service Oriented Architecture (SOA) Projects. JSW, v. 11, n. 1, p. 44-63, 2016.
FLORAC, William A .; PARK, Robert E .; CARLETON, Anita D. Practical software measurement: Measuring for process management and improvement. CARNEGIE-MELLON UNIV PITTSBURGH PA SOFTWARE ENGINEERING INST, 1997.
GENCEL, Cigdem; DEMIRORS, Onur. Functional size measurement revisited. ACM Transactions on Software Engineering and Methodology (TOSEM), v. 17, n. 3, p. 15, 2008.
GOMES, Yuri Marx Pereira. Functional size, effort and cost of SOA projects with function points. at the. LXVIII, November, 2012.
IFPUG – INTERNATIONAL FUNCTION POINT USER GROUP. Manual of Function Points Counting Practices. Version 4.3.1, January 2010.
IFPUG – INTERNATIONAL FUNCTION POINT USER GROUP. Assessment Practices Manual. Version 2.3, May 2015.
JONES, C. Estimating Software Costs. Second Edition, Mc Graw Hill, 2007.
KAUR, Prabhjot. A Review of Software Metric and Measurement. International Journal of Computer Applications & Information Technology, v. 9, n. 2, p. 187, 2016.
LINDSKOOG Jeff. Applying Function Points Within a SOA Environment. EDS, An HP Company. 1401 E. Hoffer St. Kokomo, IN 46902. USA. September 2009.
NESMA – Netherlands Function Points Users. Analysis of Initial Function Points. July 2015
PRESSMAN, Roger S. Software engineering: a professional approach. 7th Edition. Ed: McGraw Hill, 2011.
ROETZHEIM, William H. Estimating software costs. SOFTWARE DEVELOPMENT-SAN FRANCISCO-, v. 8, n. 10, p. 66-68, 2000.
SISP. SISP Software Metrics Roadmap: version 2.1, Ministry of Planning, Budget and Management. Secretariat of Logistics and Information Technology. Brasília: MP, 2015.
SOARES DOS REIS, Julio Cesar; BARBOSA, Marcelo Werneck. PROPOSAL FOR AN ESTIMATION TECHNIQUE FOR REQUIREMENTS. Journal of Systems and Computation-RSC, v. 3, n. 1, 2013.
TICHENOR Charley, SNAP-Case Study 2 (vs 1. 0): How to Use Function Points and SNAP to Improve Software Acquisitions Contract. IFPUG. June 2014.
VAZQUEZ, Carlos E .; SIMÕES, Guilherme Siqueira; ALBERT, Renato Machado. Functional Point Analysis: measurement, estimation and management of software projects. 12th Edition, Publisher Érica Ltda, São Paulo, 2012.
WILKIE, F. George et al. The value of software sizing. Information and Software Technology, v. 53, n. 11, p. 1236-1249, 2011.
[1] MSc in Electrical Engineering – UnB
[2] Doctor of Engineering and Knowledge Management
[3] He holds a doctoral degree from the Ecole Supérieure d’Électricité (Supelec), Rennes / France (2001/2002) and a post-graduate internship. He has a PhD in Electrical Engineering from the University of Brasília (2004) doctorate at the Swedish Institute for Computer Science (SICS) in Stockholm / Sweden (2011). He was the coordinator of the Information Technology Center (NTI) of UnB (2006-2008) and Director of the Computing Center (CPD) of UnB (2007-2008). He is involved in research, technological development, and innovation projects, and in partnership with various companies and governmental entities in ICT related matters, where he works on strategy definition, governance model, technology prospecting and technology transfer. His current areas of interest include: loud computing, service-oriented architecture, business process management, distributed systems, and information technology applications in government environments.