ORIGINAL ARTICLE
FREITAS, Igor Cândido de [1], SOARES, Bluma Guenther [2], CORDEIRO, Elisangela Pereira [3]
FREITAS, Igor Cândido De. SOARES, Bluma Guenther. CORDEIRO, Elisangela Pereira. Formulation of a new polymer based on PP and PLA. Revista Científica Multidisciplinar Núcleo do Conhecimento. Year 05, Ed. 10, Vol. 17, pp. 137-157. October 2020. ISSN: 2448-0959, Access link: https://www.nucleodoconhecimento.com.br/chemical-engineering/new-polymer, DOI: 10.32749/nucleodoconhecimento.com.br/chemical-engineering/new-polymer
ABSTRACT
The mixtures containing polypropylene are used in the industrial sector as material for bags, chairs, household items, and can even be used in cell phone batteries. The interest in creating this material is due to its low density compared to more common materials such as iron and ceramic, in addition to its good corrosion resistance and reasonable mechanical properties in environments without high temperature and pressure. In order to diversify the mechanical and viscous properties, different types of polymers were used, such as lactic polyacid, which has beneficial properties for recycling such as degradation. It is a challenge to control the right proportion and use additives and plasticizers to control the desired properties. The methods used to measure the properties of polypropylene and polylactic acid mixtures with different types of additives, compatibilizers and plasticizers were DMA, TGA, tensile, DSC and rheology tests following ASTM standards. The results were promising, observing different mechanical and viscosity properties for the PP/PLA/PP-g-MA/D mixture in different proportions. Thus concluding that the different products have varied application in the industry.
Keywords: Polypropylene, lactic polyacid, blends, epoxidized flaxseed oil.
1. INTRODUCTION
The preparation of polymer blends, that is, polymer blends, becomes an increasing challenge due to the difficulty of compatibility between polymers. According to Utracki (1989) compatibilization depends on the crystal structure, chemical bond, configuration, phases present, among others. For Groeninckx (2006), multiphase mixture materials are strongly dependent on two parameters: interface control and morphology control.
According to Utracki (1989), polymeric mixtures constitute about 36% by weight of total polymer consumption. There are many related benefits such as:
(i) Provide materials with desired properties at the lowest price;
(ii) Understand and improve engineering performance;
(iii) Improve specific properties such as impact resistance or solvent resistance;
(iv) Provide alternatives for recycling and other means of reuse.
Being able to benefit the manufacturer in;
(i) improved processability, a uniform product and scrap reduction;
(ii) Rapid changes in formulation;
(iii) Plant flexibility and high productivity;
2. MATERIALS AND METHODS
The experiments were carried out in the laboratory of Professor Bluma Guenther Soares, located at the Macromolecule Institute (IMA), Ilha do Governador, Rio de Janeiro.
2.1.1 POLYPROPYLENE (PP)
Provided by Braskem®, code CP442XP (heterophase copolymer of propane and ethene with medium fluidity index). Specifications in Table 1.
Table 1: PP specifications.
| ASTM Method | unit | values | |
| Fluidity Index (230°C/2.16 kg) | D 1238 | g/10 min | 6,0 |
| Vicat Softening Temperature at 10 N | D 1525 | °C | 145 |
| Elongation in Runoff | D 638 | % | 7 |
| density | D 792 | g/cm³ | 0,895 |
Source: Braskem®
2.1.2 LACTIC POLYACID (PLA)
Provided by Natureworks LLC, INGEO 2003D (thermoplastic resin derived from renewable resources). Specifications in Table 2.
Table 2: PLA Properties.
| Test method | unit | value | |
| Density / Specific Gravity | ASTM D792 | g/cm³ | 1,24 |
| Fluidity Index (230°C/2.16 kg) | ASTM D1238 | g / 10 min | 6,0 |
| grid | – | – | L96-H |
| D-isomer | – | % | 4 |
| Average Weight Molar Mass | – | g/mol | 114317 |
Source: Natureworks LLC
2.1.3 POLYPROPYLENE GRAPHITED WITH MALEIC ANHYDRIDE (PP-G-MA)
Supplied by Crompton, Polybond code® 3200. Specifications in Table 3.
Table 3: PP-g-MA Features
| unit | value | |
| Fluidity Index (190°C/2.16 kg) | g/10 min | 115 |
| Maleic Anhydride | % (mass) | 1 |
| Melting Temperature | ºC | 157 |
Source: Crompton
2.1.4 DRAPEX 8.5
Awarded by INBRA INDÚSTRIAS QUÍMICAS LTDA. Specifications in Table 4.
Table 4: Features of Drapex 8.5.
| Test method | unit | value | |
| density | – | g/cm³ | 1,025 |
| Fulgor Point | – | ºC | 460 |
| viscosity | – | cP | 300 |
| Epoxy Index | 1.10-Q | g O/100 g min. | 8,3 |
| Acidity Index | 1.3-Q | mg KOH/g max. | 1,5 |
Source: INBRA INDÚSTRIAS QUÍMICAS LTDA
2.2 REACTIVE MIXING ON BRABENDER
2.2.1 SAMPLE PREPARATION
The samples were placed in the greenhouse with a temperature of 60 ºC for moisture drying for approximately 12 hours. Then properly weighed and mixed according to the proportion of phr based on the literature, Table 5 (PLOYPETCHARA et al., 2014).
Table 5: Proportion of mixtures.
| sample | PP (phr) | PLA (phr) | PP-g-MA (phr) | D (phr) |
| PP | 100 | – | – | – |
| PLA | – | 100 | – | – |
| PP/PLA | 50 | 50 | – | – |
| PP/PLA/D | 50 | 50 | – | 5 |
| PP/PLA/D | 50 | 50 | – | 10 |
| PP/PLA/PP-g-MA | 50 | 50 | 3 | – |
| PP/PLA/PP-g-MA/D | 50 | 50 | 3 | 5 |
| PP/PLA/PP-g-MA/D | 50 | 50 | 3 | 10 |
2.2.2 MIXING REALIZATION
Conducted at BRABENDER GmbH & Co KG ®. With temperature of 190 ºC, torque speed of roller-type geometries of 60 rpm, filling factor 0.75, dome volume of 55 cm³ and average processing time 8 minutes.
2.3 GRINDING PROCESSING
After grinding after reactive mixing in BRABENDER, using the MARCONI ® knife mill, whose average rotation was 850 rpm, its size was reduced to a granulometry of 15-25μm according to data from the mill manufacturer, then they were encased and labeled.
2.4 INJECTION PARAMETERS
2.4.1 PREPARATION OF SAMPLES
The samples were placed in the greenhouse at 60 ºC for approximately 12 hours for drying.
At this stage the Thermo Electron Corporation’s HAAKE mini injector was used. MiniJet, for the production of six specimens, following astm d-440 and d-638 standards, the first for the DMA test and the second for traction to make type V test specimens.
- Temperature of 190º of the cylinder;
- Injection pressure of 450 Bar for five seconds in the mold;
- 250 Bar press;
- Mold temperature around 25 º C;
- The time used for melting the material into the cylinder was 5 minutes.
2.5 PRESSING
In this stage, material resulting from grinding was used and used to make discs with a diameter of 25 mm and 1 mm thickness, destined to rheology. The production of 4 discs was made for each in aluminum molds using the Carver Laboratory Press machine. Parameters and processing sequence listed below:
- Base temperature 190 ºC,
- Pressure of 2.5 kN for one minute to perform the degassing and mitigate the effects of gases.
- 3 minutes at 5 kN.
- Mold was removed and put into the cold press for 4 minutes.
2.6 OREOLOGICAL TEST
2.6.1 SAMPLE PREPARATION
The rheology test performed on the Discovery Hybrid Rheometer machine,HR-1 module, using the discs made in the pressing stage, being inserted into the bottom plate of a parallel geometry of 25 mm in diameter and heated under nitrogen atmosphere until it could flow.
2.6.2 TEST PARAMETERS
Two types of scans, deformation and frequency were used, in the first the deformation range was 0.1-100% with frequency fixed at 1 Hz to verify the band of the viscoelastic regime while in the second the frequency varied from 0.1-100 Hz with deformation fixed at 1%, in both cases an isothermal temperature of 190ºC and the gap between the plates of 1000 µm. The other parameters can be observed in Annex 1 following the ASTM standard: D 4440 – 01.
2.7 PERFORMING THE TENSILE TEST
2.7.1 SAMPLE PREPARATION
The specimens produced in the injection stage, type V according to ASTM D638, the machine was adjusted with the distance between the grip of 25.4 mm and the displacement speed was 5 mm.min-1, without the use of an strain gauge.
2.7.2 CONDUCTING THE TEST AND PARAMETERS
The machine used was the EMIC model DL-3000, the test parameters were based on ASTM D638. Young’s Module was calculating by choosing two points within the elastic range.
2.8 CRYSTALLINE ANALYSIS IN DSC
2.8.1 PREPARATION OF SAMPLES
DSC tests were performed on the DSC 204 F1 Phoenix® machine, with a predefined reference pot. In the preparation of the container, holes were drilled in the alumina lids, direction from the inside out, the mass of the samples were 10 ± 0.5 mg and their respective crucibles were in the range of 40 ± 5 mg, followed by placed inside the machine.
2.8.2 TEST PARAMETERS
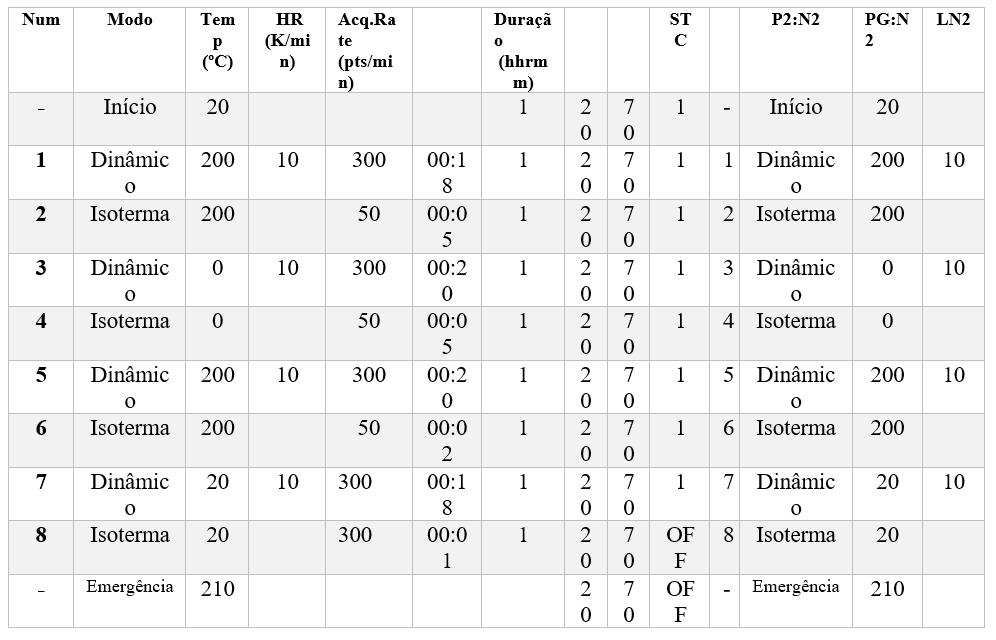
Operating steps listed in the appendix. The second heating and the second cooling with a rate of 10ºC/min were used, following the ASTM E793 – 06, Table 5 standard. The degree of crystalline (Xc) was calculated using Equation (1). The nitrogen flow used for cooling is indicated as P2 and PG in ml/min. The degree of crystalline (Xc) was calculated using Equation (1):
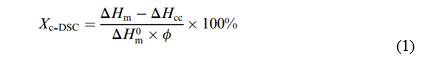
ΔHm and ΔHcc are the fusion enthalpy of the mixture and the cold crystallization of the PLA, respectively; ∆Hm0 is the theoretical fusion enthalpy of 100% crystalline PP which is equivalent to (ΔHm.PP = 138.0 J/g); and Φ is the mass fraction of (PLA + PP) in the mixture.
Table 5
2.9 DEGRADATION ANALYSIS IN TGA
2.10 PREPARATION OF SAMPLES
In this test, the TA Instruments Q50 machine was used, approximately 10 ± 2 mg were used.
2.11 PARAMETERS
The analysis range was from 25 to 700 º C with a rate of 20 °C/min. The test time was 6 hours. The parameters followed the ASTM E1131 standard.
2.12 THERMO-MECHANICAL ANALYSIS IN DMA
2.13 PREPARATION OF SAMPLES
The rectangular shaped specimens produced in the injection were cut up to a length of 35 mm.
2.14 CONDUCTING THE TEST
The machine used was the TA instruments DMA Q800. The analysis range was from -50 ºC to 150 ºC with a rate of 3 °C/min in a nitrogen atmosphere of 40 ml/min and frequency of 1Hz, following the standards ASTM D4065, D4440 and D5279.
3. RESULTS AND DISCUSSION
3.1 POLYMER INTERACTION
Figure 1: Possible interactions between components
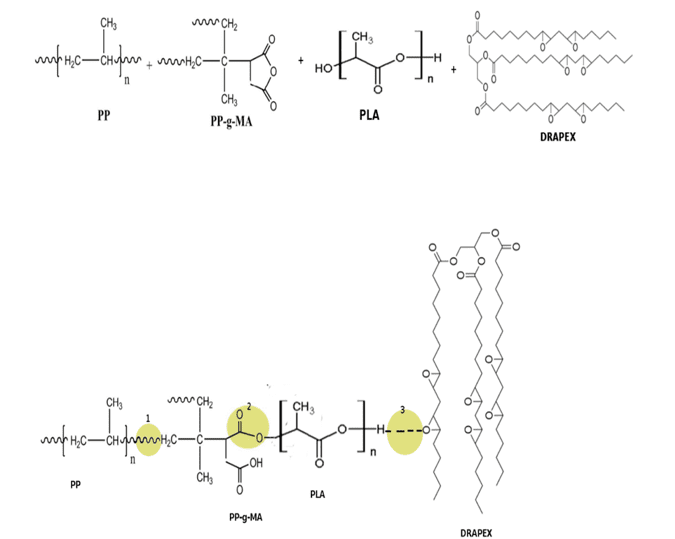
Due to the reactive mixture, there are many interactions between polymers. A probable interaction between polymers can be evidenced in Figure 1. (ZANJANIJAM; HAKIMAZIZI, 2016).
In (1) one can observe the binding of PP with PP-g-MA naturally and in a chain; In (2), however, the PP-g-MA anhydride group is broken due to the interaction with the PLA hydroxyl and thus a bond characterized by an ether occurs; Whereas in (3) there are hydrogen bonds between Drapex and PLA. Another reaction that can occur in (3) is the breaking of the plasticizer epoxy ring and binding directly to the PLA chain (AL-MULLA et al., 2010).
3.2 TRACTION TEST
Table 6:Comparison between mixtures in the tensile test
| sample | Max Voltage (MPa) | Def. max. (%) | mod. Elasticity (MPa) | Elongation at Rupture (%) |
| PP (100) | 23,79 ± 0.59 | 8,33 ± 0,75 | 951,92 ± 50,23 | 1233,33 ± 20,18 |
| PLA (100) | 50,60 ± 3,73 | 5,07 ± 0,72 | 2307,75 ± 105,76 | 16,19 ± 3,14 |
| PP/PLA (50/50) | 33,31 ± 0,85 | 5,33 ± 0,49 | 1444 ± 148,2 | 31,24 ± 5,23 |
| PP/PLA/D (50/50/5) | 21,00 ± 0,88 | 5,1 ± 0,46 | 1248 ± 74,39 | 42,18 ± 3,56 |
| PP/PLA/D (50/50/10) | 18,44 ± 0,57 | 4,54 ± 0,14 | 1273 ± 52,41 | 89,46 ± 4,12 |
| PP/PLA/PP-g-MA (50/50/3) | 34,02 ± 1,78 | 5,11 ± 0,23 | 1577 ± 73,32 | 21,16 ± 7,05 |
| PP/PLA/PP-g-MA/D (50/50/3/5) | 25,01 ± 1,19 | 4,74 ± 0,34 | 1424 ± 131,29 | 35,07 ± 2,14 |
| PP/PLA/PP-g-MA/D (50/50/3/10) | 19,95 ± 0,46 | 4,92 ± 0,45 | 1200 ± 97,32 | 58,14 ± 4,81 |
Source: Author; Origin.
Graph 1: Comparative tensile test
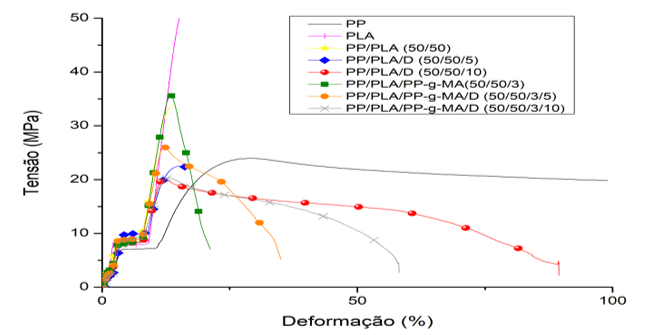
In the traction test, Graph 1, the samples with 10% of Drapex 8.5 showed higher elongation until rupture in relation to the other ones, for example, the one containing PP-g-MA/D (3/10 phr) reached an elongation of 57% before breaking, while the remaining ones this value was up to 30%, the maximum stress, table 7, was higher in samples with PP-g-MA, around 23 MPa, which proves the compatibility and reaction of the anhydride group of PP-g-MA with PP and PLA, leaving the material resistant.
Graph 2: Comparison of elongation (left) and Modulus of Elasticity (right).
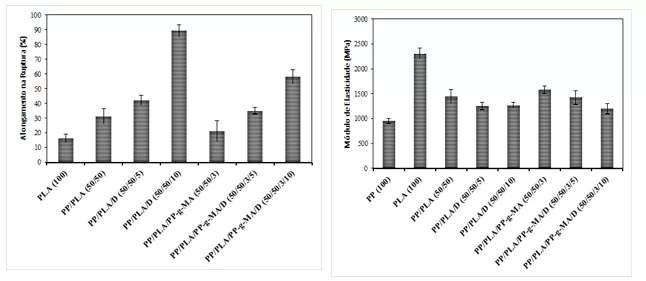
It can also be observed that there was a decrease in the modulus of elasticity for materials with the plasticizer, which may cause the good flexibility of the material. However, the largest modules were for those with PP-g-MA getting the module in the range of 1500 MPa. An increase in the coefficient of elasticity makes the material hard and resistant, but fragile to impact (PLOYPETCHARA et al., 2014).
3.3 RHEOLOGY
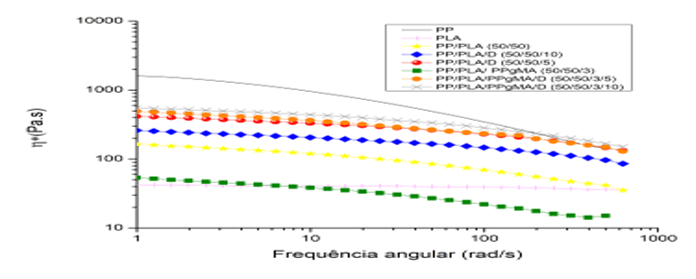
Graph 3: Comparison of complex viscosity for mixtures
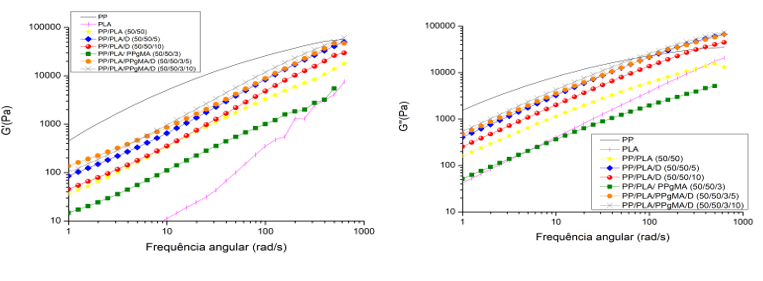
Graph 4: Comparison of storage module (left) and loss module (right)
By Graph 3, the reduction of complex viscosity, with the increase of the percentage of Drapex 8.5 in PP/PLA/D mixtures, caused by the action of the plasticizer increasing the flexibility of the chain, proving its effectiveness. However, for PP/PLA/PP-g-MA/D mixtures there was an increase in complex viscosity that may have been caused by the interaction of the PP-g-MA lateral group with the Epoxy Group of Drapex and together with the PLA in connection with the PP (PLOYPETCHARA et al., 2014).
For the storage module, Graph 4, the PP/PLA/PP-g-MA/D mixtures presented the highest values proving the interaction between Drapex 8.5 and the other polymers as a consequence of good compatibility. Not reflecting in the tensile test because the test is performed with a certain frequency and temperature.The loss module, Graph 4, obtained an increase probably caused by the flexibility of the chain, facilitating rotation (PLOYPETCHARA et al., 2014).
3.4 DSC
Graph 5: DSC for second heating (left) and cooling (right)

Table 7: Crystallization parameters of the PP phase fused in the blend (2nd cooling).
| code | PP
(phr) |
PLA
(phr) |
PP-g-MA
(phr) |
D
(phr) |
ΔHc
(J.g-1) |
Tc
(ºC) |
| PP | 100 | – | – | – | 21,27 | 109,5 |
| PLA | – | 100 | – | – | – | – |
| PP/PLA | 50 | 50 | – | – | 39,31 | 109,1 |
| PP/PLA/D | 50 | 50 | – | 5 | 9,22 | 115,4 |
| PP/PLA/D | 50 | 50 | – | 10 | 29,83 | 110,1 |
| PP/PLA/PP-g-MA | 50 | 50 | 3 | – | 32,40 | 113,7 |
| PP/PLA/PP-g-MA/D | 50 | 50 | 3 | 5 | 32,44 | 114,2 |
| PP/PLA/PP-g-MA/D | 50 | 50 | 3 | 10 | 36,01 | 115,1 |
Source: Machine DSC 204 F1 Phoenix®
Table 8: Cold crystallization parameters of the PLA phase in the blend (2nd heating).
| code | PP
(phr) |
PLA
(phr) |
PP-g-MA
(phr) |
D
(phr) |
ΔHcc
(J.g-1) |
Tcc
(ºC) |
| PP | 100 | – | – | – | – | – |
| PLA | – | 100 | – | – | 26,46 | 109,2 |
| PP/PLA | 50 | 50 | – | – | 10,82 | 108,8 |
| PP/PLA/D | 50 | 50 | – | 5 | – | – |
| PP/PLA/D | 50 | 50 | – | 10 | – | – |
| PP/PLA/PP-g-MA | 50 | 50 | 3 | – | 11,56 | 112,0 |
| PP/PLA/PP-g-MA/D | 50 | 50 | 3 | 5 | – | – |
| PP/PLA/PP-g-MA/D | 50 | 50 | 3 | 10 | – | – |
Source: Machine DSC 204 F1 Phoenix®
Table 9:DSC data of PLA-PP mix and pure components
| code | PP
(phr) |
PLA
(phr) |
PP-g-MA
(phr) |
D
(phr) |
Tg
(°C) |
Tm (°C) | ΔHm (J.g-1) | χc
(%) |
||
| PP | 100 | – | – | – | – | 166,0 | 21,27 | 15,4 | ||
| PLA | – | 100 | – | – | 51,1 | 153,0 | 28,03 | 1,7 | ||
| PP/PLA | 50 | 50 | – | – | 55,3 | 167,1 | 51.0 | 29,1 | ||
| PP/PLA/D | 50 | 50 | – | 5 | 47,6 | 162,0 | 10,23 | 7,4 | ||
| PP/PLA/D | 50 | 50 | – | 10 | 46,5 | 155,9 | 34,38 | 24,9 | ||
| PP/PLA/PP-g-MA | 50 | 50 | 3 | – | 55,5 | 159,3 | 52,19 | 29,5 | ||
| PP/PLA/PP-g-MA/D | 50 | 50 | 3 | 5 | 50,4 | 159,5 | 40,76 | 29,5 | ||
| PP/PLA/PP-g-MA/D | 50 | 50 | 3 | 10 | 47,9 | 168,9 | 39,86 | 28,9 | ||
Source: Machine DSC 204 F1 Phoenix®
Graph 5, the samples with the presence of only Drapex led to an absence of the crystalline peak, which is in accordance with the theoretical function of the plasticizer, making the chain more flexible, making cold crystallization impossible.
There was the appearance of two peaks in the melting range, this effect caused by cold crystallization of PLA after Tg, the presence of two types of crystals (morphological alpha and cold crystallization beta) by the decomposition of the chain (FERNANDES et al., 1999).
In the DSC test for the second cooling, Graph 5, the samples with Drapex showed a decrease in crystallization temperature and vitreous transition along with the peaks of cold crystallization, which proves that the plasticizer interacted with the PP-g-MA and the PP chains.
The second heating scan was used to determine the degree of crystallineity.
The fusion enthalpy (ΔHm) of the mixture, Table 9, refers to the total area of the melting temperature, including PLA and PP. For the calculation of crystallineness, Equation (1), the following criteria were used:
(i) The mixture is composed of PP/PLA (50/50) (wt%) and as the PP composes 50% by mass of the mixture and the degree of crystallineness of pure PP is higher than that of PLA,
(ii) Theoretical ΔH that was used in the calculation was that of PP (ΔHm.PP = 138.0 J/g);
(iii) The volumetric fraction considered in the calculation was 1 (related to mixture 100%);
(iv) The Xc(%) is the degree of crystallineness of the PLA/PP mixture.
The PLA samples exhibited a peak of cold crystallization and the appearance of the double melting peak that can be attributed to the melting of the original crystals and those formed through cold crystallization. (LINGSPRUIELL, 2006).
3.5 TGA
Graph 7: TGA comparative chart for different mixtures
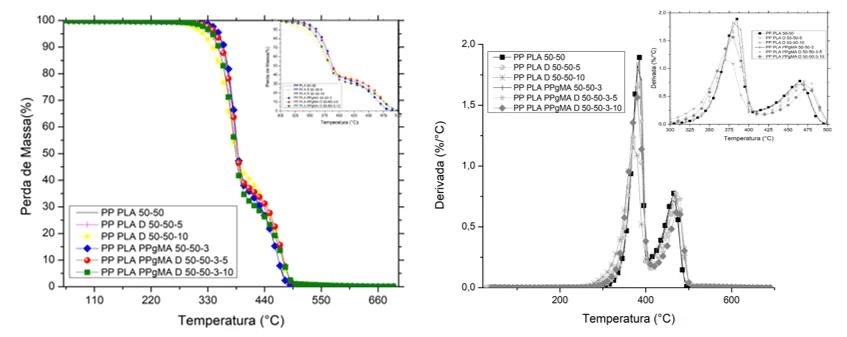
Table 10: Comparison of TGA data
| Parameters | ||||
| material | On Set (ºC) | TMD (º C) | T 50% (º C) | 1st Residue (%) |
| PP PLA (50/50) | 357,21 | 384,89 | 388,98 | 36,35 |
| PP PLA D (50/50/5) | 355,80 | 382,31 | 385,00 | 36,96 |
| PP PLA D (50/50/10) | 341,00 | 373,12 | 384,04 | 41,57 |
| PP PLA PP-g-MA (50/50/3) | 363,20 | 384,70 | 388,60 | 37,49 |
| PP PLA PP-g-MA D (50/50/3/5) | 360,06 | 384,25 | 387,03 | 37,00 |
| PP PLA PP-g-MA D (50/50/3/10) | 352,65 | 379,12 | 383,20 | 41,02 |
Source: TA Analysis and author
In the TGA test, the sample PP/PLA/D 50/50/10, Table 10 and Graph 7, showed an early decay of the curve in relation to the others with an On Set temperature of 341ºC, due to the plasticizer effect. However, the PP/PLA/PP-g-MA mixture was the one that had the beginning of mass loss postponed to an On Set temperature of ± 363ºC (INSTRUMENTALS, 2018).
TMD is the maximum peak temperature of the derivative, it can be seen that it is related to the degradation of PLA as it is susceptible to thermal changes than PP. The mixtures that obtained the highest values for this parameter were PP/PLA, PP/PLA/PP-g-MA and PP/PLA/PP-g-MA/D, 384.89, 384.70 and 384.25 respectively ( INSTRUMENTALS, 2018).
The percentage of the first residue is the first derivative of the mass by temperature, that is, the PLA because it tends to be degradable probably decomposed first and then presented a second derivative that is very likely to be of the remaining mass of PP, PP-g-MA and plasticizer (INSTRUMENTALS, 2018).
3.6 DMA
Graph 8: Delta tangent comparison for different mixtures
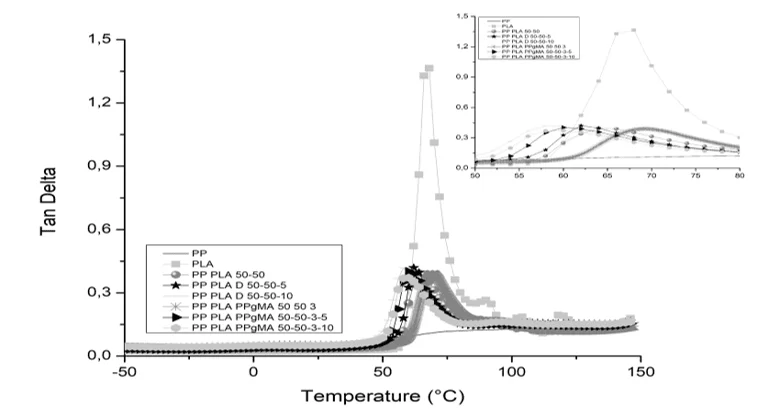
Table 11: Comparative DMA data
| mixture | E’ On set (ºC) | Tan delta (ºC) |
| PP | -8,45 | – 12,87 |
| PLA | 57,89 | 66,95 |
| PP PLA 50 50 | 56,87 | 64,66 |
| PP PLA D 50 50 5 | 56,33 | 62,34 |
| PP PLA D 50 50 10 | 50,5 | 58,66 |
| PP PLA PP-g-MA 50 50 3 | 63 | 70 |
| PP PLA PP-g-MA D 50 50 3 5 | 53 | 60,34 |
| PP PLA PP-g-MA D 50 50 3 10 | 51,05 | 58,64 |
Source: Author
In the DMA test, Graphs 8 and Table 11, the storage module was higher for the PP/PLA/D mixture (50/50/5) which may have been caused by the interaction of the epoxy group in Drapex with PLA/PP-g-MA making the material more rigid, while the increase from 5 phr to 10 phr decreases this effect. However the materials only have stable Modulo of E’ up to 50ºC, after that the effect of the plasticizer causes it to degrade rapidly. (INSTRUMENTALS, 2018).
For the values of Tan δ, it can be said that the material suffered a decrease in the glass transition temperature, proving the plasticizing effect, increasing the flexibility of the chain, whereas the PP/PLA and PP/PLA/PP-g-MA mixtures obtained the higher values of Tan δ, as causes the effect of the bonds between PP-g-MA Drapex and PLA, making the material with stronger bonds and thus less flexible (INSTRUMENTALS, 2018).
3.7 MEV
Figure 2: a) PP/PLA/D (50/50/5); b) PP/PLA/D (50/50/10); c) PP/PLA/PP-g-MA/D (50/50/3/5); d) PP/PLA/PP-g-MA/D (50/50/3/10); 3000X Zoom
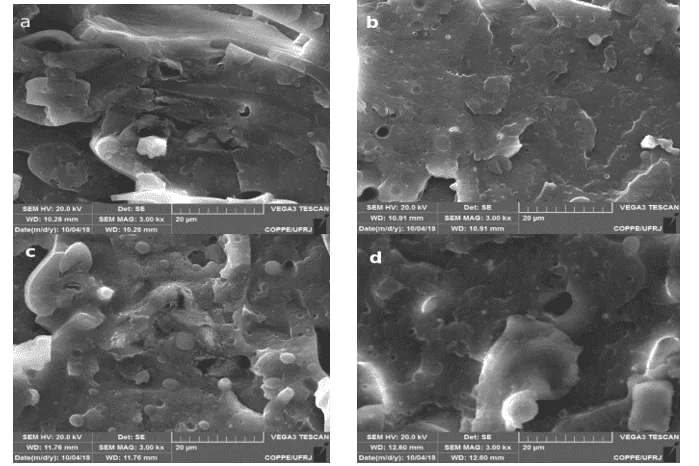
A large amount of PLA can be observed in samples a and c, Figure 2, in white circular modules, which shows complete non-compliance.
On the other, b and d samples of circular PLA formats were mitigated and the region became flatter, evidencing the increase in compatibilization with the increase of Drapex. Therefore, there was a compatibilization (CHOUDHARY et al., 2011).
4. CONCLUSION
The mixture of PP with PLA and PP-g-MA was promising, the rheological assays showed diversified results for the varied proportions of mixture.
There was an increase in the storage module, that is, a greater mechanical absorption with the use of Drapex 8.5, also increased its flexibility that can be proven in the reduction of the vitreous transition seen in the DMA assay and in the rheology loss module. This material could be used in the use of plastic bags. This then facilitates recycling by having a less rigid viscosity.
The material became more rigid for mixtures without the plasticizer. However, beneficial for manufacturing utensils such as cutlery, chairs, among others.
The resulting polymer obtained good thermal properties being stable up to 350 ºC, which is a tolerated parameter for the Brazilian climate.
The increased compatibility was evidenced in the MEV with the reduction of circular PLA interfaces in the domain. In the DSC assays, the mitigation of cold crystallization peaks showed the perfect compatibility of polymers. The crystalline rate remained constant for mixtures with PP-g-MA, PP, PLA and D, showing once again the effect of the compatibleization.
Suggestion for future work would be to implement CNT load on the polymer and observe its behavior.
5. REFERENCES
AL-MULLA, E. et al., “Properties of epoxidized palm oil plasticized polytlactic acid.” Journal of Materials Science. v. 45, n. 7, p. 1942-1946, 2010
AMERICAN SOCIETY FOR TESTING AND MATERIALS. ASTM D4065-12: Standard Practice for Plastics: Dynamic Mechanical Properties: Determination and Report of Procedures. West Conshohocken, PA. ASTM International, 2012.
AMERICAN SOCIETY FOR TESTING AND MATERIALS. ASTM D4440-15: Standard Test Method for Plastics: Dynamic Mechanical Properties Melt Rheology. West Conshohocken, PA. ASTM International, 2015.
AMERICAN SOCIETY FOR TESTING AND MATERIALS. ASTM D638-14: Standard Test Method for Tensile Properties of Plastics. West Conshohocken, PA. ASTM International, 2014.
AMERICAN SOCIETY FOR TESTING AND MATERIALS. ASTM E1131-08: Standard Test Method for Compositional Analysis by Thermogravimetry. West Conshohocken, PA. ASTM International, 2014.
AMERICAN SOCIETY FOR TESTING AND MATERIALS. ASTM E793-06: Standard Test Method for Enthalpies of Fusion and Crystallization by Differential Scanning Calorimetry. West Conshohocken, PA. ASTM International, 2018
CHOUDHARY, P., et al., “Poly(L-lactide)/polypropylene blends: Evaluation of mechanical, thermal, and morphological characteristics.” Journal of Applied Polymer Science, v. 121, n. 6, p. 3223-3237, 2011.
FERNANDES, N., et al., “Thermal decomposition of some chemotherapic substances.” Journal of the Brazilian Chemical Society, v. 10, n. 6, p. 459-462, 1999.
INSTRUMENTALS, T., Universal Analysis. 2. ed. New Castle: TA Instruments, 2018.
LING, X., SPRUIELL, J., “Analysis of the complex thermal behavior of poly (L-lactic acid) film. II. Samples crystallized from the melt.” Journal of Polymer Science Part B: Polymer Physics, v. 44, n. 23, p. 3378-3391, 2006
PLOYPETCHARA, N., et al., “Blend of Polypropylene/Poly (lactic acid) for Medical Packaging Application: Physicochemical, Thermal, Mechanical, and Barrier Properties.” Energy Procedia, v. 56, p. 201-210, 2014.
UTRACKI, L., Polymer alloys and blends, 2 ed., München: Hanser, 1990.
ZANJANIJAM, A., HAKIM, S., AZIZI, H., 2016, “Morphological, dynamic mechanical, rheological and impact strength properties of the PP/PVB blends: the effect of waste PVB as a toughener.” RSC Advances, v. 6, n. 50, p. 44673-44686, 2016.
ATTACHMENT
List of Abbreviations and Acronyms
Institution
IMA- Institute of Macromolecule;
COPPE- Alberto Luiz Coimbra Institute of Graduate Studies and Engineering Research;
Methods
DMA – Dynamic Mechanical Analysis;
DSC – Differential scanning calorimetry;
DTGA – Differential thermal gravimetric analysis;
TGA – Thermogravimetric analysis;
Parameters
∆G – Gibbs free energy variation;
∆H – Enthalpy variation;
∆S – Entropy variation;
IPN – Interpenetrating polymeric network;
Phr- part by one hundred resin.
T – Absolute temperature;
Tan- Tangent
Tc – Crystallization temperature;
Tg – Glass transition temperature;
Tm – Melting temperature.
Polymers
CNT- Carbon nanotube.
D – Drapex 8.5 ® – Epoxidized oil;
PLA – Lactic polyacid;
PP – Polypropylene;
PP-g-MA – Polypropylene modified with maleic anhydride;
PS – Polystyrene.
[1] Materials Engineer at UFRJ.
[2] Guidance counselor. PhD in Polymer Science and Technology. Master’s degree in Chemistry. Degree in Chemist.
[3] Co-advisor. PhD in progress in Graduate Program in Metallurgical and Materials Engineering. Master’s degree in Polymer Science and Technology. Specialization in Plastics and Rubber Processing.Graduation in Full Degree in Chemistry.
Submitted: September, 2020.
Approved: October, 2020.