ORIGINAL ARTICLE
CHITATA, Joaquim Gomes André [1], DGEDGE, Gustavo Sobrinho [2]
CHITATA, Joaquim Gomes André. DGEDGE, Gustavo Sobrinho. Malaria risk cartography in the municipality of Maxixe: Case of the Chambone Neighborhood. Revista Científica Multidisciplinar Núcleo do Conhecimento. Year 05, Ed. 05, Vol. 06, pp. 139-154. May 2020. ISSN: 2448-0959, Access link: https://www.nucleodoconhecimento.com.br/geography/risk-cartography, DOI: 10.32749/nucleodoconhecimento.com.br/geography/risk-cartography
SUMMARY
This article focuses on the assessment of malaria risk spatialization, based on data from residential areas by type of breeding sites in the Chambone neighborhood (Maxixe, Mozambique). For the operationalization of the objectives, we opted, in addition to the bibliographic review, for a quali-quantitative approach, for accompanied observations and surveys. The results reveal that the areas at high risk of malaria in Chambone are the extreme northeast, center-eastern, southern and inland southwest-central. These high-risk areas, according to the reclassification given by kernel density, are of higher concentration of breeding sites and dwellings. Given the diversity in the spatial distribution pattern of risk and the factors with conditioning factors, taking into account the type of planning for all areas of the Chambone neighborhood, it was feasible to develop plans adjusted to local interests to modify the current spatial pattern of malaria risk distribution.
Keywords: Cartography, spatial analysis, environmental risks, malaria.
1. INTRODUCTION
Malaria is an infectious, febrile, acute or chronic, systemic, non-contagious disease caused by parasites of the genus Plasmodium and transmitted by the bite of the Anopheles mosquito (Ávila, 1996; Garcia et al, 2009; Nweti, 2010). In Mozambican territory, this parasite is responsible for about 90% of malaria cases and can be transmitted to men and women of all ages. According to Roll Back Malaria (RBM, 2008, 2014) and WHO (2014), in its report “Global Malaria Action Plan”, in Africa most deaths are clustered in only 35 countries, with only five of which account for 50% of deaths worldwide and 47% of all malaria cases, with Burkina Faso being , Nigeria, the Democratic Republic of congo, Uganda, Ethiopia, Mali, Malawi, Mozambique and Tanzania (Figure 1).
Figure 1: Map of the spatialization of malaria risk in the world, WHO (2014)
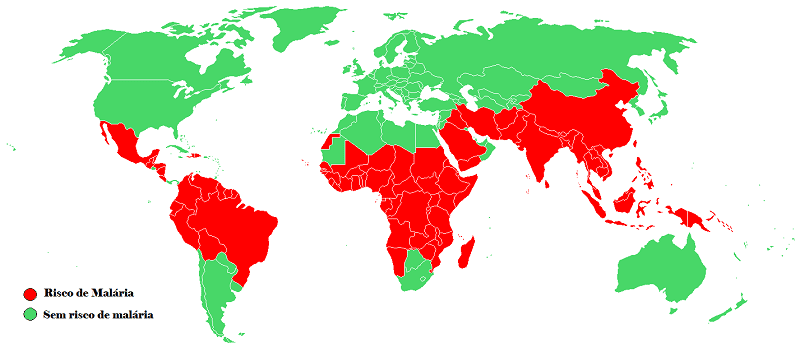
In Mozambique, malaria affects communities in poor rural and urban areas more by the lack of information and precautionary measures, with high transmission rates and difficulties in accessing basic health services, thus leading to the death of about 3.9% of the infant population and 6.2% of the adult population (WHO, 2004). Mozambique is considered a territory at risk of malaria, due to its geographical location: in a tropical region where malaria is an endemic disease resulting from the favoring of the climate in its transmission in the soon to almost every year, reaching its maximum peak after the rainy season (December to April).
This issue is reflected in the intensity of transmission that varies from year to year and from region to region, depending on temperature, precipitation and altitude. However, some dry areas of the national territory are considered to be little prone to the epidemic and there was, in 2008, the hope that by 2011 the malaria vaccine would be available to save lives (MISAU, 2008). According to SSMAS (2016), the municipality of Maxixe recorded about 46,773 reported cases of malaria, a significantly high number when compared to other geographical areas of the country, and this disease is responsible for the high mortality rates in this municipality.
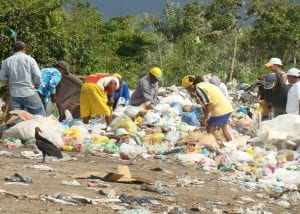
Thus, the study constitutes one of the subsidies for the planning of the health sector and territorial management, thus contributing to sustainable development. Therefore, the fact that the municipality of Maxixe is located in a tropical region where there is a greater probability of the development of the vector causing malaria, thus making it a region of risk of malaria, allied to the way of life of residents of the Chambone neighborhood, who undergo constant contact with the epicenters of diseases (breeding sites), tires used as a seal, car wash , trash cans, workshops, waterways, archetype of houses, among others, can hinder the control of vectors and potentiate the transmission of the disease.
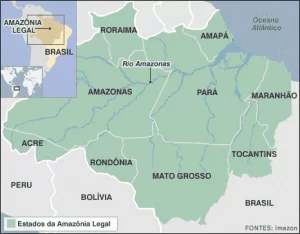
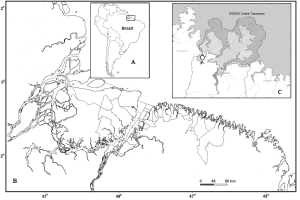
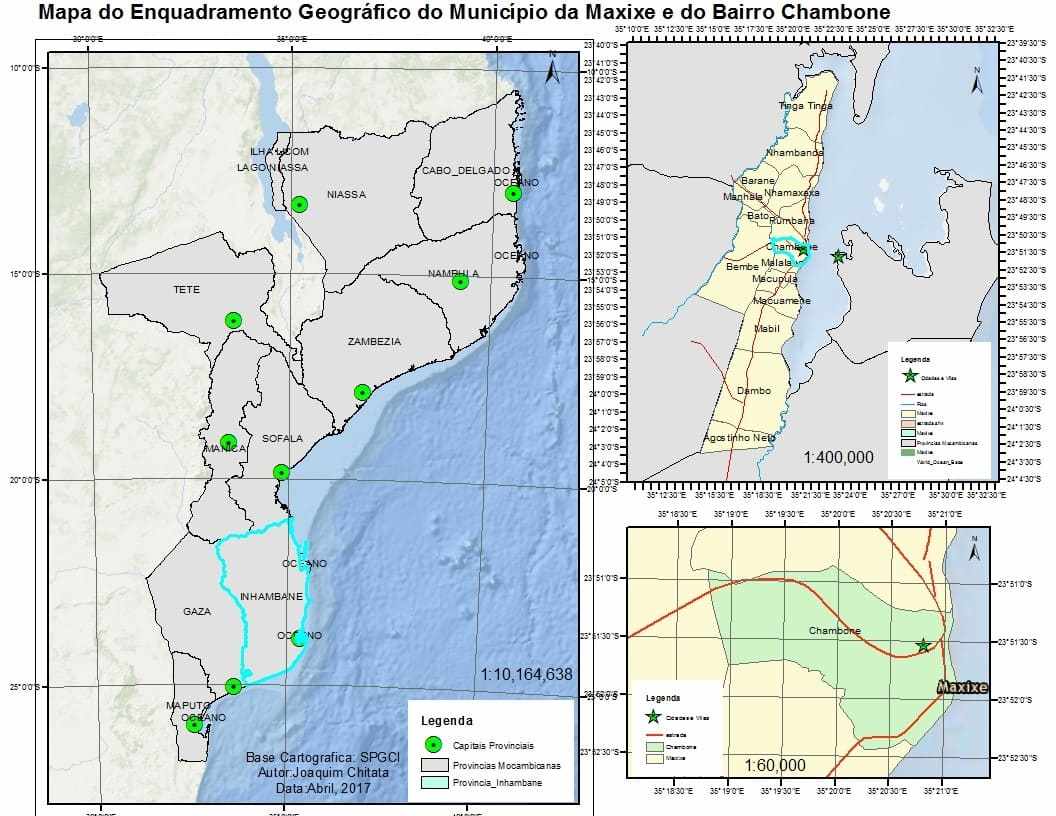
The municipality of Maxixe coincides with the same area occupied by the tracing of the District of Maxixe in terms of limits of political and administrative jurisdiction and is part of the Mozambican territory, located on the southeast coast of the bay of Inhambane, where the Chambone district is located, occupying an area of about 12.6 km², located in the central region, one of the most privileged areas in geostrategic terms , between the coordinates 23º 51′ 30″ and 23º 52′ 10″ south latitude, and 35º 18′ 00″ and 35º 21′ 15″ of east longitude (figure 2). The data can be better viewed below:
Figure 2: Map of the Geographical Framework of the Study Area
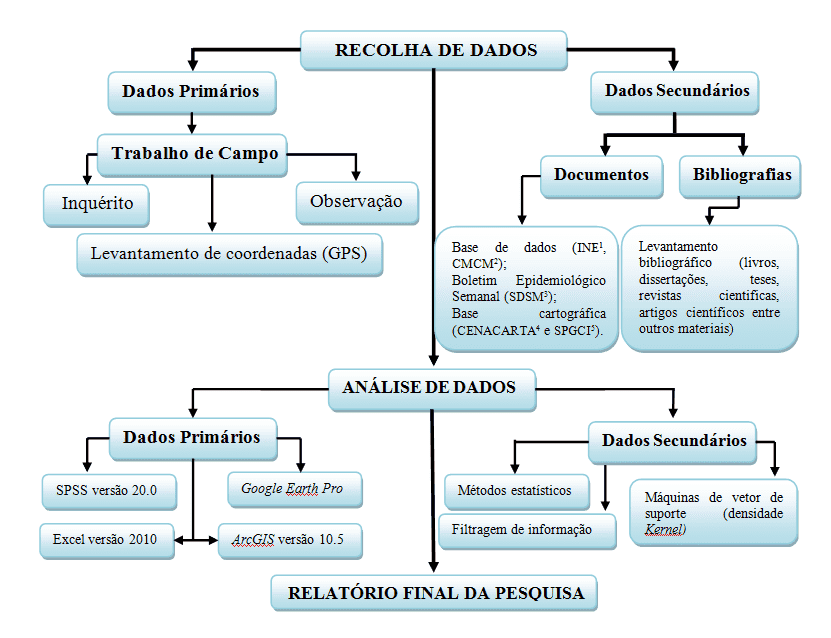
The work was based on the qualitative-quantitative approach, bibliographic and documentary research to understand the basic concepts of the theme, observations were also made accompanied by geodesic surveys and a descriptive study about the environmental situation of the different settlements of the Chambone neighborhood, from January 2016 to April 2017. The surveys were extracted from a universe of about 2,500 households. To validate the characteristics of the place, maps, graphs, tables and other secondary data related to malaria risk were elaborated. Therefore, the stages of carrying out the activities of this research, illustrated in the flowchart (figure 32345) are presented in a syntheti[3]c way:
Figure 3: Flowchart of the research methodology
[/caption]
2. RESULTS AND DISCUSSION
The characterization of the Chambone neighborhood includes socio-environmental aspects that refer to the probability and severity of malaria risk levels and was based on elements of the survey such as: (i) time of year, frequency of malaria cases and cross-variable physical environment. These elements showed that most cases (53.6%) occurred in the summer, since it is in this period when the rainfall rates recorded throughout the year are high (more or less healthy physical environment), conditioning the activation and emergence of new breeding sites (table 1); (ii) behaviors that leave residents exposed to the mosquito, considering that most people watch the TV and listen to the radio with doors and windows open, about 36.5% and the smallest number of responses refers to the practice of agriculture with about 6.2%, as illustrated in Table 2; (iii) malaria prevention measures: the results show that residents choose more for the use of mosquito nets and repellents, with 48.3% and 22.3%, respectively (Table 3).
Table 1: Time of year and frequency of malaria cases and physical environment of the neighborhood
| Physical environment of the neighborhood in which you live (climate, pollution, etc.) | Total | ||||||
| Unhealthy | Very little | More or less | Very | ||||
| Time of year and frequency of malaria cases | Summer | Count | 34 | 89 | 158 | 14 | 295 |
| % within | 11.5% | 30.2% | 53.6% | 4.7% | 100.0% | ||
| Winter | Count | 1 | 6 | 20 | 20 | 47 | |
| % within | 2.1% | 12.8% | 42.6% | 42.6% | 100.0% | ||
| Count | 35 | 95 | 178 | 34 | 342 | ||
| Total | % within | 10.2% | 27.8% | 52.0% | 9.9% | 100.0% | |
Source: Author (2017)
Table 2: Behaviors that leave residents exposed to the mosquito
| Behaviors that leave residents exposed to the mosquito during the summer | Responses | Percent of Cases | |
| N | Percent, New Year | ||
| Conversation outside the residences | 121 | 27.8% | 35.3% |
| Watch the TV and listen to the radio with doors and windows open | 159 | 36.5% | 46.4% |
| Lying in the backyard and under the trees at night | 129 | 29.6% | 37.6% |
| Practice of agriculture | 27 | 6.2% | 7.9% |
| Total | 436 | 100.0% | 127.1% |
Source: Author (2017)
Table 3: Malaria Prevention Measures
| Malaria prevention measures | Responses | Percent of Cases | |
| N | Percent, New Year | ||
| Mosquito net | 210 | 48.3% | 61.0% |
| Repellents | 97 | 22.3% | 28.2% |
| Spraying | 60 | 13.8% | 17.4% |
| Elimination of ponds/grass | 68 | 15.6% | 19.8% |
| Total | 435 | 100.0% | 126.5% |
Source: Author (2017)
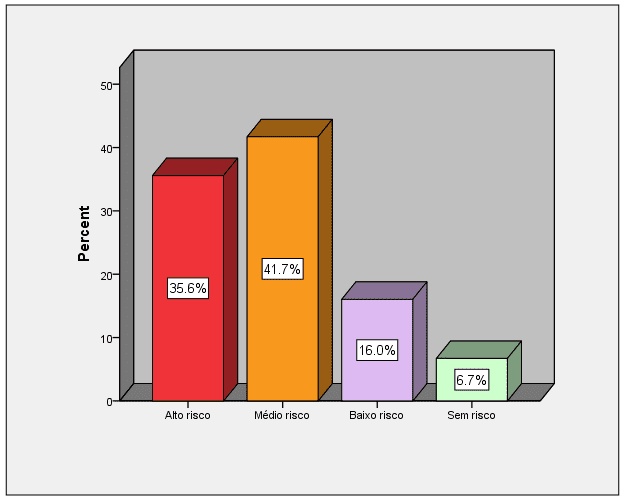
Continuing, (iv) refers to the way in which housing is built, which can contribute significantly to the spread of the malaria-causing mosquito, due to the lack of windows and walls in some houses, and about 72.1% of the residences have complete walls, constituting the largest number of households with dwellings outside the situation of the elements at risk (Figure 4); (v) the perception of the population in relation to the risk of malaria is positioned in the medium and high risk condition, with 41.7% and 35.6%, respectively. This situation shows that only 22.7% of the total population is in a low risk and risk-free situation (Figure 5).
Figure 4: Characterization of the walls of the houses
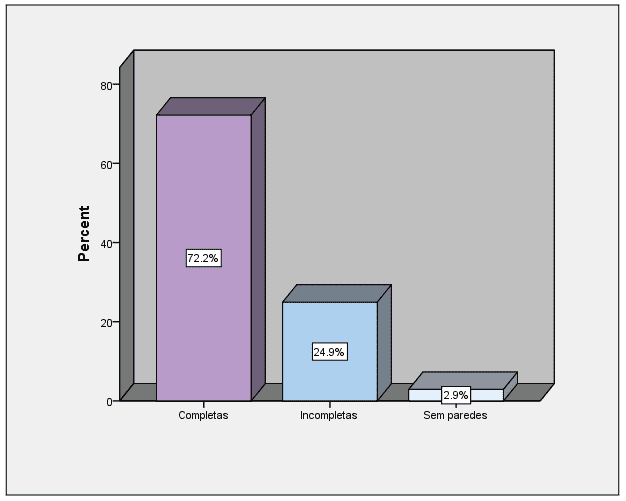
Figure 5: Perception of malaria risk
[/caption]
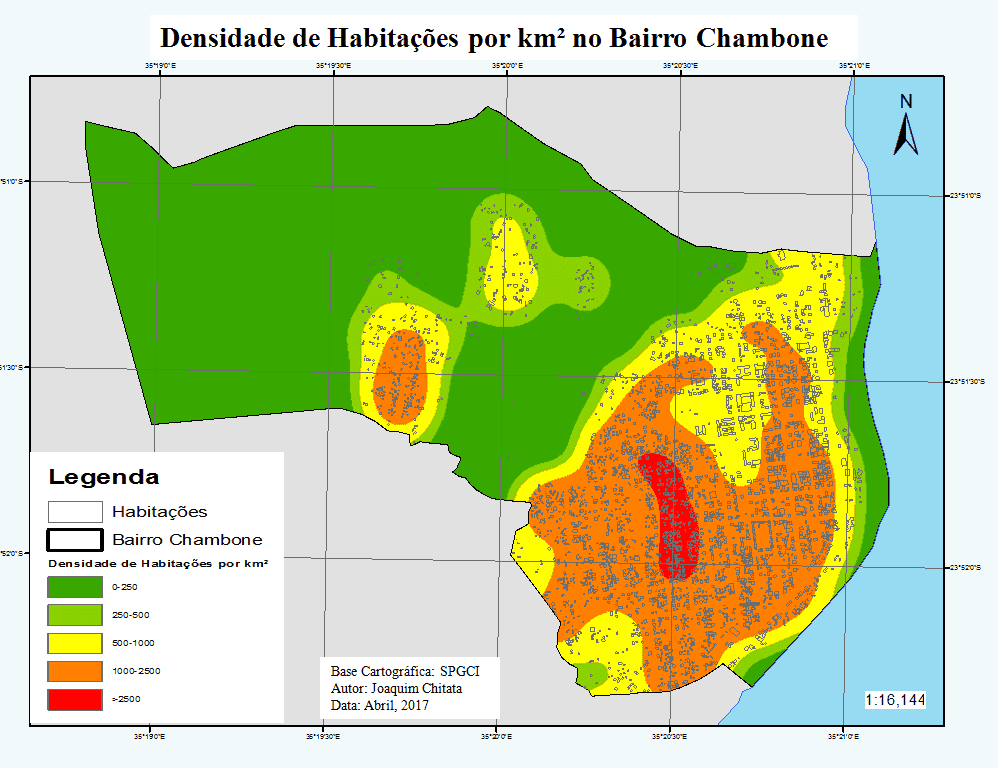
The analysis of spatial information requires a particularity depending on the typology of the data to be presented, and these can be points (location of the breeding sites) and the areas with counting (number of dwellings). The representation by a housing surface, classified from the density levels that alternate according to color and tonality, was interpreted as follows: red means very high density; orange indicates high density; yellow refers to average density; the green with lighter tint concerns the low density and the green with darker tint denotes a very low density. The surface generated in relation to the population presents values from 0 to more than 2500 inhabitants per square kilometer (hab/km²), as shown in Figure 6.
The northern-central-southern end of the eastern part of the Chambone district, has a higher concentration of dwellings, which means very high and high population density and ranges from 1000 to more than 2500 inhabitants/km². This very high and high population density is due to the fact that it is an urban area, where the headquarters of the municipality of Maxixe is located, which has a higher population concentration when compared to other areas. Further into the interior of the neighborhood, specifically in the extreme southwest in relation to the most urbanized area, we find a small cluster that constitutes an area of high and medium density, with variations from 500 to 2500 inhabitants/km².
Figure 6: Map of the spatial distribution pattern of housing density
[/caption]
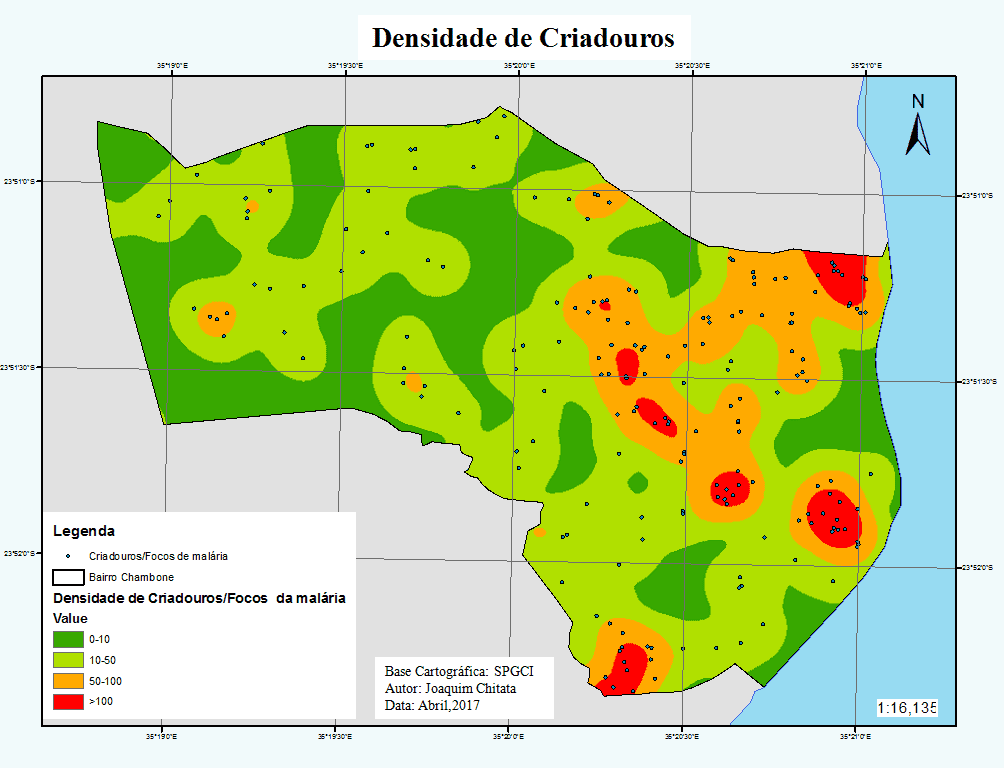
The classification of the spatial distribution pattern of the density of breeding sites/foci of malaria (Figure 7) was made with attention to color and tonality, represented by four (04) breeding sites of densities, distributed by 332 georeferenced points and defined by proximity/neighborhood ranging from 0 to more than 100 breeding sites, with the following attribution: red means very high density; orange indicates high density; green with lighter tint implies medium density and green with darker tint refers to low density. Analyzing the map of the spatial distribution pattern of the density of breeding sites, it is perceived that these are distributed in almost the entire Chambone neighborhood, and the areas of very high density (more than 100) and high density (50 to 100) of breeding sites are at the northern-central extreme.
Figure 7: Map of the spatial distribution pattern of the density of Breeding sites by proximity
[/caption]
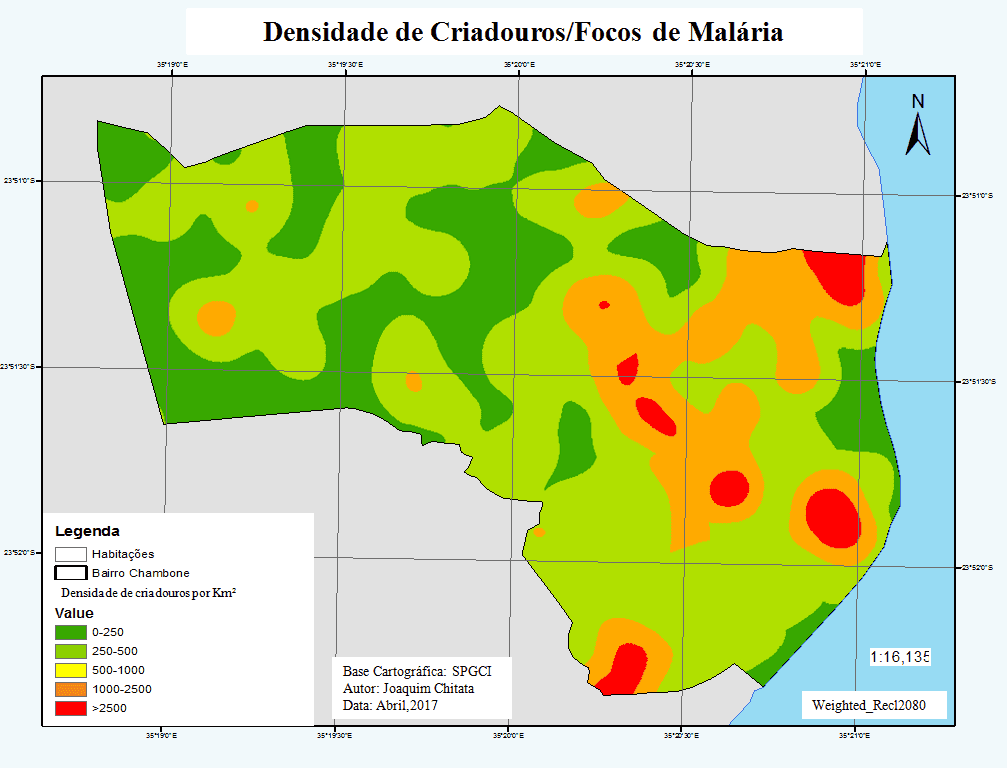
The process of schematic representation of the procedure of reclassification of breeding sites moves to another fundamental step in order to obtain information on the density of breeding sites per Km² in the neighborhood, qualified from the horizontality of the density, according to the color and tonality, clarified as follows: green with darker shade concerns the very low density; green with lighter tint means low density; yellow is of medium density; orange indicates high density and red implies very high density (figure 8).
To analyze the density situation of breeding sites per km² in the study area, we started to categorize kernel density into five (05) levels, already referenced in the previous paragraph, being a surface that results from very high densities (more than 2.5 km²) and high densities (1 – 2.5 km²) of breeding sites. These are at the northern-central, eastern-central and southern extreme. It is also remarkable the predominance of medium density on most of the surface of the Chambone neighborhood.
Figure 8: Map of the spatial distribution pattern of the density of Breeding Sites per Km²
[/caption]
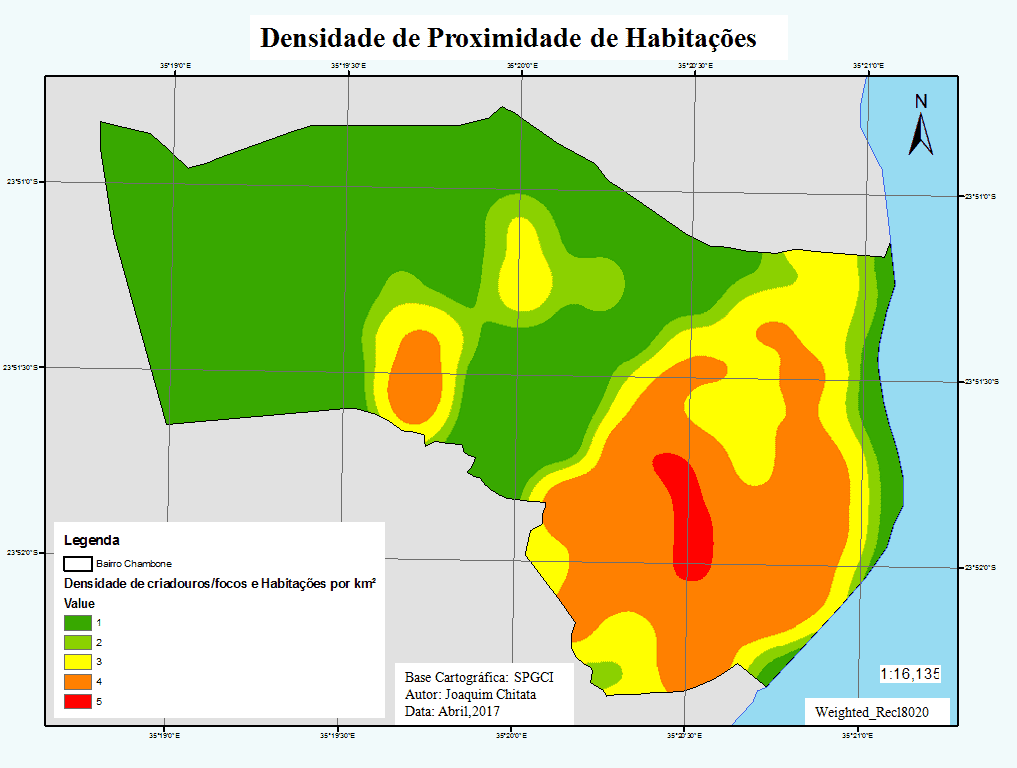
There was a need for the reclassification of the dwellings using the kernel density map of the proximity of dwellings, presenting densities levels (1 to 5), and level five, represented by the red color, indicates the greatest proximity between the dwellings in the Chambone neighborhood (figure 9). This proximity or neighborhood of housing shows a greater concentration of the population in these areas, an essential indicator that requires attention in the process of analyzing the risk of malaria. The concern with spatial analysis for the present study served as a tool to georeference the risk areas of the Chambone neighborhood and to identify the factors associated with the spatial pattern of malaria risk.
It is in this order of ideas that the exact location of risk areas, distance between breeding sites or outbreaks of malaria and housing was sought. The evidence of the location of concentrations of a greater number of breeding sites in or near housing areas is fundamental to the analysis at the neighborhood level, which allows the identification of priority areas for intervention by local authorities.
Figure 9: Map of the spatial distribution pattern of the density of dwellings by proximity
[/caption]
For a better reading, analysis and interpretation of the Kernel map (figure 10), layers were classified, based on risk levels that vary from factors defined by color and tonality, interpreted as follows: red means high risk; orange indicates medium; green with lighter tint means low and green with darker tint means there is risk. The logical structure of cartographic language presented for the evaluation of the spatialization of malaria risk in the Chambone neighborhood allows a very fast, clear and effective perception of the real situation.
This information is classified through other data aggregates, because, in the observations, references are always found to identify and qualify the study area. A set of spatial information on epidemiological risk may include not only observations of health events, but also information about the place where they were collected (BARATA, 1997), that is, in addition to the physical environment, their complex interactions with social, cultural and economic aspects of the place can be taken.
Figure 10: Map of the spatial assessment of malaria risk in the Chambone neighborhood
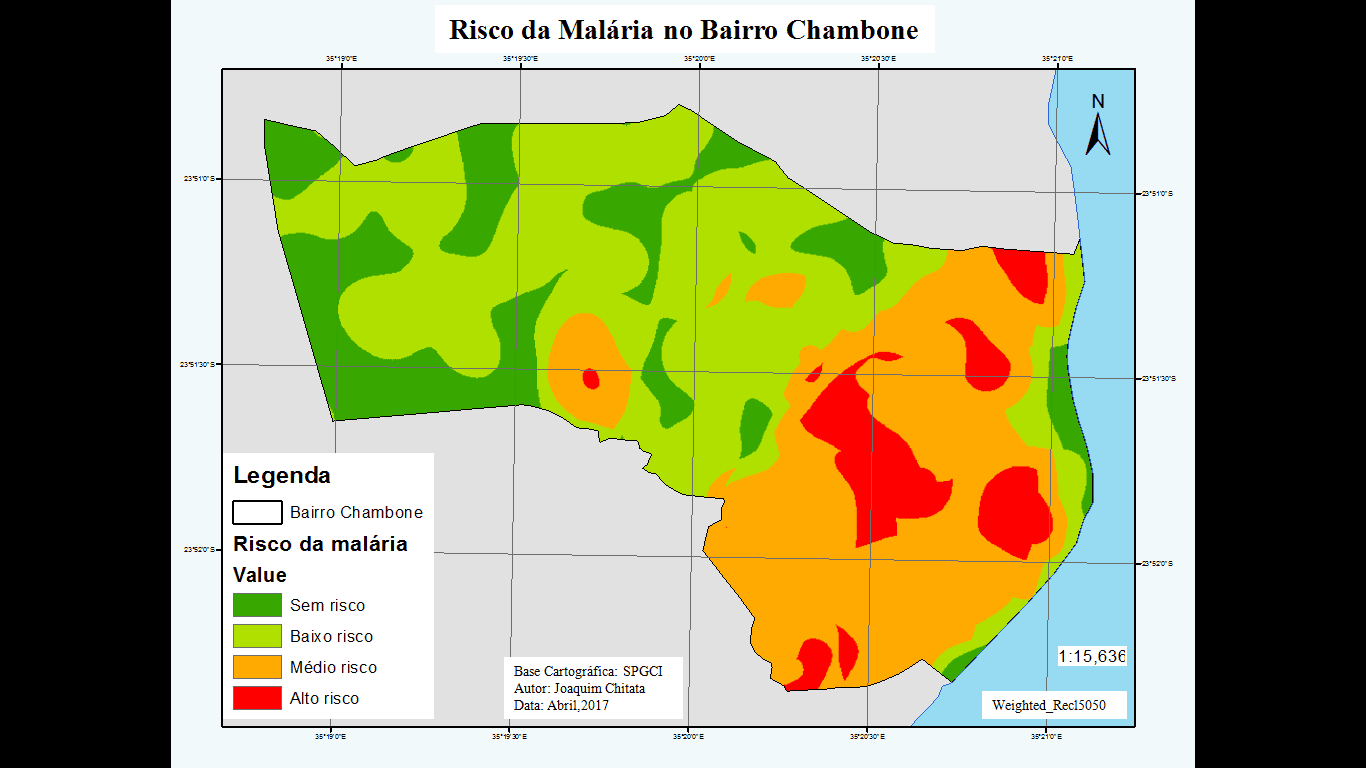
The issue of risks has always been associated with man because his presence in a certain place becomes a priority in the event of an event. It was in this sense that, when defining the risk areas in the Chambone neighborhood, it was based on the result of the combination of two components: the first of the energetic geophysical environment that covers the danger due to the human presence and the second comes from the exposure of the inhabitants in connection with the dangers derived from this energetic, which places them in the condition of vulnerability. Therefore, studies of the spatial relationship between malaria risk data contributed significantly to a better understanding of the phenomenon under analysis. The high-risk areas of malaria in the Chambone neighborhood are the northeast, mid-eastern, southern and inland extremes to the central Southwest.
This result illustrates that these areas have a higher concentration of breeding sites and dwellings, thus establishing high-risk areas, according to the reclassification given by kernel density. To provide more subsidies to the spatial distribution of malaria risk in the Chambone neighborhood, we opted for the use of an image chart to illustrate the high-risk areas concentrated in the extreme northeast, central-eastern, southwest and southern (Figure 11). This is some evidence of the socio-environmental reality of the study area. In the extreme northeast is a pond covered with vegetation of reed, grass and shrubs. This lagoon has continuity along the eastern coast, consisting of a vegetation of mangrove and small shrubs, interspersed by stagnant waters, dumpsters, tires used as vegetation, among others.
Figure 11: Image Chart of High Risk Malaria Areas in Chambone District
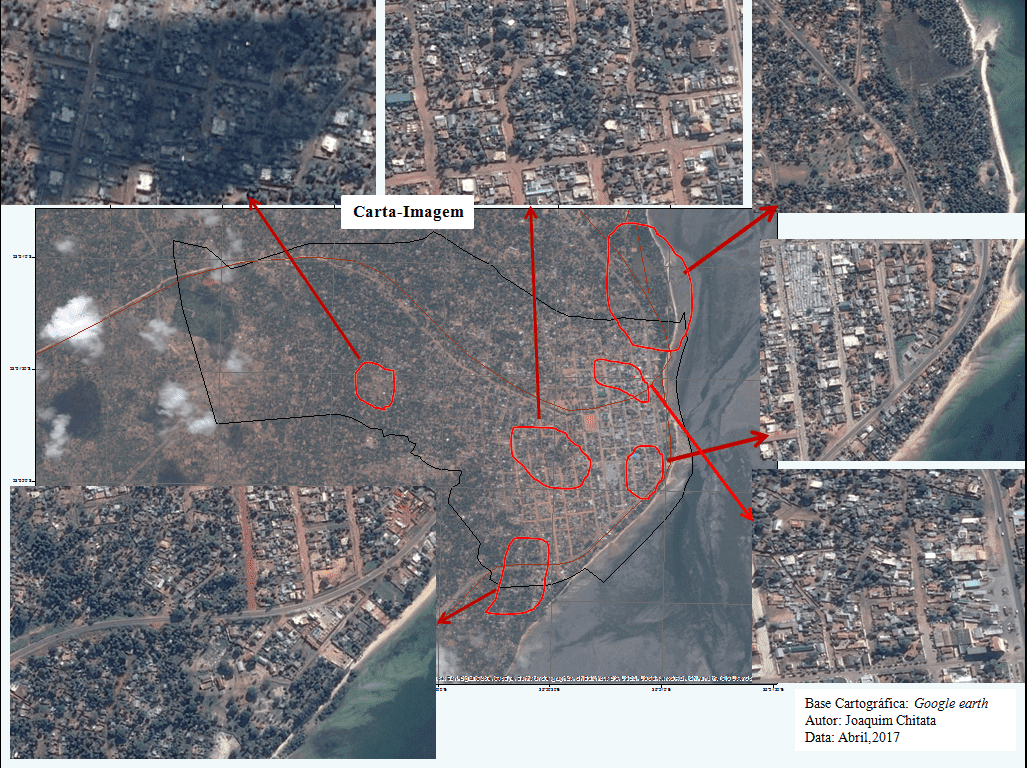
[/caption]
Finally, it is important to note that the extremes of the northeast, central-eastern, southern and inland more to the southwest are areas occupied by the majority of the disadvantaged population of the middle and lower classes. Most of the dwellings in these places are made up of caniço-wood-zinc, coconut leaves, considered relatively cheap and affordable, when compared to conventional ones (for masonry construction). It is also noted that these areas, in some cases, are devoid of a physical planning of the environment with basic requirements, thus contributing to the proliferation of more breeding sites.
FINAL CONSIDERATIONS
Given the results presented and discussed in this article, of course, they are far from exhausted, pulses of a long and intense research activity, characterized by many obstacles and setbacks and with the objective of evaluating the spatialization of malaria risk based on data from residential areas by type of breeding sites in the Chambone neighborhood, it was possible to notice that: the high risk of malaria, in certain areas of the Chambone neighborhood, is associated with the existence of breeding sites, poor home/housing conditions and the time of exposure to the vector causing malaria. These high-risk areas are associated with more other factors, such as physical-geographical (location close to the natural environments of anophelic species) and socioeconomic conditions (informal settlements and precarious sanitation conditions of the environment).
In Mozambique, malaria is endemic throughout the territory and most of the population lives in areas at high risk of malaria infection due to factors that contribute to endemicity, namely: climatic and environmental conditions, favorable temperatures, precipitation pattern, places conducive to vector propagation, the socioeconomic situation of most of the population related to poverty , inappropriate housing and inaccessible means of prevention (PNCM, 2007). The assessment of the risk of malaria in the Chambone neighborhood was first characterized by socio-environmental characterization and obtaining breeding sites or outbreaks of malaria, and then the identification of risk areas was made. Linked to this was the production of malaria risk spatialization maps in the Chambone neighborhood. These were some of the questions that permeated this study.
This generation of cartographic products to illustrate the spatialization of malaria risk serves as a fundamental tool for competent local authorities, managers and community health agents, allowing the definition of mitigation and control actions in areas considered to be at high risk of malaria.
REFERENCES
ÁVILA, S. L. M. Malária. In: FERREIRA, A. W. Diagnóstico laboratorial das principais doenças infecciosas e auto-imunes. Rio de Janeiro: Guanabara Koogan, 1996.
GARCIA, F. R. M. et al. 2009. Influências ambientais na qualidade de vida em Moçambique. Disponível em: http://www.acoalfaplp.net. Acesso em: 16 mai. 2020.
MISAU – MINISTÉRIO DA SAÚDE. 2008. Moçambique. Disponível em: http://www.misau.gov.mz/pt/programas_de_saúde/malária. Acesso em: 21 jan. 2016.
NWETI. Comunicando para a Saúde. Revisão de Literatura sobre Malária, 2010.
OMS. Relatório sobre o paludismo no mundo 2014. 2014. Disponível em: http:// apps.who.int/iris/bitstream/10665/160458/3. Acesso em: 22 jan. 2016.
PNCM – Programa Nacional de Controlo da Malária. Plano Estratégico da Malária 2012 -2016. MISAU. Maputo: Direcção Nacional de Saúde Pública, 2007.
SPGC – Serviços Provinciais de Geografia e Cadastro. Shapefiles de Moçambique e do Município da Maxixe, Inhambane, 2017.
SSMAS – Serviços de Saúde, Mulher Acção Social. Relatório Anual de Maxixe. Moçambique: Maxixe, 2016.
ROLL BACK MALARIA. 2014. O Plano de Acção Global da Malária para um Mundo livre de Paludismo. Genebra: Parceria Roll Back Malaria. Disponível em: www.rollbackmalaria.org [email protected]. Acesso em: 10 jun. 2016.
WHO – World Health Organization. Estratégias de Cooperação da OMS com a República de Moçambique, 2004-2008, 2004.
APPENDIX – FOOTNOTE REFERENCE
3. INE – National Institute of Statistics; 2CMCM – Maxixe City Council; 3SDSM – District Health Services of Maxixe; 4CENACARTA – National Center for Cartography and Teledetection; 5SPGCI – Provincial Services of Geography and Registration of Inhambane.
[1] Master’s degree in Environmental Management and Graduated in Geography Teaching.
[2] PhD in Environmental Sciences (PhD), Master in Waste Management and Degree in Geography and History.
Sent: March, 2020.
Approved: May, 2020.