ORIGINAL ARTICLE
CHAVES, Patrícia Corrêa [1], FILHO, Plauto Werle [2]
CHAVES, Patrícia Corrêa. FILHO, Plauto Werle. Server virtualization: A case study to evaluate the adoption of Green IT practices. Revista Científica Multidisciplinar Núcleo do Conhecimento. 04 year, Ed. 07, Vol. 01, pp. 35-84. July 2019. ISSN: 2448-0959. Acess Link: https://www.nucleodoconhecimento.com.br/science-of-music/green-ti-practices
ABSTRACT
The increasing use of IT in commercial and residential environments generates the need to search for new technologies. This most often causes misuse of available resources, because new assets are usually added to the medium and not the unification of services into a single piece of equipment. Green IT comes with the intention of exposing sustainable practices for the application in these environments, in order to prevent misuse of resources. Virtualization appears with the objective of preventing the asset from staying with its idle hardware, unifying more than one service in it, still ensuring the quality and availability of the service. Through this work, an exploratory qualitative research was carried out, with the objective of knowing which techniques and methods are being adopted by the academic community in relation to the use of server and application virtualization through practices adopted in green IT. As a result of the research, a Virtualization plan was elaborated with the search for the energy efficiency of the services. As a future work proposal, the possibility of measuring this elaborate plan through other metrics is the possibility of measuring through other metrics.
Keywords: Virtualization, Green IT, Sustainability.
1. INTRODUCTION
The use of technological resources increases every day in people’s routine, according to the 29th Annual It Use Survey conducted in 2018 by the São Paulo School of Business Administration of the Getúlio Vargas Foundation (FGV EAESP), Brazil has 174 million computers in use, this represents five equipment for every six people. According to a research conducted by Petró (2013), it was estimated that, if technological expansion continued at the same speed, the relationship between man and machine, in 2016, the number would be one to one, that is, an equipment for each person.
According to Perosini (2017), the world lives in the Information Age. Giddens (2013) completes this statement by indicating that the Age of World Globalization also lives, which generates an excessive increase in the flow of information, which in turn needs greater processing capacity, storage space and access speed. According to a research conducted by Neto (2010), a number of information was generated close to the zetabyte measure. For the year 2020, the author Spaniol (2016) estimates that it will be 44 trillion gigabytes. These aspects justify the need to search and use for new computer equipment with the hardware/software configurations necessary to meet the demands.
According to Dorow (2013), organizations are responsible for much of this data generated, because companies build a knowledge base for each organization and the exchange of these, in real time, can increase profit or generate losses for the management in force, which leads to the high investment of companies in the computer segment.
According to author Romam (2007), as a result of all these actions, there is no hiding the large number of discards of outdated and obsolete equipment and materials. Many components that make up these devices have toxic substances, which, if discarded in the wrong way, harm the environment. In his work, Romam (2007), indicates that if the equipment is recycled in correctly, it can form substances such as dioxins and furans, both carcinogenic. For Ferreira (2008), the great challenge for society is the correct/conscious acquisition and disposal of IT equipment.
Then, in this context, some concepts of Green IT emerged, a term derived from English that refers to the subject of sustainability. In view of the review of studies carried out, according to Lunardi (2013) and Rech (2014), it can be affirmed that this is one of the most recent terms used in conventions and studies of protection and future of the environment.
Green IT are implemented techniques, based on environmental policies, which lead organizations to reduce unnecessary consumption and the environmental impact generated by the undue disposal and misuse of technological resources, arranged by an ISO, ISO 14001. Server virtualization contributes to Green IT to strengthen its concepts, where the focus is on the energy efficiency provided by virtualization projects.
Through the literary review on work aimed at implementing sustainable practices, we list some services that can be virtualized, among them, website hosting, webmail servers, backup service, file servers, storage server for file storage, application servers, internet connection bandwidth, proxyservice, DNS server, Microsoft and Linux update repository server and antivirus service.
In the face of the presented, the following problem question that led this study is formulated: how can organizations manage resources/equipment in a sustainable way, within green IT practices, focused on systems virtualization?
After a literary review, it was possible to carry out the case study in an organization. The present study aimed to evaluate how server virtualization can be applied as a Green IT practice. To achieve this goal, the following objectives were defined: to identify the main Green IT practices, to develop a configuration plan to configure the services using systems virtualization and to define metrics for evaluating the virtualization process plan focused on Green IT practices, which focuses on energy efficiency.
And finally, as a practical result, a possible virtualized server configuration solution is presented, where in it will be performed the step by step of an installation model for backup server.
The article is organized as follows, in section 2, presents a review on Green IT and Virtualization, showing the main techniques and what levels are adopted. In section 3, the research methodology and planning for the application of the work are presented. Starting for section 4, the execution can be followed and in section 5 the conclusions are presented with the sumarization of the results achieved.
2. THEORETICAL FOUNDATION
2.1 GREEN TI
According to Brayner (2013), Green IT practices ensure that people are applying techniques and rules for sustainable development, covering changes in the IT structure, its internal and external policies.
According to Murugesan (2008), practical Green IT solutions can be classified into three groups, they are: Tactical, Strategic and Deep IT Incrementation. The following level will be addressed individually.
2.1.1 TACTICAL INCREMENTATION GREEN TI
This group includes measures to reduce the use of unnecessary electrical resources. This includes monitoring the power automatically, available in the equipment itself, replacing incandescent bulbs and improving heat emission to the environment, are simple measures that do not incarnatizing expenses for the company when implemented, only benefits. At this level there is no change in the IT infrastructure in the company (Pinto & Saivone, 2011).
At this level, it can be affirmed that it is people’s first contact with Green IT practices within organizations, they are direct or indirect practices that do not insure expenses for implementation. On the contrary, they add benefits to companies that use these resources.
According to Prado (2005), a simple action to adopt in the organization is the shutdown of monitors when they are not in use, this can represent a 25% reduction in energy consumption.
Table 1 shows the result of the work carried out by Prado (2005), applied within the Municipality of Lorena, his experimental laboratory. The project aimed to configure the computer monitors to adapt them to the operation, in order to adapt to the administrative routines of the city, aiming to optimize the use of electrical resources.
Table 1 – Result of the Lorena City Project/PR.
| Administrative Sector | Qty
Monitors |
Daily Consumption (KWh) | Monthly Consumption (KWh) | ||
| Before | After | Before | After | ||
| Cpd | 06 | 3,570 | 2,677 | 78,540 | 58,905 |
| Taxation | 09 | 5,355 | 4,016 | 117,810 | 88,353 |
| Planning | 04 | 2,38 | 1,785 | 52,360 | 39,270 |
| Protocol | 01 | 0,595 | 0,466 | 13,090 | 9,817 |
| Treasury | 05 | 2,975 | 2,231 | 65,450 | 49,087 |
| Accounting | 06 | 3,570 | 2,677 | 78,540 | 58,905 |
| Heritage | 02 | 1,19 | 0,932 | 26,180 | 19,635 |
| Shopping | 05 | 2,975 | 2,231 | 65,450 | 49,087 |
| Warehouse | 04 | 2,38 | 1,785 | 52,360 | 39,270 |
| Hr | 05 | 2,975 | 2,231 | 65,450 | 49,087 |
| General Total | 47 | 27,965 | 20,973 | 615,230 | 451,422 |
Source: Prado (2005).
It is noteworthy that, at the end of the project execution, Prado (2005) presented a reduction of 154 kWh of energy consumption, this within an administrative sector.
2.1.2 STRATEGIC GREEN IT
According to Pinto and Saivone (2011), The Strategic Green IT encompasses a change in the organization’s IT infrastructure. For this, it is necessary to conduct a survey and a detailed analysis of the resources and services offered in the company. Soon after, there is the possibility of creating a strategic plan of redistribution of the organization’s assets and equalizing the services provided, always aiming at a sustainable development and implementation, that is, in an ecologically correct way, emitting less aggression to the environment and avoiding waste of resources.
With the result of the detailed analysis, there may be a need to purchase new equipment that consumes less energy and with better performance. And for this, equipment suppliers use marketing to stimulate brand interest in customers.
At the strategic level, it was also observed in the literature the adoption of methods and techniques of systems virtualization, a technique that is the focus of this research project. According to Siqueira (2008) this technique allows to use all the hardware resource available in the equipment, as an advantage, is the reduction of the acquisition of new equipment.
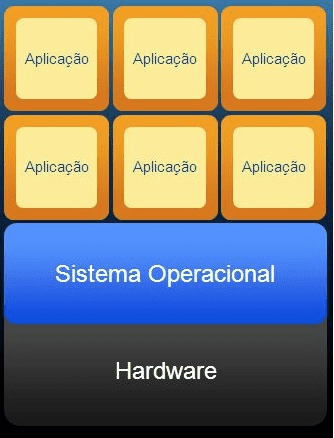
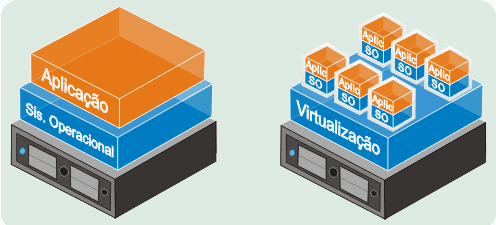
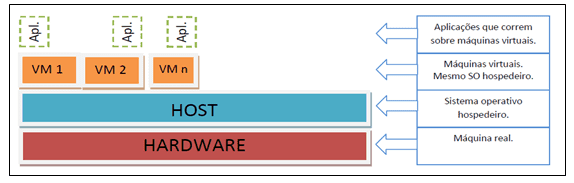
Figure 1 presents the modeling of the required structure of a virtualized application server, which has a single hardware equipment and operating system, for the various operations required.
Figure 1 – Application Virtualization
Lunardi (2013) in one of its data collection work reported that three companies (drug retail, fuel trade and container terminal) adopted as practice of Green IT, use of echo source, replacement of monitors, use of digitized documents, energy autonomy policy and systems virtualization technique.
According to a study conducted MCAFEE and ICF INTERNACIONAL (2008), there is a need to check the levels of digital security of the company. That’s because the research reports that the 62 trillion spam sent annually consumes 33 billion kilowatts/hour of electricity, enough to illuminate 2.4 million homes. As a result of this energy consumption, a carbon dioxide equivalent to 3.1 million cars consuming 7.5 billion liters of gasoline was released.
At the strategic Green IT level, after bibliographic review it can be observed that the ORGANIZATION’s IT managers begin to have a little more work and can also be observed a greater interest in protecting the environment, and further reduce the operational costs of the organization. Generally, the implementation of the planning carried out brings physical changes in the internal environment and change of the base of the service provided.
2.1.3 DEEP GREEN TI (DEEP IT)
According to a research conducted by Pinto and Saivone (2011), the sets of Green IT practices applied and developed in work and projects, energy saving, systems virtualization, videoconferencing, paper saving and destination of electronic waste are the most sought after.
When talking about Green Fund it, after a literature review, it can be observed that the term “fund” is used in the intention to cover all layers of IT of the organization (Pinto & Saivone, 2011). So, in this group, the approach becomes broader and more costly, as it requires a change in all infrastructure, processes and equipment.
At this level there is the integration of Tactical IT and Strategic IT, but the focus is now on changing the technology park, where the goal is to increase the performance of equipment aiming at a minimum waste of resources, says Lunardi (2013).
According to author Rech (2014), as an example of a very extreme application of Green IT, one can cite the companies Google and Facebook. The datacenters of these companies have been transferred and are located in the South Pole. This attitude reduces the emission of pollutants that degrade the environment and, together with this action, reduce stake in resources for temperature and environmental control.
Menezes (2012) describes the Node Pole, illustrated in Figure 2. Node Pole is Facebook’s new datacenter, has 28,000 square meters and is located in sweden’s Arctic Circle. The electricity needed for its operation is from a renewable source, the supply is through hydroelectric plants, the datacenter becomes a sustainable project.
Figure 2 – Node Pole
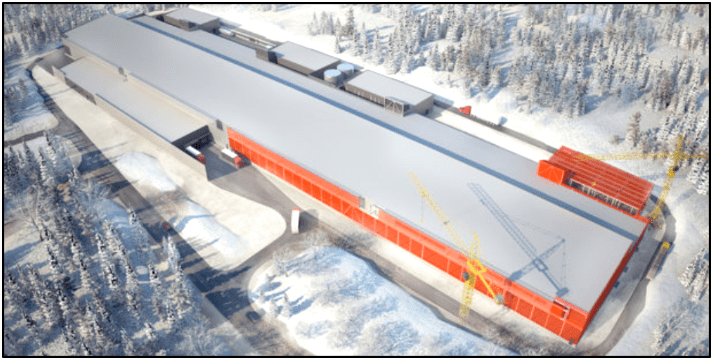
In an interview on Computerworld (2008), conducted with an IT Manager at the South Pole, Henry Malgrem, the datacenter he managed has 30 servers and the local climate is around minus 51 degrees.
After the Green IT review, one can observe the importance of Systems Virtualization, as a practice adopted by Green IT to achieve energy efficiency, because through it it is possible to perform hardware sharing, preventing the service from not using even half of the processing capacity of the host equipment.
2.2 VIRTUALIZATION OF SYSTEMS
According to Carissimi (2008), for the operation of a computer equipment, at the user level, it is necessary that it has an operational software that works between hardware and applications. According to Silberschatz (2001), systems virtualization aims to transform the most efficient and convincing use.
According to the author Pereira (2011) virtualization originated in the 1960s with IBM, in the period the goal was to perform the use of mainframes simultaneously. According to the author Monguinho (2012), this practice is related to the concept of LPAR (Logical Partitioning), whose application allows the segregation of a server into several independent virtual partitions.
Duarte (2012) defines virtualization as emulation of isolated environments that enables different operating systems to function simultaneously, within the same hardware, so that the maximum available hardware capacity is taken advantage of. Siqueira (2008) states that virtualization allows you to transform complex physical environments into simple environments with easier management.
According to Carissimi (2008), through virtualization it is possible to divide a physical computational system into several virtual machines, providing an independent interface to each.
In relation to the characterization of virtualization one can have several. Waters (2007) describes three basic categories: storage virtualization, networks, and servers. Murphy (2008), in turn, defines in eight types: virtualization of operating systems, application server, application, management, network, hardware, storage and service. Monguinho (2012) addresses in four types: application virtualization, storage, operating systems and hardware. Balbino (2013) defines three types of virtualization: virtualization of servers, applications, and desktops.
Figure 3 Handren (2014) exemplifies the relationship between a traditional architecture versus a virtualized architecture. In the traditional one has a single hardware for each operating system with an application running, already in the virtualized there is a share of a hardware creating a virtualization platform where you can put several operating systems running different applications.
Figure 3 – Traditional Virtualization Architectures
The following topics will cover the types of virtualization. For the preparation of this work will be used the following categories: Virtualization of Applications, Storage Media and Operating Systems.
2.2.1 VIRTUALIZATION OF OPERATING SYSTEMS
According to Monguinho (2012) in this type, the paradigm that a single system can be configured on a desktop or server by hardware, is broken. One or several virtual machine can be used, each of which is created by software within a specific host. They can also be classified as: Emulation or Simulation, Native Virtualization and Virtualization at the Operating System Level.
2.2.1.1 EMULATION OR SIMULATION
According to Burdett (1998) emulation is an accurate way to simulate a situation with specific characteristics, which in this case allows the host computer to operate as if it were another. Gonçalves (2008), in his work, argues that this type should not be considered a virtualization since it needs a host.
Monguinho (2012) agrees that in this type since the clock, the instruction set and cache memory is simulated. The author defines this technique as VMM – Virtual Machine Monitor – and the host sees it as an application simulating all the operations that the host hardware controls. In Figure 4 the author Monguinho (2012) illustrates an emulation sketch.
Figure 4 – Emulation or Simulation
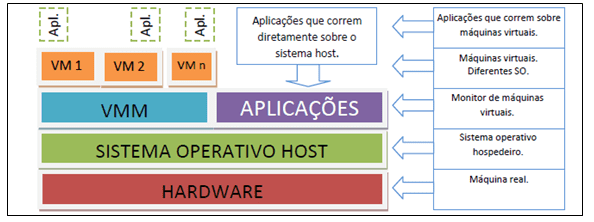
Source: Monguinho (2012).
2.2.1.2 NATIVE VIRTUALIZATION
Native Virtualization, according to Gonçalves (2008), is a software layer that controls all available resources in a Virtual Machine. Monguinho (2012) states that in this type of virtualization VMM has full control of the hardware, where each virtual machine operates as if it were a real one. The goal is to provide the system with a replica of the actual hardware. In Figure 5, the author Monguinho (2012) illustrates the outline of a Native Virtualization.
Figure 5 – Native Virtualization
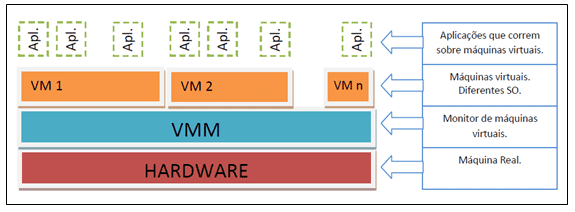
Source: Monguinho (2012).
2.2.1.3 VIRTUALIZATION AT SO LEVEL
According to Strickland (2008), in this type of virtualization the Operating System, OS, does not use hypervisors. In its place, the host Operating System is the one that does its turn.
Monguinho (2012) defines this technique as an OS kernel – Operating System – to which it is allowed to create other new OS. Multiple VM’s – Virtual Machines – can be created independent and secure on the same server with isolated partitions. The author cites as a disadvantage that the host OS has to use the same OS version of the host host. In Figure 6 the author Monguinho (2012) illustrates the outline of a Virtualization at the OS level.
Figure 6 – SO-level virtualizations
2.2.2 APPLICATION VIRTUALIZATION
The author Monguinho (2012) defines that in this practice of virtualization, the application is executed securely protecting the Operating System and applications from possible changes in risks. The author cited Wine to exemplify an emulation of Windows applications in a Linux environment.
Wine can be considered a compatibility layer created so that Unix-based Operating Systems can implement API’s – Application Programming Interface – of Windows platform-based Operating Systems.
2.2.3 VIRTUALIZATION OF STORAGE MEDIA
In this virtualization Monguinho (2012) cites the example of the use of storage that has been greatly increasing its use, due to the large flow of data needed to store. It is possible that information is recorded and shared in different storages in a more reliable and protected manner.
VS2 (2011) states that virtualizing storage, the complexity of information management reduces. While NGC (2011) argues that in this technique information, instead of emerging from the base, arises from the server. In the following item a brief comparison will be made between VMWare virtualization and XenServers.
2.2.4 VMWARE AND XENSERVER REVIEWS
This topic presents an analysis of the two most commonly used virtualization tools, VMWare and Xen. The two tools are differentiated by the feature of use in virtualization, VM is defined by being a total virtualization and Xen for being a para-virtualization. According to Mattos (2008) total virtualization is when the Visitor OS has a faithful copy of the host hardware and, according to Monguinho (2012), para-virtualization is when the Operating Visitor OS is emulated on a virtual machine, similar to physics, but not identical.
According to Silva (2007) VMWare can be considered a layer between hardware/OS and virtualized systems. According to Barros (2012), VMWare is the most widely used virtualization software and its implementation can be carried out on all the leading sales servers in the market.
In Xen the virtualization app is installed directly on the hardware before the O, according to Bosing and Kaufmann (2012). According to Silva (2007) the Xen project aims to provide an infrastructure for distributed computing based on open source.
It is presented in Figure 7, a comparison of the two tools regarding the characteristics of their implementation. You can see and conclude that the Xen server has many more deployment advantages.
Figure 7 – Xen Server vs VMWare
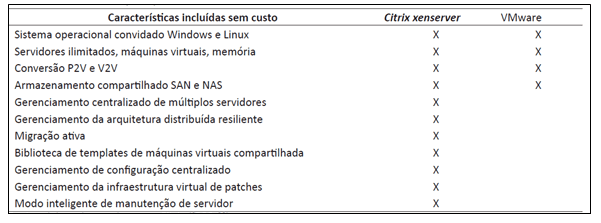
As the main difference between the two types mentioned, it is noteworthy that in VMWare the visiting OS has an equal replica of the host and in Xen it has to be modified to be used over the VMM.
2.2.5 ADVANTAGES AND DISADVANTAGES OF VIRTUALIZATION
Regarding the advantages and disadvantages, it can be said that there are some relevant points in each one both for the tools available and the type of virtualization to be used.
According to the authors Bosing and Kaufmann (2012), as an advantage can be cited the reduction of costs, with physical structure, energy consumption and cooling of the room, in operational requirements can be reported the optimization of resource, reliability of services, increased performance and time for repairs.
As a disadvantage, also according to authors Bosing and Kaufmann (2012), it can be cited high hardware cost, because it requires a larger configuration, since it hosts all machines in a single and enhanced security on servers.
Among the results presented and analyzed during the research, the use of virtualization brings those who are using much more benefits than losses. For, the reliability of the service, optimization of hardware resources and, at the same time, the protection of the environment are essential details that must be taken into account in people’s day-to-day lives.
The next chapter addresses how the development of this project will be conducted. The literary reviews seen in this, led the project at some important points to create the knowledge base of the work.
Recalling some important points to record, the levels of preparation of IT personnel in the organization, the architecture of the environment, the resources available for investment and especially what the real interest in transforming the organization into a sustainable company and concerned with the preservation of the environment.
2.2.6 RELATED JOBS
For research conducted in the sources of academic searches, it was used as a search keyword to obtain data regarding Green Information Technology, the following terms, Green IT, Deep IT, Green Tactical Incrementation IT, Strategic Green IT and Green IT, with the intention of determining which methods and practices are being studied and applied. In all, a review of about 30 studies was carried out, so a screening was carried out according to the application of a filter of the citation number, to select only the most relevant works. The result can be checked in Table 1.
| Table 1 – RESULT OF ACADEMIC DATA ANALYZED – GREEN TI | |||
| Author | Green IT Level | Adopted Practices | Term |
| Gianelli (2016) | 1. Tactic
2.Strategic |
1.1 Turning off computer monitors;
1.2 Turn off the lights; 1.3 Refrigeration; 1.4 Disposal of Obsolete Equipment; 2.1 Replacing Computers |
Green IT |
|
Neto, (2010) |
Tactic | 1. Change google layout colors; | Green IT |
| Rech (2014) | Tactic | 1.1 Creation of a website for dissemination of good green IT practices.
1.2 Controlling paper printing; |
TACTICAL GREEN IT |
| Projeto Blade / Banco Real (2007) | Strategic | 1. Replacement of 180 conventional computers for 160 Blade-PC. | Strategic Green IT |
| Menezes (2012) | 1. Tactic
2. Strategic 3. Deep IT |
1.1. Evaluation of energy control via software;
1.2 Disposal, Collection or donation of junk mail; 2. GED, electronic document management system; 3.1. Consolidation of Servers; 3.2 Server Virtualization; 3.3 Replacing servers with Blades; |
Deep IT |
| Nunes (2012) | Tactic | 1. Questionnaire for analysis of practices that are being used | Green IT |
| Vimercatit (2013) | Tactic | 1. Questionnaire for the evaluation of Green IT practices Adopted, and instructions with new practices; | Green IT |
| Ramalho (2010) | Tactic | 1. Change in people’s behavior on a day-to-day basis, to adopt a sustainable posture; | Green IT |
| Villarreal (2012) | Deep IT | 1. Offer a flexible and efficient computing environment (green clouding computing); | Deep IT |
Source: Author.
The end of this first generated report was possible to design a visualization with the activities of IT practices most performed in the molded work. The result is shown in Table 2.
Table 2 – Key Green IT Practices
| List by Levels | Times |
| Tactical Incrementation
Awareness Programs Correct Disposal Energy Efficiency Assessment |
12 7 3 2 |
|
Strategic Replacing Computers Operational Resource Management |
3 2 1 |
|
Deep IT Change of the Technology Park Replacing Servers for System Virtualization |
4 2 2 |
Source: Author.
After reviewing these works, the opportunity arose to carry out a strategic green IT implementation through a case study, where server virtualization was applied, in order to seek energy efficiency. And the results of these studies show, which methods of Green IT have been worked on in the scientific community and that the related work helped in the definition of the methods for the implementation of Green IT in the case study. In the next stage of the work, an analysis will be carried out on top of the proposed case study.
3. SEARCH METHOD
3.1 RESEARCH DESIGN
To develop this work, an exploratory qualitative research was carried out, with the objective of knowing which techniques and methods are being adopted by the academic community in relation to the use of server and application virtualization through practices adopted in the Green IT performing a bibliographic review and a case study, where these practices could be observed in the organization’s routine.
3.2 DEFINITION OF TARGET POPULATION OR UNIT OF ANALYSIS
In the planning of this work, a survey was conducted on how the academic community adopts and recognizes the importance of green IT application and how they approach the virtualization of servers in projects and studies. For this, two lines of work organization was created, conceptualization of virtualization techniques and Green IT.
Observing the detailed activities and environments analyzed in the reviewed studies, some discrepancies were obtained that was the determining factor for the direction of work, among them, poor management of available computational resources and high energy consumption of IT equipment. Detailed servers have different types of services running, they are, mail, web, files, backup, and own applications. Most remain connected 24 hours and some of these with idle hardware, it is thus defined the equipment that was designed to have a performance capacity that must be subjected in its activities and is not being used completely.
With the case study, an analysis was carried out in an organizational environment, in a company called X. This company is considered as a cell that manages the technological park of your region and at the same time provides support to IT managers of each location. In the company is available the following equipment for application of the study: 10 computers of the all in one model, 3 desktop computers complete with Core 2 Duo processor and 250 Watt source and 12 Rack servers.
A total of 13 people work in the sector, most of them being technicians who are computer-based or at least have knowledge. It is estimated that a good amount of them may be interested in sustainability in IT, making an alert for care with waste in information technology.
As for servers, the company has several, and with different types of services running, are they, mail, web, files, backup and applications unique to the company, all remain connected in the period of 24 hours ensuring the availability of the asset.
In this sector there is a daily administrative planning for activities performed, so you can design a schedule of schedules, tasks and procedures for each equipment.
In the case of servers, there were some with hardware of enough processing and storage capacity, which was not being used even half of its capacity. With this, a redistribution of services was made by applying systems virtualization methods. Thus this project covered the realization of the application of virtualization of servers, this action happens at the strategic level of Green IT.
3.3 TECHNIQUES OF DATA COLLECTION AND ANALYSIS
For the bibliographic research, a search was carried out in the main search engine sources, such as Google Scholar and IEEE, in order to search for the most cited articles, cases, works and projects. The main words and expressions used as a reference to perform data collection on the sites were: Virtualization of Green IT Servers and Sustainability.
For the case study, a documentary research and an analysis and survey of environmental data were carried out, containing data related to the methods and characteristics of computer equipment.
So we chose to transcribe and organize the results obtained within performance charts, in the form of columns. The metrics used for this were: Types of Services Adopted, Type of Virtualization, Benefit of the application.
4. ANALYSIS AND DISCUSSION OF RESULTS
The classification of the virtualization used in this work is based on the following categories: Application Virtualization (VA), Storage Media Virtualization (VMA), and Operating Systems Virtualization (VSO).
Regarding the Green IT classifications used in this work, it is based on the definitions of Murugesan (2008). The author frames Systems Virtualization, at the Deep IT level, when there is a need to restructure the technology park and when there is redistribution of existing services and equipment at the strategic level.
So, based on these classifications, this research is defined at the level of Virtualization, such as Virtualization of Operating Systems, where there is a virtual machine with Operating System and Application for each Host, and at the Green IT level, as Strategic Green IT, because even if there is a virtualization of servers there was no acquisition of any new equipment and neither a restructuring of the infrastructure of the server environment. Of the four equipment that had its service virtualized, three of them were turned off and one, the hardware, used for virtualization. As a benefit of the disconnected servers, in addition to the energy efficiency achieved, a contingency of virtualized services was carried out.
The following are the steps of the configuration plan that was performed during the execution of the case study.
4.1 CONFIGURATION PLAN
To facilitate and highlight the most important parts in the execution of the case study were divided into three steps: Step 01 – Requirements Survey, Step 02 – Environment Analysis and Step 03 – Execution, thus forming the Configuration plan.
4.1.1 STEP 01 – SURVEY REQUIREMENTS
All the steps were very important for carrying out the Configuration Plan, but this in itself is very sensitive, because it is a prerequisite for the other steps. In this step, all environmental data were collected in relation to the assets and services being used.
First, in this step, an analysis of the environment was performed, observing which services were being used individually and which did not require more than half of the performance availability of the hardware equipment that is hosted. From experience, preference should be given to an application server, such as a web application server, a backup server, that is scheduled to operate at a certain time of day when there is not much traffic on the network. On the other hand, servers with services that require high hardware performance, such as the file server, which has in addition to a domain controller, also has a user manager, should be avoided, as it can derail virtualization.
In a second moment, the capacity of each equipment was surveyed, such as processing capacity and storage. Another important aspect that should be taken into consideration is specifying the power source, whether it is connected to some battery bank or just nobreaks.
Finally, a survey of the data of the operational equipment used by the users was carried out, as they are also responsible for a good part of the daily consumption of electricity.
During the execution of step 01, it was necessary to create a table containing the hardware list of the servers and the energy consumption of each in KWh, this monitoring was visualized in Za[3]bbix at a time of peak daily use of the services of the servers.
To find out the peak period of resource utilization offered by the servers, it had two modes. One was the network traffic analysis graph performed by Embratel and the other was the graph generated by zabbix application. Soon after it was necessary to detail the services used and on which hardware were being hosted. Tables 3 and 4 show the result achieved at the end of the execution of step 01, highlighting that the two servers highlighted in bold in table 3 had their services virtualized.
Table 3 – Hardware List / KWh Consumption
| List by Groups | Qty | Kwh |
| Servers | ||
| 1. HP Proilant DL120 | 6 | 0,36 |
| 2. IBM X3650 M3 XEON | 2 | 0,32 |
| 3. IBM STOR WIZE v3700 | 1 | 0,29 |
| 4. McAfee WBG4000 | 1 | 0,28 |
| 5. DELL POWER EDGE R710 | 2 | 0,14 |
| OPERATING EQUIPMENT | ||
| 6. Lenovo ThinkCentre All-in-One A70z | 10 | 0,11 |
| 7. Lenovo M93p Desktop | 3 | 0,24 |
Source: Author.
Table 4 – List of Services by Assets
| List by Groups | Type |
| Servers | |
|
File Server (SuseLinux + Samba +LDAP) |
1 |
|
File Server (SuseLinux + Samba +LDAP) 0 |
2 |
|
File Server (OracleLinux + Kerberos) |
1 |
|
Storage Server: STORAGE |
3 |
|
Backup Server (OracleLinux + Bacula) |
1 |
|
Application Server – GED (SuseLinux + SIGDEM) |
5 |
|
Web Service Application Server (SuseLinux + Apache + MYSQL) |
1 |
| Drupal Service Application Server (OracleLinux + Apache + Postgres) | 2 |
|
Proxy Service Server: (RedHat+McAFee) |
4 |
| Service Server DNS – (SuseLinux) | 1 |
|
Mail Application Server: (SuseLinux + LotusNotes) |
5 |
|
BD Service Application Server (CentOS + SQL) |
1 |
| OPERATING EQUIPMENT | |
| Workstations – Users | 6 |
| Workstations – Supervisor | 7 |
Source: Author.
After the survey of data on the available equipment and the possible services to be virtualized, performed in step 1, the next step began. Step 02 consisted of checking and defining which equipment was idle and with the possibility of running another service together.
4.1.2 STEP 02 – ENVIRONMENT ANALYSIS
In this stage, the analysis of the result generated in the previous step was performed. It was then necessary to make a marking of the services that would be virtualized and what equipment would host them. For the choice of equipment that would host virtualization, we opted for the one with the highest processing capacity.
First, services that had affinity were marked, without mixing the services that required greater availability, such as the file and mail server (with web application). To choose the hardware, the best performance was chosen, in this case, the Type 02 (IBM X3650 M3 XEON).
The result of step 2 is presented in Table 5, with the services and equipment that have been virtualized.
Table 5 – Virtualization Services and Hardware
|
Virtualization Services Backup Server (OracleLinux + Bacula) |
| Web Service Application Server (SuseLinux + Apache + MYSQL) |
| Drupal Service Application Server (OracleLinux + Apache + Postgres) |
| BD Service Application Server (CentOS + SQL) |
|
HARDWARE de Virtualization IBM X3650 M3 XEON |
Source: Author.
With the performance of step 2, it was possible to reduce from four equipment to only one. This indicates that the reduced energy consumption was 1.04 KWh calculated to an estimated 0.36 KWh. And the reduction was 0.36 KWh (Backup Server), 0.36 KWh (Web Server), 0.36 KWh (BD Server). This result was very important, considering that the project provides for the energy efficiency of IT equipment.
After the preparation of the execution plan, the implementation of the virtualization itself began. The result of this step is detailed in the topic below.
4.1.3 STEP 03 – EXECUTION
In this step, the planning of the previous steps was carried out, which demonstrates the Operating System Virtualization (VSO). In the new Virtualization Server, the Virtualization System available for the distribution of Suse Linux and the available IBM hardware was used. Figure 7 shows below how the virtualization architecture looked.
Figure 7 – Virtualized Server Architecture
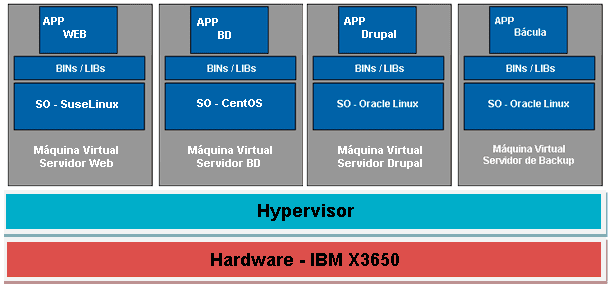
Source: Author.
As can be seen, 4 independent machines (SO + Service) have been created on the available virtualization server. To this do, a VM for each server was created by Hypervisor Xen (free Host OS service) for each server. Soon after configured the Web server services and Drupal, then the BD Server and last backup server.
After all the necessary configurations present in Appendix A, and verified that the service was operating normally (for this it is necessary to access the systems individually and check their integrity and availability already for the Bacula service it is necessary to check the status of the Director), then the energy consumption of this equipment was analyzed again, and oscillations of the peak of KWh were observed , which ranged from 0.32 to 0.39. This very attractive result for the company.
After performing the 3 steps, in order to ensure more reliability in the results of the plan, it was evaluated which metrics would be appropriate to use to evaluate the result of energy efficiency obtained with the virtualization of servers.
4.2 METRICS TO EVALUATE THE PLAN
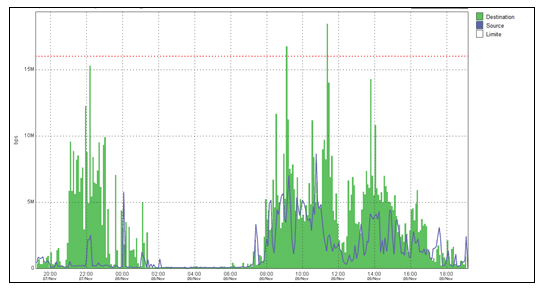
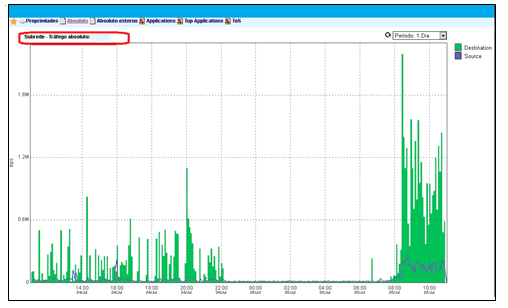
A measurement of data traffic on the network was performed in the company in order to increase the speed of contracted bandwidth. This process was divided into two moments, one for measuring external access traffic and the other for internal access traffic. The monitoring of external traffic was carried out by embratel, which provides the dedicated access links and for internal monitoring, TRAFip[4] and Zabbix were used.
During the measurement of data traffic used it was possible to observe the peak times to which the availability of local services was required. For the purpose of the case study, the information generated by Embratel and the information generated in Zabbix were considered.
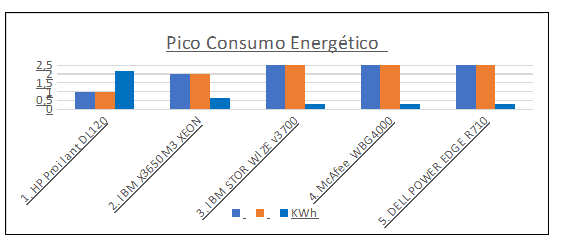
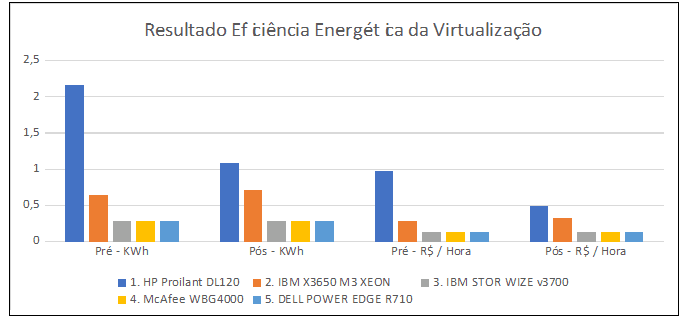
For evaluation of the result is shown in graphs 1, 2 and 3 the energy consumption of the servers during the peak use of the services. For all servers, the peak access considered is calculated by TRAFip and Zabbix, during a random access, within the quadrant of highest traffic, defined by them, between 08 and 11 o’clock.
Graph1 shows consumption before virtualization. Analyzing the graph, one can observe the high energy consumption of the servers.
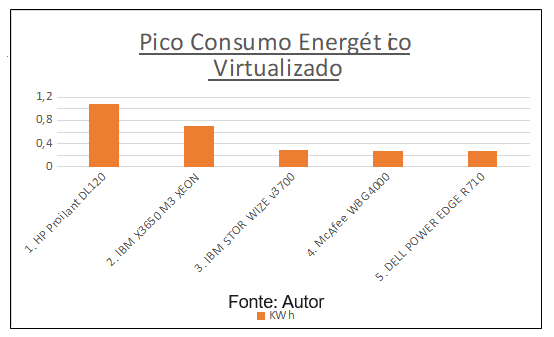
Graph 1 – Peak Energy Consumption Pre-Virtualization
Source: Author.
Graph 2 shows the consumption of KWh after virtualization of services. Analyzing the graph, one can observe the reduction of the energy consumption of the servers, achieving the energy efficiency of the services offered
Graph 2 – Peak Post-Virtualization Energy Consumption
Source: Author.
Graph 3 shows the difference in consumption in KWh and R$. The values are based on the tariff of the local electricity concessionaire, AES Sul.
Graph 3 – Results Achieved with Virtualization
Observing the result shown by the graph, there was a reduction in energy consumption by 1.01 KWh, generating a monetary savings of R$ 0.45 per hour of use during the peak processing hours of these equipments. Graph 4 shows the comparison of the results achieved in this work and in prado’s (2005) work.
Graph 4 – Results Comparison
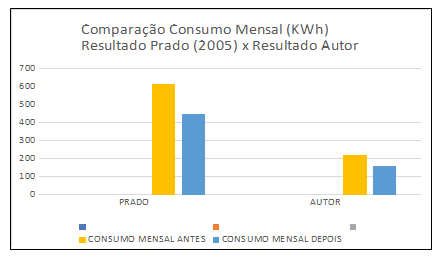
Prado (2005) showed a reduction of 154 KWh of energy consumption with the use of 47 assets, while in this work the result is calculated on the peak hours of equipment utilization and a monthly reduction of 60 KWh was obtained in 5 assets used in the action.
At the end of the execution of the operating system virtualization, carried out according to the steps oriented in this research, a reduction in electricity consumption can be observed, a result that achieves the objectives of green IT, which aims at the energy efficiency of computer equipment.
4.3 SUMARIZING CONFIGURATION PLAN
Table 4 summarizes the application of procedures from prerequisites to virtualization, from the steps listed in it it is possible to apply the research proposal.
As a recommendation, special care is recommended at step 01, as this is where the survey of existing IT requirements and assets takes place in the chosen environment as well as the performance it has. Not least, pay close attention to step 03, which is necessary to have a slightly more technical knowledge, because in it are carried out the transfers of the services used for the Virtualized Equipment. In step 06, a little more administrative, the evaluation of the chosen method occurs through defined metrics.
Table 4 – Practical Guide to Procedures for Virtualization
| Step | Action | Description |
| 01 | Lifting |
Create table listing the Equipment; Create table listing the Services; |
| 02 | Analysis |
Seek to Unify the available services; Select virtualization host equipment; Define services to be virtualized; Avoid giving one over processing load on the Hardware; |
| 03 | Run |
Configure Server to receive virtualization; Create virtual machine hosts; Start the installation normally of the services; |
| 04 | Use |
Test accessibility of virtualized services; Check if the transfer of services was carried out successfully; Check virtualization availability; |
| 05 | Evaluation |
Use metrics to calculate energy efficiency; Perform comparisons of results; |
Source: Author.
5. CONCLUSION
After this research, such influence is easily denoted that the use of IT exerts on people’s lives, organizations and the negative consequences that can occur according to their misuse. Through the literature review, it is perceived the need for new studies that enable methods and actions, so that people and companies can adopt practices to reduce impacts on the environment. It is very common to find in companies several computer assets, each being responsible for ensuring a different service, where in most cases the hardware idleness occurs. Thus, virtualization emerges, which has the purpose of using all the performance resource available by asset integrating services into a single, ensuring in addition to a saving of new investments in IT, a greater energy efficiency of the same that are in use.
This work sought to show how systems virtualization can be performed, in order to integrate the services offered in a computer company aiming at energy efficiency without compromising their quality and availability. During the performance of the procedures contained in the work, there was a limitation to measure the consumption of the equipment longitudinally, as a matter of the time available. Then it was decided to use a measurement information of energy consumption during the peak utilization of servers, based on the analysis of data traffic on the network.
As a result of this work, after implementing all the steps, it can be affirmed that there was a considerable improvement in the energy efficiency of hardware equipment hosts of services, this can be proven by the values obtained with the metrics used. Finally, this plan aims to contribute to some organizations acquiring the knowledge studied and implement actions based on virtualization and Green IT practices, improving the development of services and contributing to sustainability. As a proposal for future studies, there is the possibility of analyzing this plan with other metrics, applying a longer execution plan.
REFERENCES
ASSOCIAÇÃO BRASILEIRA DE NORMAS TÉCNICAS. NBR ISO 14001: Sistemas da gestão ambiental: Requisitos com orientações para uso. 2.ed. Rio de Janeiro: ABNT, 2004. Vii, 27p.
BALBINO, João Batista. “Virtualização, mito ou realidade?.” [S.I]: TI especialistas, 2013. Disponível em: <https://www.tiespecialistas.com.br/virtualizacao-mito-ou-realidade/>. Acesso em: 25 fev. 2019
BARROS, Jéssica Soares. Introdução à virtualização utilizando a ferramenta VMware ESXi 4.0. São Paulo, 2012. Disponível em: <http://www.devmedia.com.br/introducao-a-virtualizacao-utilizando-a-ferramentavmw are-esxi-4-0/24815>. Acesso em: 21 fev. 2019.
BOSING, Angela; KAUFMANN, Evelacio Roque. Virtualização de servidores e desktops. Unoesc & Ciência-ACET, v. 3, n. 1, p. 47-64, 2012.
CARISSIMI, Alexandre. Virtualização: da teoria a soluções. Minicursos do Simpósio Brasileiro de Redes de Computadores–SBRC, v. 2008, p. 173-207, 2008.
COMPUTERWORLD. 2008. Conheça o trabalho (gelado) de um gerente de TI no Polo Sul. Disponível em: <http://computerworld.com.br/gestao/2008/02/15/conheca-o-trabalho-gelado-de-um-gerente-de-ti-no-polo-sul>. Acesso em: 21 fev. 2019.
BRAYNER, Flávio Luiz de Azevedo; RAMOS, Paulo Gustavo Sabino; BRAYNER, Patrícia Verônica de Azevedo. TI VERDE: Sustentabilidade na Área da Tecnologia da Informação. Simpósio Nacional de Saúde e Meio Ambiente. 2013.
DOROW, Emerson. Base de Conhecimento – Um importante ativo de TI. 2013. Disponível em <http://www.governancadeti.com/2013/06/base-de-conhecimento-um-importante-ativo-de-ti/>. Acesso em: 21 fev. 2019.
DUARTE, Otto Muniz. Trabalho de Redes de Computadores I. Disponível em <http://www.gta.ufrj.br/grad/09_1/versao-final/virtualizacao/>. Acesso em: 21 fev. 2019.
ENERGY, STAR. Energy Star®. History: ENERGY STAR, 2011. Disponível em <https://www.energystar.gov/ia/partners/publications/pubdocs/2011_AnnualReport_Final_low-res_12-13-12.pdf?635a-8632>. Acesso em: 12 mar. 2019.
SILVA, Rodrigo Ferreira da. Virtualização de Sistemas Operacionais. Petrópolis: Incc, 2007. Disponível em: <http://www.lncc.br/~borges/doc/Virtualizacao%20de%20Sistemas%20Operacionais.TCC.pdf>. Acesso em: 21 fev. 2019.
FERREIRA, Juliana Martins de Bessa; FERREIRA, Antônio Claudio. A sociedade da informação e o desafio da sucata eletrônica. Revista de Ciências Exatas e Tecnologia, v. 3, n. 3, p. 157-170, 2008.
FGV EAESP. Pesquisa Anual do Uso de TI nas Empresas, 29ª edição, 2018. Disponível em: <https://eaesp.fgv.br/sites/eaesp.fgv.br/files/pesti2018gvciappt.pdf>. Acesso em: 23 jan. 2019.
FURANO (QUÍMICA). In: WIKIPÉDIA, a enciclopédia livre. 2016. Disponível em: <https://pt.wikipedia.org/wiki/Furano_(qu%C3%ADmica)>. Acesso em: 21 fev. 2019.
GIANELLI, Álvaro. PRÁTICAS SUSTENTÁVEIS EM TI VERDE NO INSTITUTO FEDERAL DE SÃO PAULO: limites e possibilidades. SÃO JOÃO DA BOA VISTA, 2016.
GIDDENS, Anthony. O mundo na era da globalização. Editorial Presença, 2013.
HANDREN, Thiago. Virtualização de Servidores. DevMedia, 2014. Disponível em <http://arquivo.devmedia.com.br/artigos/Thiago_Handren/image2.png>. Acesso em 14 mar. 2019.
ISO, ABNT-NBR. 14001: Sistemas de Gestão Ambiental-Especificação e Diretrizes para Uso. ABNT-Associação Brasileira de Normas Técnicas, Rio de Janeiro, RJ, 1996.
JACOBI, Pedro et al. Educação ambiental, cidadania e sustentabilidade. Cadernos de pesquisa, v. 118, n. 3, p. 189-205, 2003.
LUNARDI, Guilherme Lerch; SIMÕES, Renata; FRIO, Ricardo Saraiva. TI VERDE: Uma Análise dos Principais Benefícios e Práticas Utilizadas pelas Organizações. Revista Eletrônica de Administração, v. 20, n. 1, p. 1-30. 2014.
MATTOS, Diogo Menezes Ferrazani. Virtualização: VMWare e Xen. Grupo de Teleinformática e Automação da UFRJ, p. 13, 2008.
MCAFEE; ICF INTERNACIONAL. The Carbon Footprint of Email Spam Report. 2008. Disponível em: <http://img.en25.com/Web/McAfee/CarbonFootprint_12pg_web _REV_NA.pdf>. Acesso em: 21 fev. 2019
MICROSOFT. Microsoft System Center Virtual Machine Manager 2007. 2007. Disponível em: <https://slideplayer.com.br/slide/1692105/>. Acesso em 15 mar. 2019
MONGINHO, Mário Augusto Bragado. Estudo do impacto da virtualização de hardware num nó de uma organização distribuída: O estudo de caso da Administração Regional de Saúde do Alentejo. Setubal, 2012.
MONTEIRO, Miriam de Souza; ROMITO, Paulo Roberto; ABREU, Alice Fernandes de. Ti Verde–Implementação de Práticas Sustentáveis em Empresa de Tecnologia da Informação. IX SEGeT – Simpósio de Excelência em Gestão e Tecnologia. 2012.
MURPHY, A. (2008). Virtualização Esclarecida – Oito Diferentes Modos. Disponível em: <http://www.f5networks.com.br/pdf/white-papers/virtualizacao-esclarecida-oito-diferentes-modos-wp.pdf>. Acesso em: 21 fev. 2019.
MURUGESAN, San. Harnessing Green IT: Principles and Practices, 2008.
NAHUZ, Marcio Augusto Rabelo. O sistema ISO 14000 e a certificação ambiental. Revista de Administração de Empresas, v. 35, n. 6, p. 55-66, 1995.
NETO, Roque Maitino; FAXINA, João Marcos. TI verde e sustentabilidade. Revista de Ciências Exatas e Tecnologia, v. 7, n. 7, p. 159-174, 2014.
NORCIA, Hamilton Junior de Souza; BORTOLUZZI, Flávio; JUNIOR, Nelson Tenório. Estudos de Casos em Tecnologia da Informação Verde. Anais Eletrônico. VI Mostra Interna de Trabalhos de Iniciação Científica. Publicado em 2012.
OMENA, Flávio Azevêdo de. Meio Ambiente Natural: normas jurídicas e procedimentos policiais para sua preservação. Polícia Militar de Alagoas, Maceió, 2008.
PEROSINI, Gladison Luciano. Inclusão Digital e Tecnológica na Sociedade da Informação. Autografia, 2017.
PETRÓ, Gustavo. Brasil terá um computador por habitante em 2016, prevê FGV. Disponível em: <http://g1.globo.com/tecnologia/noticia/2013/04/brasil-tera-um-computador-por-habitante-em-2016-preve-fgv.html>. Acesso em: 22 fev. 2019.
PINTO, TM da C.; SAVOINE, M. M. Estudo sobre TI Verde e sua aplicabilidade em Araguaína. Revista Científica do ITPAC, v. 4, n. 1, p. 11-12, 2011.
PRADO, André Alves. Economia do consumo de energia em monitores de microcomputadores. Janus, v. 2, n. 2, 2008.
RECH, Juliane; SOARES, Silviane Lawall; LENGERT, Norberto. WEBSITE PARA DIVULGAÇÃO E APLICAÇÃO DE BOAS PRÁTICAS DE TI VERDE WEBSITE FOR DISSEMINATION AND IMPLEMENTATION OF BEST PRACTICES IN GREEN IT. 3º Fórum Internacional ECOINOVAR Santa Maria/RS – 3 a 4 de Setembro de 2014.
ROMAN, G. Diagnóstico sobre la generacion de basura eletrônica. Instituto Politécnico Nacional México, Centro Interdiciplinário de Investigaciones y estúdios sobre Medio Ambiente y Desarrollo México D. F, 2007.
SANCHEZ, Joe. Free Citrix XenServer or Free VMware ESXi (xenserver vs esxi). Disponível em: <https://www.vminstall.com/free-citrix-xenserver-or-free-vmware-esxi/>. Acesso em 14 mar. 2019.
SANT’ANNA, Lindsay Teixeira; MACHADO, Rosa Teresa Moreira; DE BRITO, Mozar José. A logística reversa de resíduos eletroeletrônicos no Brasil e no mundo: o desafio da desarticulação dos atores. Sustentabilidade em Debate, v. 6, n. 2, p. 88-105, 2015.
SILBERSCHATZ, Abraham; GALVIN, Peter B.; GAGNE, Greg. Sistemas operacionais: conceitos e aplicações. Campus, 2001.
SIQUEIRA, Ethevaldo. Para compreender o mundo digital. Globo Livros, 2008.
SPANIOL, Bruna Paiani Nasser; ALBANO, Sebastião Guilherme. Por trás da tecnologia: uma análise das lógicas do mercado da informação. Temática, v. 12, n. 01, 2016.
TADER, Paul. Server monitoring with zabbix. Linux Journal, v. 2010, n. 195, p. 7, 2010.
TIBOR, Tom; FELDMAN, Ira. ISO 14000: a guide to the new environmental management standards. Ano 1996.
WATERS, John K. ABC da Virtualização. 2007. Disponível em: <ftp://ftpaluno.umc.br/Aluno/Godinho/Empreendedorismo2s2014/Apresenta%E7%E3 o%20Virtualiza%E7%E3o%20-%20Renata%20Felix%20%20e%20Osaias%20Saraiv a/Fontes/Abc%20da%20Virtualiza%E7%E3o.PDF>. Acesso em: 23 de maio de 2016.
APPENDIX A
SETTING UP A VIRTUAL MACHINE ON XENSERVER
Step 01 – Right-click the screen and go to the Terminal option and type yast2.
Step 02 – Go to the Virtualization / Create Machine menu.
Figure 8 – Yast configuration screen
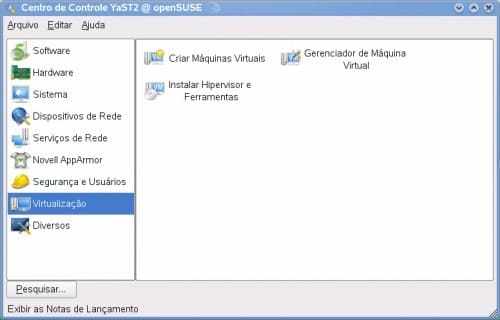
Source: Author.
Step 03 – Choose the Operating System type.
Step 04 – Choose Method (Full Virtualization)
Step 05 – The Values of the Partition table can be changed on the Summary screen.
Step 06 – Normal configuration of the services being installed.
APPENDIX B
RESULT NETWORK TRAFFIC ANALYSIS PERFORMED THROUGH TRAFIP
Graph 5 – Network Traffic Analysis – TRAFIP
APPENDIX C
RESULT OF NETWORK TRAFFIC ANALYSIS PERFORMED THROUGH ZABBIX
Graph 6 – Network Traffic Analysis – TRAFIP
APPENDIX D
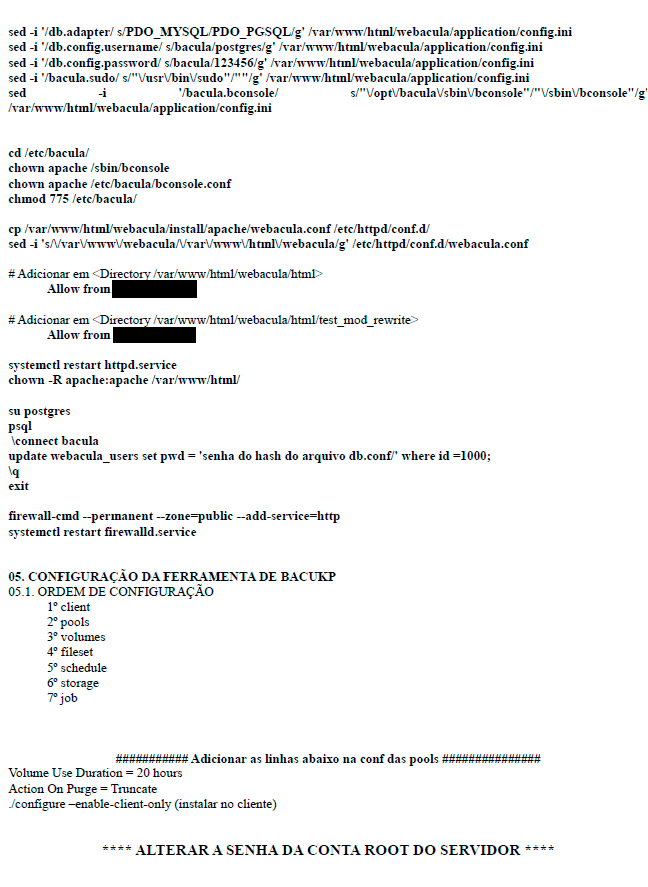
STEP-BY-STEP BACKUP SERVER IMPLEMENTATION
Figure 9 – Basic procedures
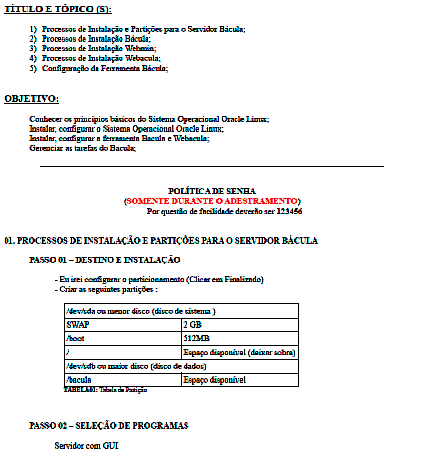
Figure 10 – Basic procedures
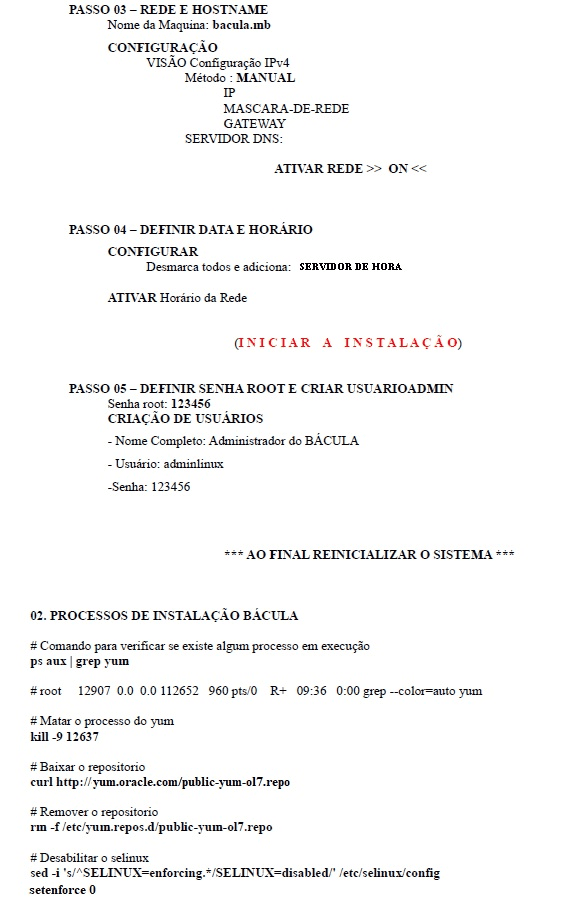
Figure 11 – Basic procedures
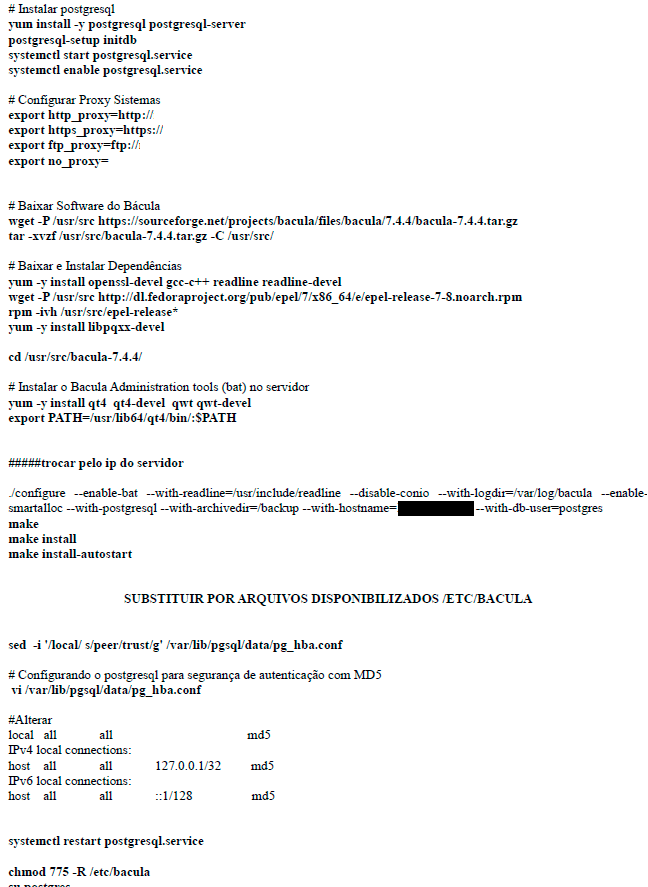
Figure 12 – Basic procedures
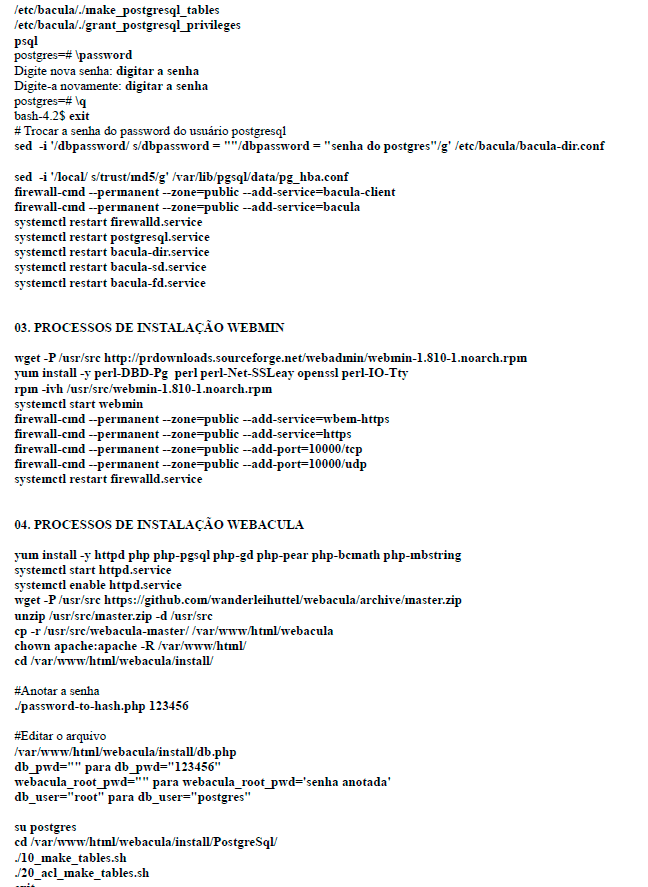
Figure 13 – Basic procedures
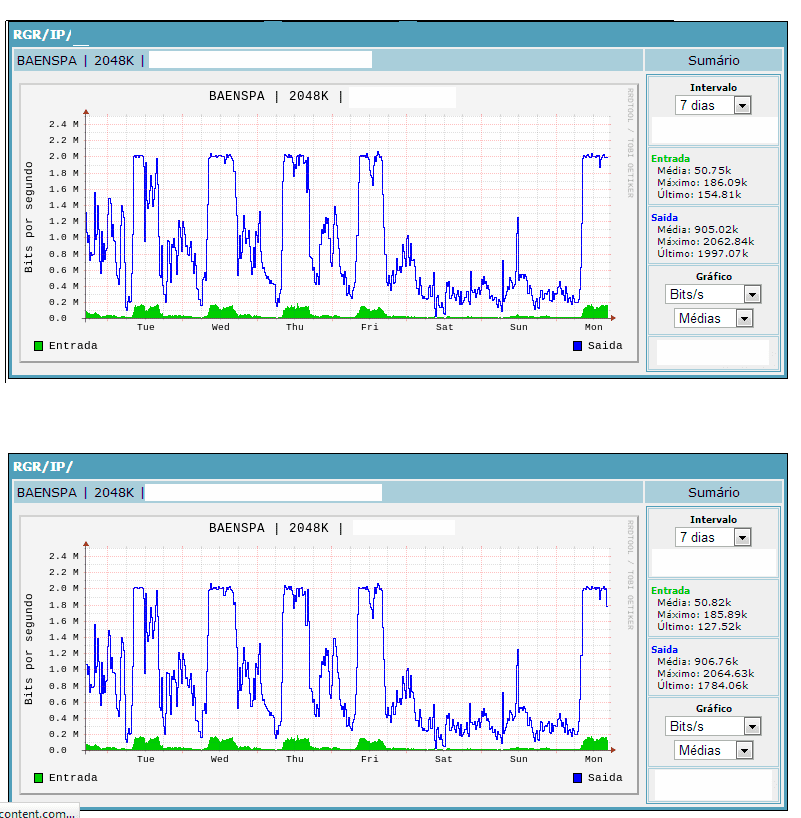
ANNEX A
RESULT OF THE ANALYSIS OF NETWORK TRAFFIC CARRIED OUT BY EMBRATEL
Figure 14 – Network traffic
ANNEX B
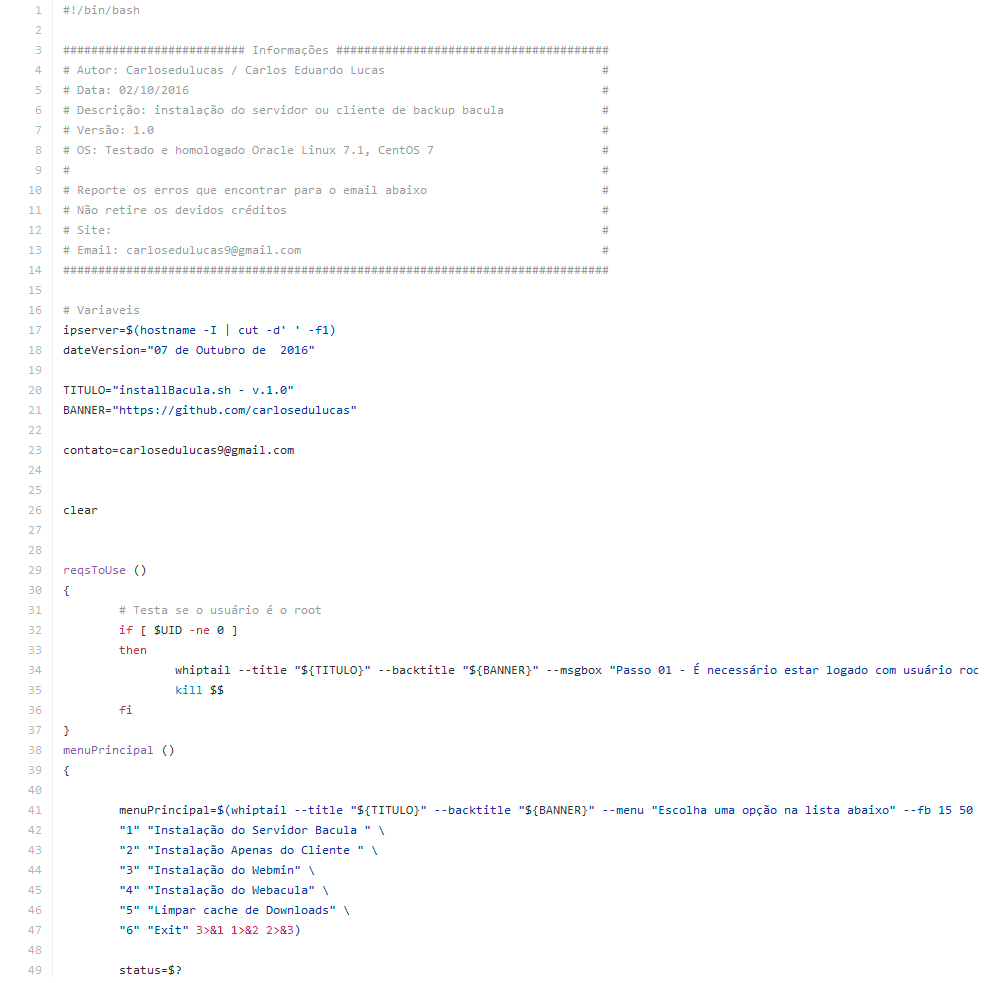
BACULA BACKUP TOOL AUTOMATIC INSTALLATION SCRIPT
Figure 15 – Bacula Installation Script
3. Zabbix – According to Tader (2010), is a software for monitoring various parameters of the network.
4. Network management tool that analyzes and characterizes IP traffic by exporting streams via NetFlow, JFlow, Netstream, IPFIX and sFlow protocols.
[1] Post-graduation in informatics – Faculdade Internacional Signorelli.
[2] Graduation in Information Systems – University of Rio dos Sinos Valley UNISINOS.
Posted: March, 2019.
Approved: July, 2019.