ORIGINAL ARTICLE
ALMEIDA, Hugo Leonardo Nascimento [1], CORREIA, Walter Franklin Marques [2], ALMEIDA FILHO, Adiel Teixeira de [3]
ALMEIDA, Hugo Leonardo Nascimento. CORREIA, Walter Franklin Marques. ALMEIDA FILHO, Adiel Teixeira de. Exploratory and correlation analysis on the impact of accessibility testing on PC software development projects. Revista Científica Multidisciplinar Núcleo do Conhecimento. Year. 08, Ed. 03, Vol. 03, pp. 45-62. March 2023. ISSN: 2448-0959, Access link: https://www.nucleodoconhecimento.com.br/computer-science/pc-software, DOI:10.32749/nucleodoconhecimento.com.br/computer-science/pc-software
ABSTRACT
The work consists of a theoretical introduction that conceptualizes software engineering, software development, testing, escaped defects, user experience, usability and accessibility. In order to conduct a research in the area of tests focused on accessibility, an analysis of real projects was proposed. Interviews were conducted with managers of software projects that are already in the market, extraction of data from the same projects, exploratory analysis of the data, correlation tests and structuring of the results found. At the end of the research, it was observed the relevance of some data and the significance of the relationship between them. From the results obtained, it is concluded the relevance of the construction of test cases for accessibility, as well as the factors that contribute to the teams to give due attention to accessibility tests, such as team composition and external collaborations.
Keywords: Software Testing, Accessibility, Development Project.
1. INTRODUCTION
There is a discussion about the concept of software engineering. Some associate software engineering with science, others with engineering. This question highlights the dual character of the software, in general. While software engineering considers the software process, which is configured in a process of product creation, the production characteristics are explicit, that is, engineering characteristics themselves. But, from another point of view, the competitive and commercial character, which expose the need for continuous and sequential improvements in the quality of the software process and the product, reveal the scientific context in which software engineering is presented (TRAVASSOS; GUROV; AMARAL, 2002).
In the area of software engineering, there are specific methodologies that lay the foundation for engineering and science. There are four important methods that assist in conducting experiments in software engineering, they are: the scientific method, the analytical, the engineering method and the experimental method (WOHLIN et al., 2000).
In order to develop an evidence base for knowledge and scientific intervention in the software development process, software engineering has experimentation as a way to validate the process (TRAVASSOS et al., 2008). In an analysis in the area of experimental software engineering (SJOBERG, DYBA; JORGENSEN, 2007), some challenges to be faced in the following decade were pointed out, thus aiming at the importance of experimentation in the context of software.
Amid the more specific challenges, there is a concern of researchers about the need to plan experimental studies more rigidly, especially in the broad consideration of the design details of study strategies, also called applicable experimental methods.
Different questions of arrangement are considered due to the conduct of study strategies, making all questions specific to the type of strategy chosen. The validity of the study may be threatened by a lack of observation of the main design details pertinent to the selected strategy. The resolution of this type of challenge requires explicit knowledge about the different existing study strategies and adequate availability of knowledge to the researcher, so that he can be assisted in the different common decision-making in this validation stage (SJOBERG, DYBA; JORGENSEN, 2007).
Within software engineering, software development is a subject that involves a lot of competitiveness with regard to the market. The more quality a system presents, the more space in the market the companies that develop it will have. Therefore, companies, in general, are investing a lot to ensure the quality of their products and customer satisfaction. Software engineering processes, such as RUP (Rational Unified Process®) (KRUCHTEN, 1998), are used during product development, with the purpose of ensuring quality, organization and more productivity. A part of software engineering that has already been pointed out as of essential importance is the discipline of testing (PATTON, 2005; PAN, 1999), which will be the main object of study in the present work.
The focus of software testing is to find defects in the product, so that the correction is made in a timely manner, so that the product reaches the customer. Tests take into account the specification, and, through the elaboration of the test cases, it is possible to reveal errors not yet identified. The projects studied in this publication are programs for PCs manufactured by a large multinational, containing the test stages in the development cycle. Knowing that defects exposed to customers are something very costly, the search for preventive solutions is done through testing, and your goal is to discover as many errors as possible. Within this context, the concept of escaped defects emerges (VANDERMARK, 2003). Escaped defect is a defect that, for various reasons, was not found by the test team during some stage of the process. This work proposes precisely the realization of an analysis of the data of the projects for PC, taking into account the work of the test teams , in order to mitigate as much as possible the number of defects escaped in the projects.
Amid the quality team’s test suite, there are specific tests that address usability and accessibility of the developed applications. Usability and accessibility, when well implemented, result in more efficient and more effective projects, which generate greater customer satisfaction and a greater reach of an audience that perceives, operates and understands interactive systems, regardless of the capacity of the people inserted in this public and the degree of disability that they may have.
The path to success of an interactive system can be facilitated according to practices about usability, accessibility and user experience. The set of these factors can be organized and evaluated through interventions and studies.
The full understanding that usability can be specifically an element of increased effectiveness, efficiency and user satisfaction, and that accessibility has a direct link on the ability of people with various degrees of disability to perceive, operate and understand interactive systems, will imply the adequate deepening of the proposed work.
The disciplines of design, accessibility, usability and user experience provide important subsidies so that new techniques and tools can be applied with the aim of increasing and improving interactive systems. The study of these techniques and tools will allow professionals such as developers, designers, designers, among others, to evaluate interactive systems with criteria at hand.
The user experience arouses a growing interest from the Human-Computer Interaction (HCI) community. Even though HCI seems to accept that only functionalities or usability principles are no longer sufficient, there is no coherent understanding of what the user experience actually is (HASSENZAHL, 2003). ISO 9241-210 proposes to define user experience as all aspects of the user experience when interacting with a product, service, environment, or facility.
According to ISO 9241-11, usability can be defined as the ability of a product to be used by specific users to achieve specific goals effectively, efficiently, and satisfactorily in a specific context of use. Following this concept, usability has three principles that define it. The first principle is effectiveness. A system is effective when it allows users to achieve their goals. The second principle is efficiency, which is the effort made to accomplish a task in the system. The third principle concerns user satisfaction (DIAS, 2003).
Accessibility is defined as a possibility and conditions of reach for the safe and autonomous use of urban spaces, furniture and equipment, buildings, transport and systems and means of communication by persons with disabilities or reduced mobility. Accessibility is part of the concept of citizenship, in which individuals have rights guaranteed by law that must be respected (LAMÔNICA et al., 2008).
The understanding of the listed concepts and the study of the techniques and methods of evaluation of the areas presented should be taken into account for the formulation of new methods of evaluation. Interface evaluation methods differ from each other in several respects. It is necessary to understand the different characteristics of each method, to define which one is the most appropriate to evaluate the interface of a software in a given context. The main differences between the methods are the stage of the software design cycle in which they should or can be applied (during the development cycle or after having the product ready), the technique used to collect the data (from interviews to experiments in laboratories), the types of data collected (quantitative or qualitative), and yet, the type of analysis performed (the evaluator can predict potential problems or interpret the data obtained) (PREECE et al., 1994).
Thus, it is intended, in this work, to use experimental software engineering techniques to study and extract data from real commercialized software projects, focusing on the accessibility tests found in the database of the projects and on all activities and resources that permeate the testing activity, through interviews, exploratory analysis and statistical tests.
2. MATERIALS AND METHODS
In this section, all the steps outlined and executed during the research will be described, detailing each step as it was performed.
The line of research in which this work is inserted is focused on the accessibility of digital products. In the search to provide an evaluative heuristic model to support decisions in accessibility of software products, considering this an initial phase of the work, we sought to document qualitative and quantitative findings of real projects to be able to prove the importance of accessibility care and to be able to sustain hypotheses that relate quantities of test cases, bugs and open tasks within the projects.
In the research methodology, it was followed by the application of parametric and non-parametric tests, correlating the quantitative data with the qualitative data extracted from interviews with the managers of the analyzed projects. After that, an analysis of the results and a synthesis of conclusions were made. A request was made for evaluation and authorization of submission of the findings by the participating companies.
The focus of the research was the projects for CP, from which the extraction and adaptation of the data will be presented, a survey of research questions, located in section 2.1 of this article, and the interviews with the managers. The confidentiality of the name of the analyzed projects was maintained, describing the database taking due care and making an exploratory analysis of the data in a quantitative way. There is no interest in exposing the projects. Thus, authorization was obtained to have access to the open activities of all PC projects developed by the companies analyzed, which ensured the continuation of this research.
2.1 INTERVIEWS WITH THE PROJECT MANAGER
With the thought that software projects, in general, have more quality and reach when they have elements of accessibility, it was necessary to do interviews with the managers of the software projects of a real company. All the company’s projects that had already been launched on the market were chosen, for reasons of secrecy and at the request of the company, which did not want to expose projects still in development. In addition to the interviews, it was possible to observe from within one of the teams of one of the products analyzed in order to understand the thinking of the stakeholders when dealing with accessibility.
In the observation stage, context notes were made, which ended up being corroborated with what was said in the interviews. In the interview stage, it was necessary to contact the people who managed the teams that worked directly with the products. One difference noted between the observations and the interview is that, when observing, the notes are related to the entire context of the team, about the approach used by the team itself in relation to the artifacts of the product. In the interview specifically with managers, the context may seem a little different, as it is the sole and exclusive view of the manager as an agent in that environment.
In this interview, managers were asked about the number of each type of professional in the project, team dynamics, meetings, changes during product development, the development process itself and the design patterns used. Managers of 5 projects were interviewed.
There was a concern to structure the interview so that the answers were well directed to what the interviewer proposed. Based on this, a guide for interaction with managers was created.
Due to the limitations of information that can be given and the confidentiality of the companies involved, only the location of the companies will be considered, for citation purposes (Pernambuco – PE and São Paulo – SP). Both companies work with the development of high-tech PC solutions in a distributed development environment.
The interview questions were:
1 – How many people are on the project team?
2 – How many developers do they have? How many are from the company in PE and how many are from the company in SP?
3 – How many testers? How many are from PE and how many are from SP?
4 – How many designers? How many are from PE and how many are from SP?
5 – What are the other participants/stakeholders of the project? How many are from PE and how many are from SP?
6 – How does the team dynamic work? Do you follow some kind of heuristic?
7 – How many and what are the project meetings?
8 – How many interns does the project have? How many are from PE and how many are from SP?
9 – How many fellows does the project have? How many are from PE and how many are from SP?
10 – How many residents does the project have? How many are from PE and how many are from SP?
11 – What changes occurred within the team throughout the project?
12 – How is the development process? What are the phases?
13- Is there any built-in design pattern?
2.2 DESCRIPTION OF THE DATABASE USED
For a quantitative and qualitative analysis of the impact of accessibility tests on PC software development projects, data were collected from a large software development company from all projects with these characteristics and that had an institutionalized attention to accessibility during development.
In all, 5 projects of the investigated company were considered to be included in the aforementioned characteristics. Table 1 below considers relevant information collected during data collection, which was done manually from the authorization given to it.
Table 1 – Data of the selected projects
| Project | Issues | Bugs | Contain “accessibility” bugs | Stories | Contain “accessibility” stories | Test cases | Contain “accessibility” test cases |
| P | 2386 | 827 | 63 | 21 | 8 | 502 | 65 |
| W | 1361 | 376 | 17 | 17 | 2 | 377 | 0 |
| M | 2287 | 893 | 39 | 117 | 10 | 887 | 1 |
| S | 5848 | 1688 | 51 | 135 | 24 | 1049 | 0 |
| G | 4653 | 1943 | 44 | 107 | 20 | 1021 | 0 |
Source: prepared by the authors.
To maintain the secrecy of the analyzed projects, a random letter is being considered to identify and differentiate the data. The relevant information extracted are: activities registered in the project management tool, bugs registered by the team, bugs that contain the identification of accessibility within itself, functionalities to be developed (user stories), functionalities that contain the identification of accessibility within itself, test cases and test cases aimed at accessibility.
The registered activities refer to any type of effort located and registered related to the analyzed project, which may be a software development activity, testing, DevOps, design, etc. Bugs logged by the team are defects found during the implementation and validation of tasks. Bugs that were identified as accessibility bugs were registered with a tag that so identified. They are bugs that imply in the perception, operation and understanding of people with various degrees of disability when having contact with the product. The functionalities are all possible actions within the developed program, therefore, the functionalities identified with the accessibility tag refer to options for monitoring people with disabilities in the context of the software. Test cases are the activities of testers in the project, so every accessibility test is a test related to these accessibility features.
Table 2 below describes the information collected in the interviews with the project managers, to endorse the quantitative information extracted in the project management tool and to make relationships in the crossing between all the data. In this table are being considered more team-oriented information (composition, dynamics, comments).
Table 2 – Characteristics of the teams of the analyzed projects
| Project | Team people | Developers | Testers | Designers | Others | Extern Team | Input/Output people | Design Patterns | Comments |
| P | 20 | 60% | 20% | 5% | 15% | 45% | increased 9 | ||
| W | 13 | 46,15% | 15,38% | 15,38% | 23,07% | 38,46% | 7 | Sharing sessions | |
| M | 11 | 54,54% | 18,18% | 9,09% | 18,18% | 45,45% | -2 | ||
| S | 29 | 55,17% | 27,58% | 6,89% | 3,44% | 34,48% | 5 | ||
| G | 40 | 60% | 25% | 2,5% | 22,5% | 40% | 6 | 4 |
Source: prepared by the authors.
2.3 EXPLORATORY DATA ANALYSIS
In the exploratory analysis of the data obtained from the projects, some relevant observations were made, which are shared here. For a better observation of the analyses, the data that were considered a key point for the comments were highlighted by color in Figure 1. Figure 1 consists of the joining of the data presented in the previous tables with the addition of columns illustrating the percentage of bug values in relation to the total of issues, accessibility bugs in relation to all bugs, user stories aimed at accessibility in relation to the total of stories and accessibility test cases in relation to the total of test cases created by the teams.
Figure 1 – Joining of the data collected by project
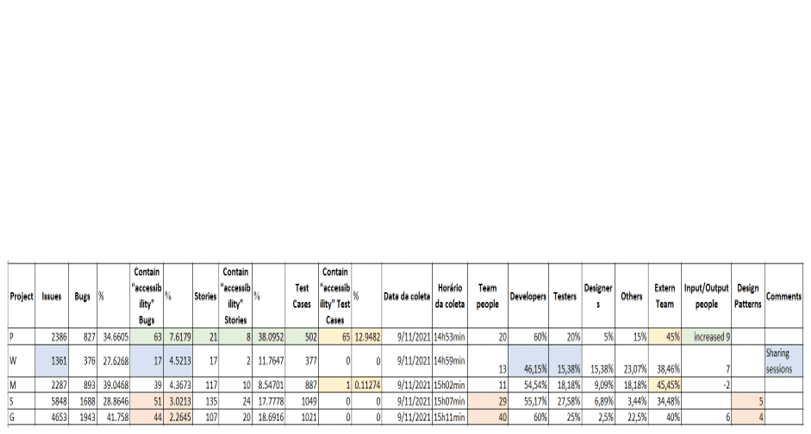
The project (P) that has, proportionally, more functionality and tests focused on accessibility is the project that registers the highest rate of accessibility bugs. That is, the more you care about accessibility, the more opportunities for corrections are identified. Here it is possible to discuss the importance of attention to accessibility tests, because without them, the number of defects that can pass through the team without being identified and, consequently, corrected tends to increase. Interestingly, this was the project that had the most increase of collaborators in the team during the development (green coloration).
The team (W) that contains fewer developers and testers, proportionally, is the team that registers less activity overall, but still opens accessibility-oriented bugs at a higher rate than the average of the projects analyzed, showing that there is no direct consequence between the number of developers, testers or technical staff and the rate of accessibility bugs found. This was the only team that mentioned the holding of sharing sessions among employees (blue coloring).
The two teams with the most external collaboration (P and M) are the only ones that have accessibility testing. This information leads us to believe that there is a positive external influence on accessibility care for this company that participated in the research (golden coloration).
The two projects (S and G) that contain the most contributors are the only ones that have cited the use of design standards, but have proportionally fewer accessibility bugs recorded. Here it is noticed that the technical knowledge and the approach of programming techniques and software architecture that were used have no direct relationship with accessibility (orange coloration).
2.4 PARAMETRIC TESTS
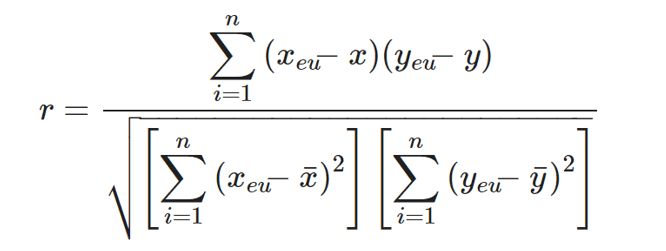
In continuity with the data analysis, it was proposed to perform statistical tests for the extraction of correlations between the data of the projects. The test chosen to measure the statistical relationship between the variables was Pearson’s correlation coefficient.
In descriptive statistics, Pearson’s correlation coefficient, also known as Pearson’s product momentum correlation coefficient, is denoted with the letter ρ , for a population parameter, and with r, for a sample statistic. It is used when both variables being studied are normally distributed. This coefficient is affected by extreme values, which can expand or dampen the strength of the relationship (MUKAKA, 2012). The formula for calculating the correlation coefficient of Pearson’s sample is shown in Figure 2.
Figure 2 – Pearson’s sample correlation coefficient formula
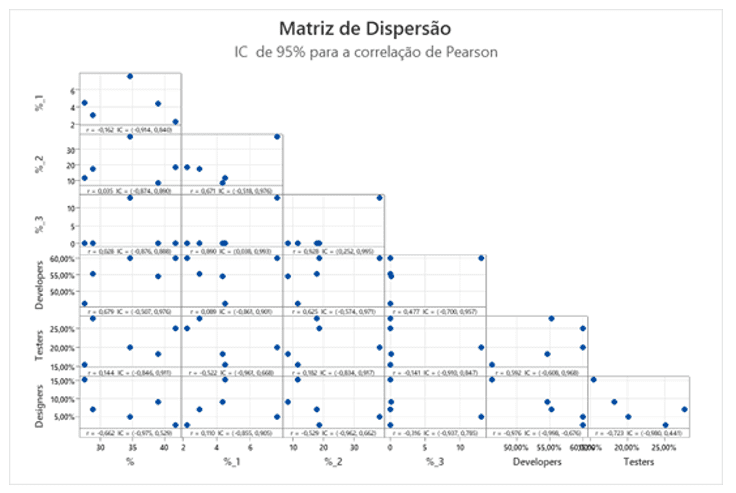
Associations were made between bugs, user stories and test cases linked to accessibility and the percentage of developers, testers and designers in the projects studied. Of the observations made, the main one is the correlation between bugs and test cases and between user stories and test cases, indicating that test cases constitute a central factor in relation to the number of activities that involve accessibility. Another interesting point is the correlations with the designers, which stand out statistically, showing more relevance in the teams in relation to the other groups of collaborators.
In an attempt to complement the tests with another type of test, this time a nonparametric hypothesis test, no significant results were found. However, the qualitative analysis brought more expressive results, which can be corroborated and complemented with the statistical correlations presented.
Below in Figure 3 is the result of the correlations through Pearson’s relationship test, represented by the dispersion matrix of the associated values. The values highlighted with %1, %2, and %3 represent the values of the columns of the same name in the columns in Figure 1. These are the percentages of accessibility bugs , accessibility user stories, and accessibility test cases, respectively.
Figure 3 – Scattering matrix of associated values
3. QUESTIONS RAISED ABOUT THE PROJECTS
In order to provide an evaluative heuristic model to support decisions on accessibility of software products, it was necessary to document quantitative findings of real projects. The focus was delimited on projects for PC, of which the modeling, data adaptation and the decision process were presented. This led to the compilation of a series of research questions to guide the analysis of the results, to be able to prove the importance of care with accessibility and to sustain hypotheses that relate quantities of test cases, bugs and open tasks within the projects.
These research questions, which are not classified according to their importance, are presented listed below:
1 – What characteristics of teams influence the amount of open bugs ?
2 – Which techniques used to minimize bugs had the best results?
3 – Is the impact of accessibility testing significant?
4 – Is it possible to predict bugging for accessibility in relation to the number of accessibility test cases of the project?
5 – Is there a relationship between the number of developers, testers or technical staff and the rate of accessibility bugs found?
6 – Is there an influence on accessibility care in projects that receive more external collaboration?
7 – Is the technical knowledge and approach of programming techniques and software architecture directly related to knowledge in accessibility?
The questions were formulated with the purpose of seeking to understand the correlation between the results of the quantitative data and the information collected from the managers.
4. ANALYSIS OF RESULTS
This research presented the analysis of the results obtained from the interviews with the managers of the selected projects; manual extraction of relevant information from the projects, directly from the institutional management and support tool of the participating teams; exploitation of the data in order to make qualitative observations of the information; and application of parametric test to the collected data. In total, 16535 software development activities were cataloged within 5 real projects of programs developed for PC, involving 113 professionals. Based on the presentation of the results, the set of research questions was verified.
The characteristic of the teams that influences the amount of open bugs is: the proportional number of developers and testers, that is, a higher percentage presence of designers in the project indicates a lower record of activities and, consequently, open bugs.
There is no indication of techniques used to minimize bugs, on the contrary, the project that proportionally presents more functionalities and tests focused on accessibility is the project that registers the highest rate of accessibility bugs. Research shows that the more attention is paid to accessibility, the more defects are identified and corrected by the team before going to market. Another relevant result is the indication that an increase in the team generates greater engagement to record more bugs and activities overall.
The impact of accessibility tests is significant, considering that the greater the number of tests focused on accessibility, the greater the number of accessibility defects found and, consequently, corrected in the project. This factor was found through exploratory analysis, and it is possible to perceive it in the parametric test.
Based on the results, it is possible to predict the opening of bugs for accessibility in relation to the number of accessibility test cases registered for the project, because of this proportional relationship.
According to the results, it is perceived that there is no direct consequence between the number of developers, testers or technical staff and the rate of accessibility bugs found, because the team contains fewer developers and tests. Proportionally, it is the team that registers the least activities overall, but still opens bugs aimed at accessibility at a higher rate than the average of the projects analyzed.
To answer one more research question raised, just realize that the teams with more external collaboration are the only ones that have accessibility tests. This information denotes that there is a positive external influence regarding accessibility care for this company that participated in the research.
The technical knowledge and approach of programming techniques and software architecture that were used have no direct relationship with accessibility, because the managers who cited the use of design patterns manage the projects that recorded fewer accessibility bugs proportionally.
5. CONCLUSIONS
Through the research carried out, it is possible to qualitatively infer some conclusions. A first conclusion concerns the composition of software development teams: the number of registered bugs tends to decrease as the teams have, proportionally, fewer developers and testers.
A second conclusion is the growing wave of remediation opportunities that can be identified from greater attention to accessibility testing. In this way the rate of escaped defects is reduced.
In general, it is thought that the greater the number of employees on the team during development, the greater the effort in creating the tests and in containing escaped defects, however, there is no direct consequence between the number of people and the rate of accessibility bugs found. At the same time, another conclusion is that technical knowledge and the approach of programming techniques and software architecture have no direct relationship with accessibility.
This research portrays a positive external influence on accessibility care for the projects analyzed.
Finally, it is perceived that the creation of accessibility tests is beneficial and effective, and that the greater the amount of tests focused on accessibility, the greater the amount of internally recorded corrections to be made and the less the amount of accessibility defects escaped.
For future work, a larger sample is suggested, with projects that are already on the market and projects not yet launched, in the process of development, in addition to extracting data from different companies to be able to compare and analyze the possible similarities and divergences and reflect on the influence of organizational culture on the development of accessibility tests.
REFERENCES
DIAS, Sérgio Roberto (coord.). Gestão de marketing. São Paulo: Saraiva, 2003.
HASSENZAHL, Marc. The Thing and I: understanding the relationship between user and product. In: BLYTHE, Mark A. et al. Funology: from usability to enjoyment. Dordrecht: Kluwer Academic Publisher 2003.
KRUCHTEN, Philippe. The Rational Unified Process. Boston: Addison-Wesley, 1998.
LAMÔNICA, Dionísia Aparecida Cusin et al. Acessibilidade em ambiente universitário: identificação de barreiras arquitetônicas no campus da USP de Bauru. Revista Brasileira de Educação Especial, v. 14, p. 177-188, 2008.
MUKAKA, Mavuto M. A guide to appropriate use of correlation coefficient in medical research. Malawi Medical Journal, v. 24, n. 3, p. 69-71, 2012.
PAN, Jiantao. Software Testing. 1999. Disponível em: http://users.ece.cmu.edu/~koopman/des_s99/sw_testing/. Acesso em: 15 mar. 2023.
PATTON, Ron. Software testing. 2nd ed. United States: Pearson Education, 2005.
PREECE, Jenny et al. Human-computer interaction. England: Addison-Wesley, 1994.
SJOBERG, Dag I. K.; DYBA, Tore; JORGENSEN, Magne. The future of empirical methods in software engineering research. In: International Conference on Software Engineering (ICSE), Minneapolis, p. 123-156, 2007.
TRAVASSOS, Guilherme Horta et al. An environment to support large scale experimentation in software engineering. In: 13th IEEE International Conference on Engineering of Complex Computer Systems, 2008.
TRAVASSOS, Guilherme Horta; GUROV, Dmytro; AMARAL, E. A. G. G. Introdução à engenharia de software experimental. Rio de Janeiro: COPPE/UFRJ, 2002.
VANDERMARK, Mary Ann. Defect escape analysis: test process improvement. In: Proceedings of the Software Testing Analysis and Review Conference, 2003.
WOHLIN, Claes et al. Experimentation in software engineering: an introduction. USA: Kluwer Academic Publishers, 2000.
[1] Master. ORCID: 0000-0003-4467-0113. LATTES CURRICULUM: http://lattes.cnpq.br/9433837114578364.
[2] Doctor. ORCID: 0000-0002-6491-9783. LATTES CURRICULUM: http://lattes.cnpq.br/3252289006108114.
[3] Advisor. Doctor. ORCID: 0000-0001-6069-3601. LATTES CURRICULUM: http://lattes.cnpq.br/9944976090960730.
Sent: January 26, 2023.
Approved: March 03, 2023.