ORIGINAL ARTICLE
LIMA, Leandro Jose Barbosa [1], HAMZAGIC, Miroslava [2]
LIMA, Leandro Jose Barbosa. HAMZAGIC, Miroslava. Greenhouse gases and air pollution: commonalities and differentiators. Revista Científica Multidisciplinar Núcleo do Conhecimento. Year 07, Ed. 09, Vol. 06, pp. 102-144. September 2022. ISSN:2448-0959, Access link in: https://www.nucleodoconhecimento.com.br/environment/green-house-gases, DOI: 10.32749/nucleodoconhecimento.com.br/environment/green-house-gases
ABSTRACT
Air Pollution causes about 4.2 million deaths per year, while Greenhouse Gases (GHG) causes global warming and climate changes. In this context, the present article has as its guiding question: what is relationship between Air Pollution and Greenhouse Gases? The objective of this study was understanding the relationship between Air Pollution and Greenhouse Gases (GHG). This was an exploratory, documental and literature review study based on published materials with the usage of statistical tools. As conclusion, published material presents what GHG and Air Pollution have in common, what are the differentiators and the perspectives for the future on these.
Keywords: Energy Transition, Air Pollution, Greenhouse Gases, Deaths, Carbon Footprint.
1. INTRODUCTION
There are many different perspectives to take, when looking at energy transition. It is important to focus on its main purpose: to prevent earth temperature rise and consequently generating climate change, that affects lives on many different ways, like: events of natural disasters, desertification, food production, floods, species extinctions, among other effects (HAINES, 2020).
Greenhouse Gases, GHG, are made of molecules that can keep the sun infrared reflected radiation from earth surface for long periods of time making earth temperature to increase, some gases have a bigger effect of reflection than other, or it can just stay in atmosphere for longer, therefore GHG have different potentials, and to make it simple, there are multipliers that can be applied to convert it on Carbon Dioxide Equivalent, or CO2e. The Carbon Dioxide was chosen to represent the group not because of its global warming effect, but because it is the most abundant (BABARINDE e ADIO, 2020).
Fluctuation in earth’s temperature have been normal over the years, and before man-kind earth temperature was extremely high, but as eras have passed the carbon that was present in atmosphere was collected, absorbed and stored underground. Anthropogenic activities mainly after the first industrial revolution have brought this carbon back to atmosphere, in order to generate progress for humanity. This has happened through innovations like steam vessels, automobiles, house heating, industries with increased productivity, and so on. Even before the industrial revolution, the usage of fire with charcoal has enabled house heating and food to be cooked. In summary, GHG were emitted to promote progress with the available technology (WHO, 2021a).
GHG are not the only effect of that progress. GHG could be actually associated with Air Pollution, which is also results in humanity’s progress. Air Pollution is known to cause about 7 million deaths every year, with about 4.2 million related to Outdoor Air Pollution only, the main focus of this study. Air pollution, such as GHG, comes from chemicals and particles in the atmosphere and these are due to natural or anthropogenic reasons. Natural sources of Air Pollution are volcanic eruptions, wildfires and allergens; anthropogenic pollutants are most related to energy use and agriculture, from GHG itself, Smog and Toxic Pollutants (WHO, 2021a). It is also important to highlight that temperature increase intensify some types of air pollution: this study intends to demonstrate the commonalities and differentiators between these two actors in global environment.
In this context, the present article has as its guiding question: what is relationship between Air Pollution and Greenhouse Gases? The objective of this study was understanding the relationship between Air Pollution and Greenhouse Gases (GHG).
2. LITERATURE REVIEW
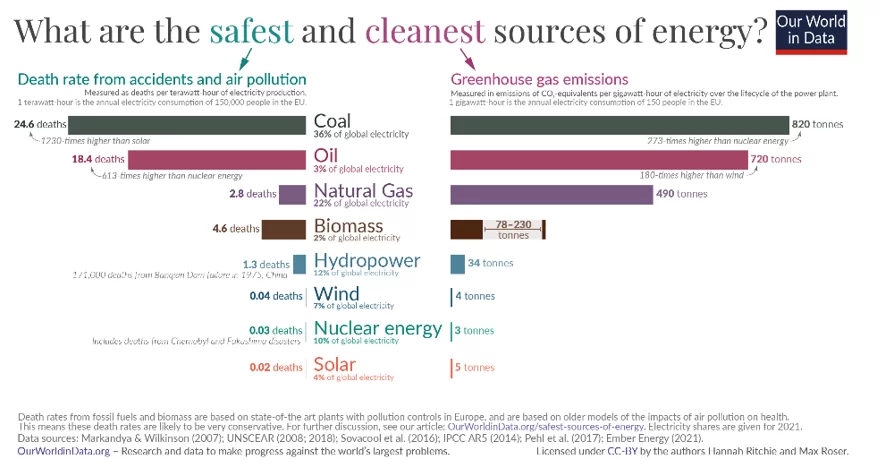
Electricity Generation is one of the top contributors to Air Pollution and GHG. Graph 1 shows deaths more directly related to Air Pollution and accidents in Terawatts-hour on the left and Tons of CO2 released on Gigawatt-hour on the right (RITCHIE, 2020).
Graph 1. Safety goal impact comparision between the air pollution and the GHG emissions for each energy source, as an example
2.1.1 AIR POLLUTION
Anything that changes the natural condition of the air is a potential polluter from particles to chemicals. The pollutant might be from natural to man-made sources, and the pollution might be indoors, inside residences, or outdoors, from the environment (UNITED NATIONS, s.d.).
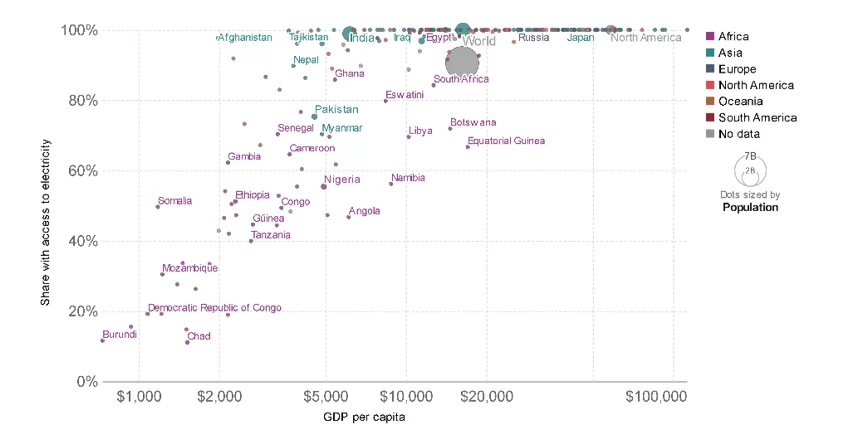
From WHO (2021a), only indoor air pollution causes about 3.2 million deaths every year (about 0.1% of total exposed), mainly because the affected group relies on non-advanced type of fuel/energy for cooking or heating, which includes the traditional use of biomass or other fuels: this affects mainly families on the limits of poverty. This group accounts for 2.4 billion people that currently are not included on the fortunate group, that might use modern and safer type of energy, sources which is one key link with GHG and Energy Transition (UNITED NATIONS, 2007). An aspect that some countries claim to keep running less emissions friendly electricity source to provide access to electricity to all population, what does not seem to be equally based as can be observed on Graph 2, what is in a way a safety goal.
The conscience around pollution effects started to be noticed as initially reported by Rachel Carson on the book Silent Spring, about the impact of pesticides, published in 1962, that triggered an important environmental movement. About 14 thousand scientists and other professionals in the United States joined for environmental protection, what lately lead to the creation of the National Environmental Act, a precursor of the US Environmental Protection Agency (EPA) in 1970 (LEWIS, 1985).
Graph 2. Percentage of population with access to electricity, Global Data 2020
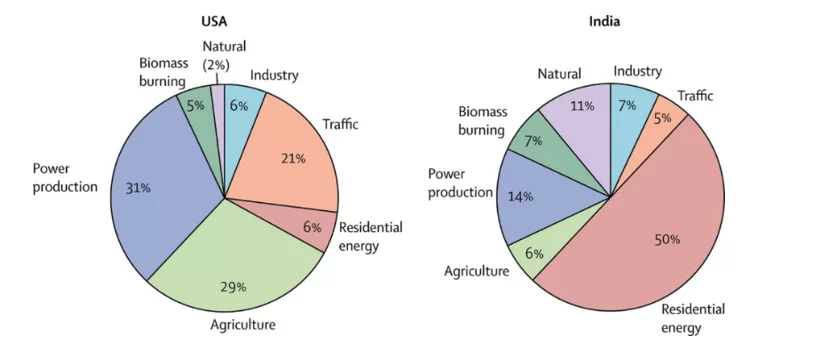
As demonstrated on Graph 3, and previously observed on Graph 2, in general, outdoor, or indoor air pollution fatalities changes from country to country, therefore from the nature of the source of air pollution, but the qualitative relationship between Air Pollution and GHG can be confirmed.
Graph 3. Sources of fatalities due to Air Pollution in USA and India, 2018
Common outdoor air quality pollutants include Carbon Monoxide, Lead, Nitrogen Dioxide, Ozone, Particular Matter (Coarse or PM10, fine or PM2.5 and ultrafine or PM0.1), and Sulfur Dioxide (WHO, 2021b; GOODKIND et al., 2019).
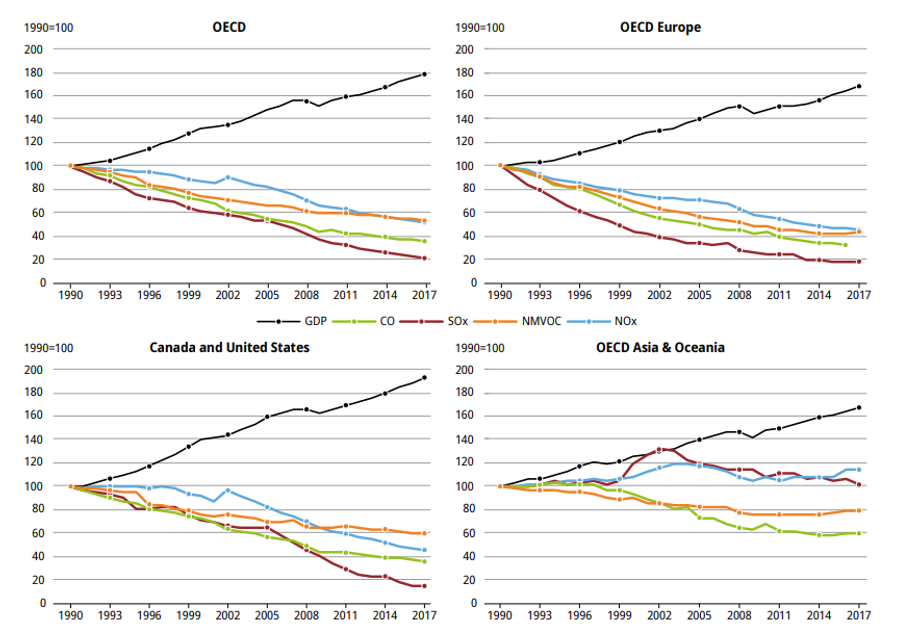
The Picture 1 illustrates in 4 Graphs how the Gross Domestic Product from OECD (The Organization for Economic Co-operation and Development) countries have decoupled their economic growth from the main pollutants, based on initiatives to reduce these pollutants from the air. In the top left, OECD, the data from the 37 countries can be observed, while the other 3 Graphs are more regional specifics trends. It is clear the difference in the effect on policies from some countries/areas against others when observing the difference in GDP to the Air pollutants in 2017.
Picture 1. GDP vs Pollutants
2.1.1.1 CARBON MONOXIDE (CO)
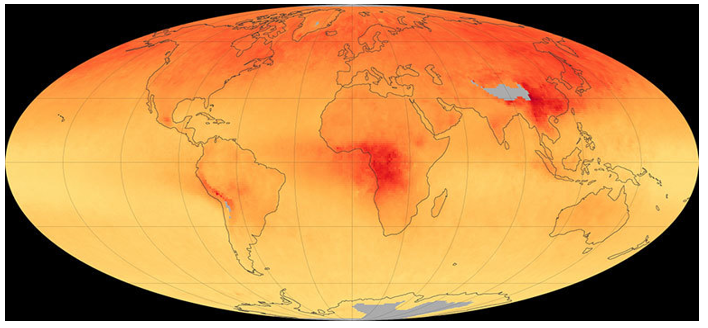
Carbon Monoxide is a residual from the usage of fossil fuels mainly (transport), as of on the burning of other materials, like the traditional use of biomass, mostly what could be called incomplete burn. Possible natural production of Carbon Monoxide is through wild forest fire and volcanic eruptions. CO could lead to confusion, drowsiness, and death, depending on the concentration (EPA, 2022d; EUROPEAN COMMISSION, 2022). The Graph 4 demonstrates a decline in the Carbon Monoxide Concentration Globally. These are measurements from the Measurements of Pollution in the Troposphere (MOPITT) sensor on the Terra satellite, which was launched in 1999. According to Voiland (2015) the decline in CO was mostly noted in the Northern Hemisphere, evident in Picture 2, and although CO is not a GHG, its presence is associated with Carbon Dioxide and Methane, as it is formed with the usage of fossil fuels.
Graph 4. Carbon Monoxide Concentration (parts per billion by volume)
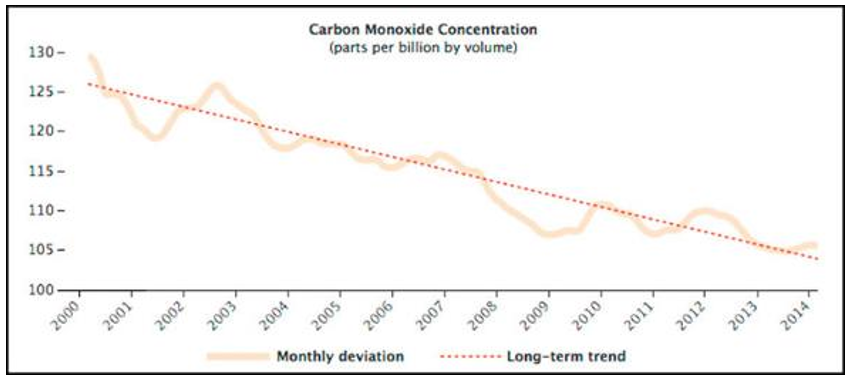
The reduction on its concentration is related to the technological innovation and regulations, as engines and power plants have become more sophisticated, over the years and countries with more developed technologies have achieved better results on Carbon Monoxide reduction, except for those that could also be impacted by forest fire, mainly wildfire (VOILAND, 2015).
Picture 2. Image from MOPITT sensor in 2014
2.1.2 LEAD (PB)
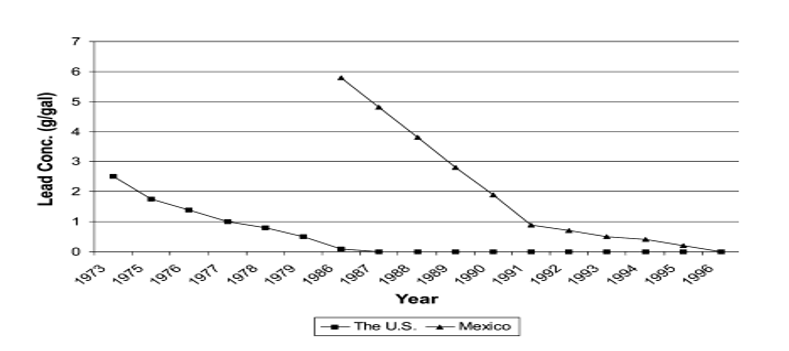
Lead exposure also have its sources on anthropogenic activities such as the usage of leaded paints, fuels, weld and soldering, materials, mining, and cosmetics. Its health effects include anemia, cancer, slowed growth, lowered IQ and hyperactivity, behavior, learning problems, as of decreased kidney function, cardiovascular effects, and reproductive problems (WHO REGIONAL OFFICE FOR EUROPE, 2001). The oil and gas industry has developed more efficient fuels and the usage of lead to increase the octanes from the fuel has stopped, as shown on Graph 5.
Graph 5. Comparison between Lead concentration on gasoline in the US and Mexico
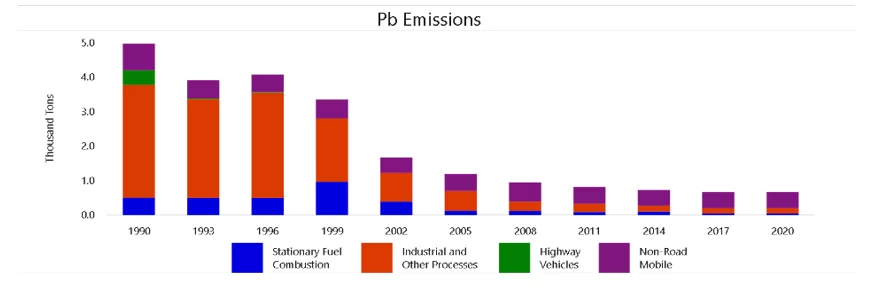
As shown in Graphs 6 and 7 legislation, control and technological evolution have proven to be able to reduce the levels of Lead (Pb) in the air, in the United States.
Graph 6. US Lead Emissions, in Thousands of tons by source
As it is possible to confirm from Graph 7, which presents the United States average from ten years: 2010 to 2020.
Graph 7. US National Average, Lead (μg/m3), as Air Pollutant, from 2010 to 2020
2.1.3 NITROGEN DIOXIDE AND NITRIC OXIDE (NO2/ NO)
It is also mainly related to the burn of fossil fuels at higher temperature. Nitrogen Dioxide (NO2) and Nitric Oxide (NO), both referred as NOX worsens respiratory diseases and reduces lung functions, giving respiratory symptoms like difficulty breathing, what also increases the susceptibility to respiratory infections. On its interaction with other air pollutants, it could worsen the effects and generate acid rain and is a precursor on the formation of Ozone, a major pollutant, component of smog (EPA, 2022b; AMERICAN LUNG ASSOCIATION, 2020).
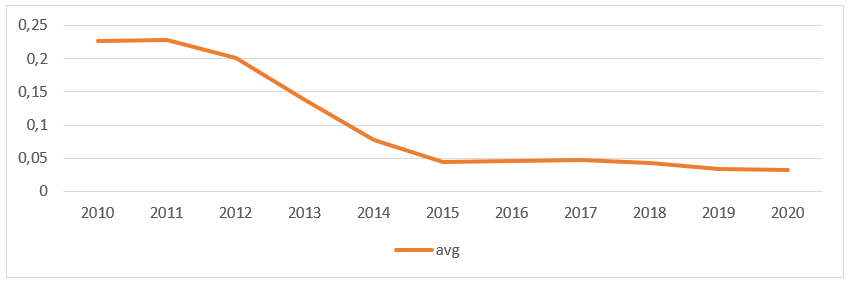
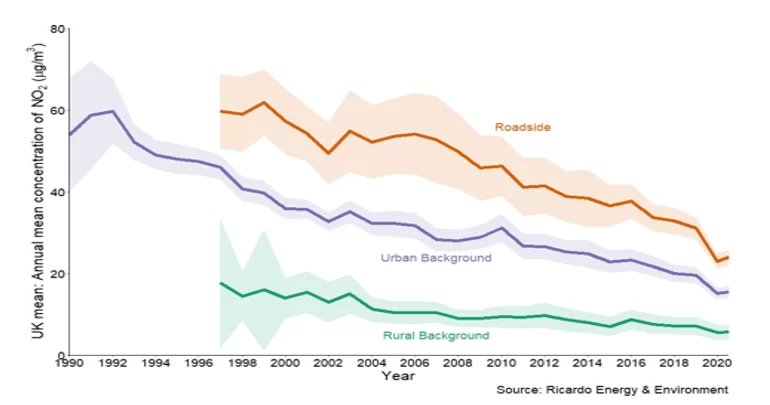
The overall success of the reduction in the United Kingdom, NOX emissions is more related to the reduction on using coal-fired plants and diesel cars, that even with improvements in technology and reductions on NOX emissions over the years have still been the major urban sources of these emissions (GOV.UK, 2022).
Graph 8. Average of Nitrogen Dioxide Content (μg/m3), UK 1990 to 2021
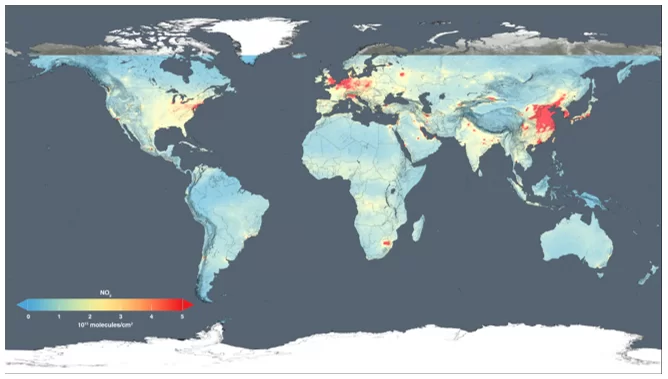
Picture 3 shows satellite observations about levels of Nitrogen Dioxide over 2014. These images review that area have established restrictions on these emissions or on the usage of fuels that release these types of pollutants have shown advancements in Air Quality (NASA, 2015).
Picture 3. Nitrogen Dioxide Concentration around the World over 2014
2.1.4 SOOT OR PARTICULATE MATTER (PM10, PM2.5 PM0.1)
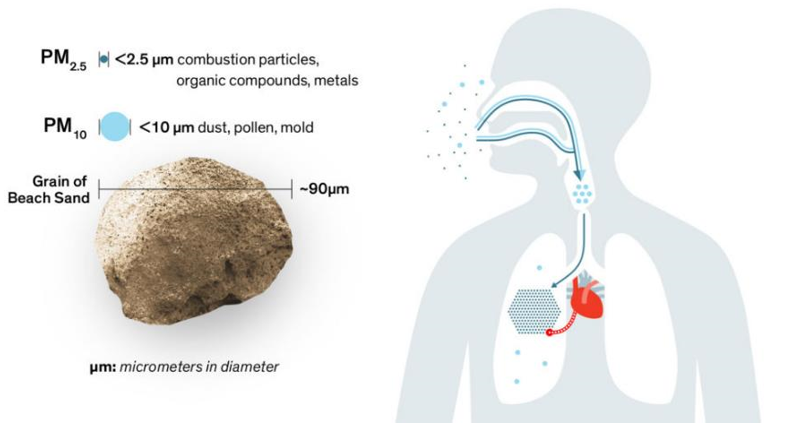
PM is a mixture from solid particles and liquids found in the air. It can be urban and non-urban sourced. The PM10, i.e., 10 micrometers and smaller (inhalable particles), the PM2.5, ie 2.5 micrometers and smaller (4 times smaller than PM10) and the PM0.1, ie 0.1 micrometer or smaller, could have its origin on many different sources, including powder from construction sites, unpaved roads, fires, and usage of fossil fuels. These inhaled particles can cause damages to lungs and on other organs as it enters the bloodstream (EPA, 2022e; WHO, 2021b). Picture 4 exemplifies the size comparisons between the particles and some known items like human hair or beach sand.
Picture 4. Size Comparison from PM10 and PM2.5 to Sand and Human Hair
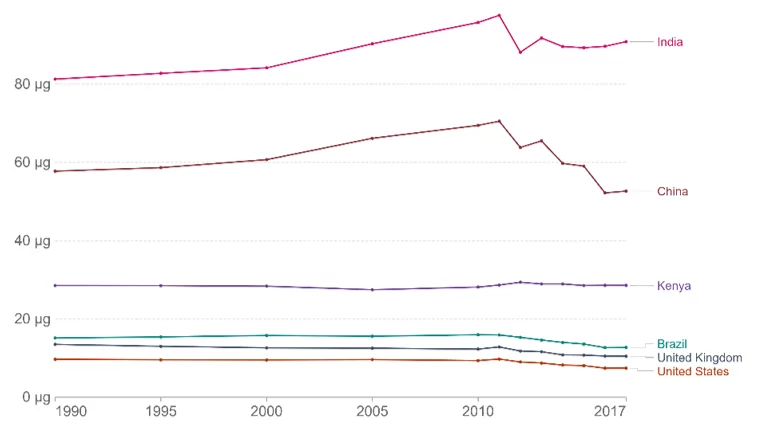
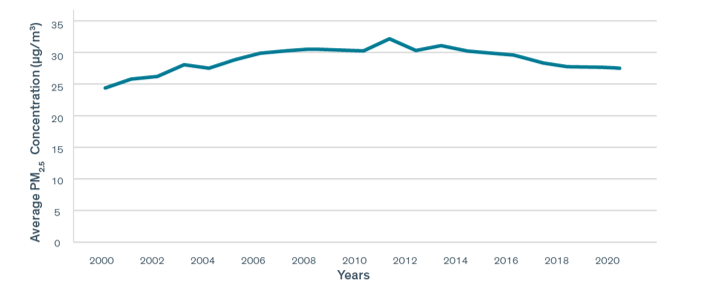
The Graph 9 express the behavior of the PM2.5 over the years. On this Graph a certain stability, or a small drop, in concentration in most countries over the years on the PM2.5 concentration. Graph 10 shows that trend in a single line for an easier observation. According to University of Chicago (2022) about 60% of the PM2.5 concentration are sourced by the usage of fossil fuels, 22% are from Natural Sources and 18% are from other human activities (UNIVERSITY OF CHICAGO, 2022).
Graph 9. Exposure to air pollution (PM2.5) from 1990 to 2017 expressed in μg/m3.
Graph 10. PM2.5 Air Pollution (μg/m3), Global average, from 2000 to 2020
2.1.5 SULPHUR DIOXIDE (SOX/SO2)
Sulphur Dioxide are also resulting from combustion of fossil fuels, volcano eruptions and some industrial processes. It affects human health through respiratory diseases and can also reduce growth rate of plants and contributes to the formation of Acid Rain (EPA, 2022d). Graph 11 demonstrates the emissions of Sulphur Dioxide by region of the World from 1950 to 2010 where around 1980 can be observed the change on the curve behavior as awareness of environmental and health impacts became clearer, the exception has been on Asia where a change on these countries’ economies have led to an increased level of emissions.
Graph 11. Sulphur Dioxide emissions by World regions from 1950 to 2010 on millions of tonnes
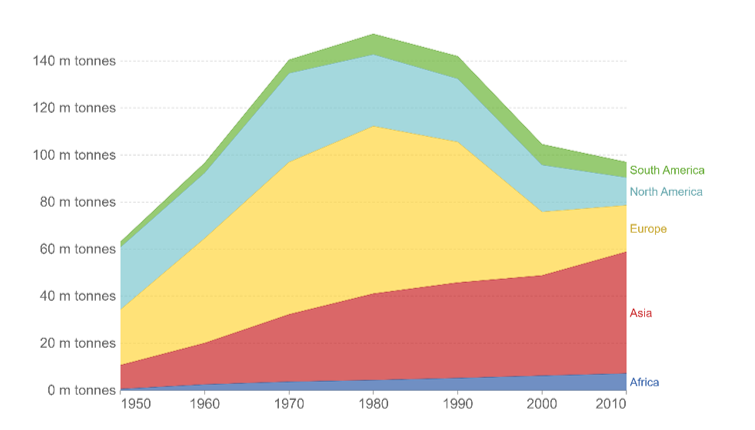
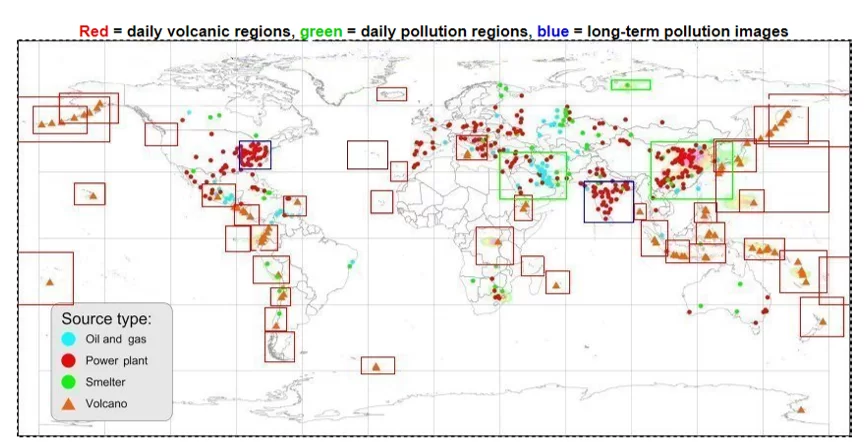
Based on the images from Picture 5, and cross-referencing it to Graph 11, it is possible to understand the sources and why it is growing in some areas, what proves the connection to usage of fossil fuels for energy as most and on smelter activities, another connection to GHG. It is also possible to make a reference to Picture 3 and the locations of the power plants to the concentration of Nitrogen Dioxide.
Picture 5. Global Sulfur Dioxide Sources, Oil & Gas (blue circle), Power Plants (red circle), Smelter (Green Circle) and Volcano eruption (Orange Triangle), data from satellite
2.1.6 NON-METHANE VOLATILE ORGANIC COMPOUNDS (NMVOC)
NMVOCs are emitted by several type of products and processes, such as paints, varnishes, wax, solvents, fuels, pesticides, and this varies according to the characteristics of these products, what makes its emissions geographically dependent. Its emission is also associated with the usage of fossil fuels, food, iron and paper process, burning of agriculture process. It can cause eye and respiratory system irritation, some type of cancers on human and animals, headache and damages to liver, kidney, and central nervous system (HUANG et al., 2017). Methane is one type of VOC, but it is less reactive (WHO, 2021b).
Graph 12. Global Anthropogenic emissions of NMVOC
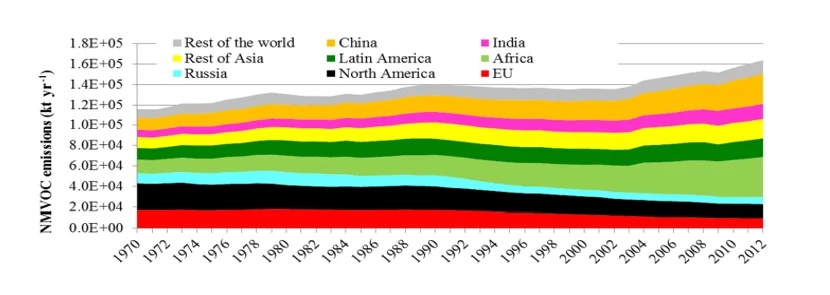
Graph 12 demonstrates a reduction in Europe and North America, that is related mainly to implementation of policies related to fuels that affected residential pollution and transportation, what includes the use of cleaner fuels. Africa, India, and China are the most emitters of NMVOC WW, and that is mainly due to residential factors, mainly the use of biomass (HUANG et al., 2017).
Graph 13. NMVOC by Sector
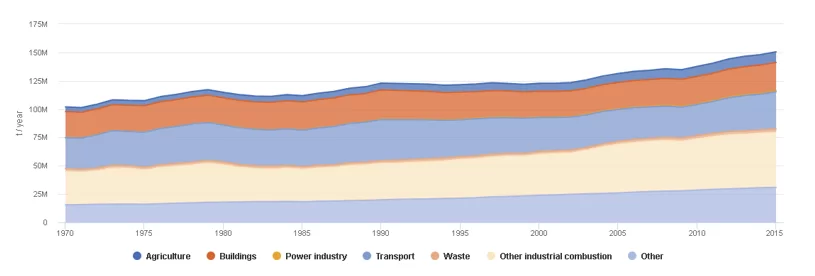
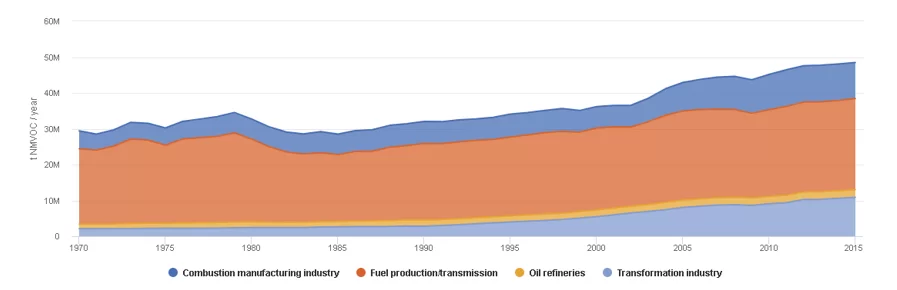
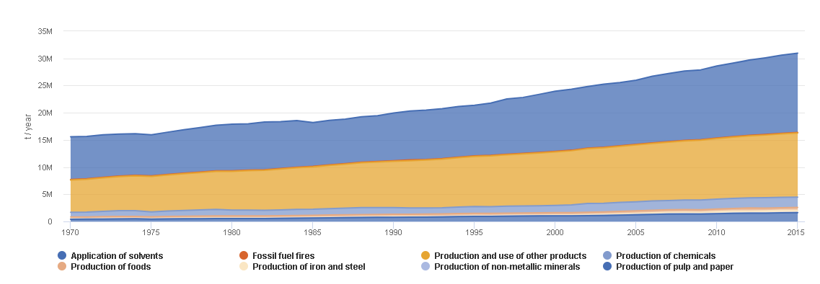
From Pictures 13, 14 and 15 it is possible to observe that most of the emissions increase of NMVOC are coming from the Transformation Industry, Application of Solvents and ‘Production and use of other products’, but the major contributor in absolute number is the Fuel Production/transmission.
Graph 14. NMVOC over Other Industrial Combustion
Graph 15. NMVOC over Others
2.1.7 GROUND LEVEL OZONE (GLO) OR TROPOSPHERIC
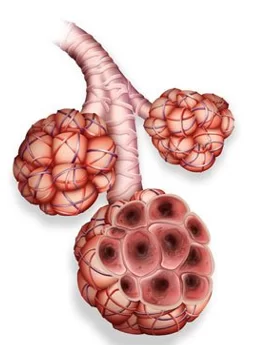
This is not a direct emission in the air, but it becomes an Air Pollutant, by the combination from Nitrogen and Volatile Organic Compounds (VOC) – GLO is the main component from SMOG (Smoke and Fog). These two elements chemically react in the presence of sunlight generating the Ozone (a photochemical reaction), on hotter days, the levels of GLO increases. Ozone can aggravate lung diseases, lead to shortness of breath and other respiratory diseases, as can be seen in Picture 6 (EPA, 2022c; EPA 2022f).
Picture 6. Ozone effect on airway muscle with trapped air
2.1.8 AMMONIA (NH3)
This normally derives from waste, waste treatment process, aquaculture, concentrated animal feeding operation, manure application, fertilizers, agriculture, industrial sources, and other natural processes – it is a result from bacterial decomposition of organic material. This is a normal cause of fish kill, and on human could cause psychological, behavioral, morphological, and even deaths (EPA, 2022a).
Graph 16. Global Ammonia emissions
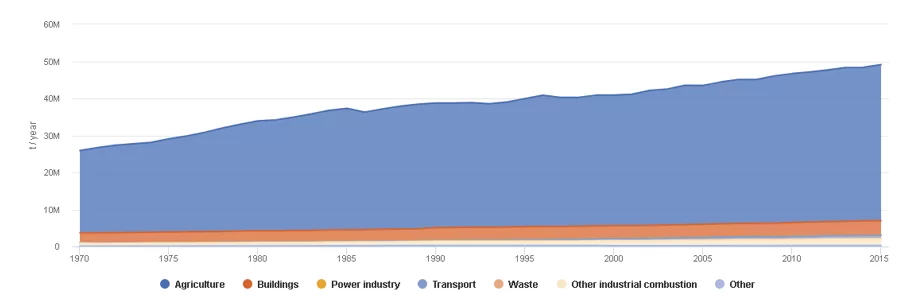
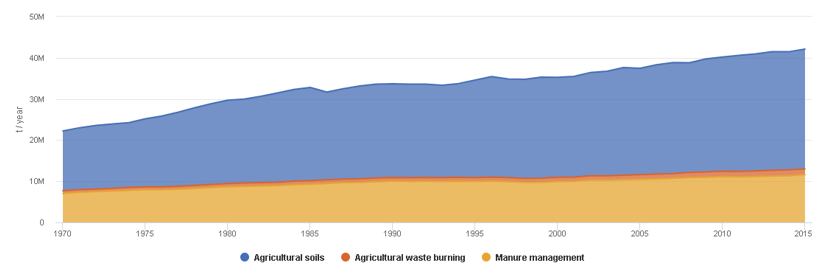
Most of the Ammonia emissions come from Agriculture sector, per Graph 16, and specifically due to soil treatment and manure management, per Graph 17.
Graph 17. Global Ammonia emissions, Agriculture sector
2.1.9 HEALTH AND SAFETY IMPACT FROM AIR POLLUTANT
As seem the Air Pollution ingress human body mainly by the respiratory system and affects lungs, heart, and brain. The size of the pollutant might be 30 times smaller than a hair diameter or sand particle. Inside the lungs or veins could create inflammations that would lead to increased blood pressure or cancer (long term stochastic effect from constant tissue damages or because of chemicals) (WHO, 2018). The Table 1 represents the percentage of deaths related to certain condition that could be attributed to Air Pollution .
Table 1. The air pollutants impact on health
| Condition | Estimated Global Impact (% of deaths) |
| Stroke | ~30% |
| Chronic Respiratory Disease | |
| Lung Cancer | |
| Heart Attack | ~25% |
| Overall deaths WW | ~11.65% |
Source: Adapted from United Nations (s.d.) and from Ritchie e Roser (2022).
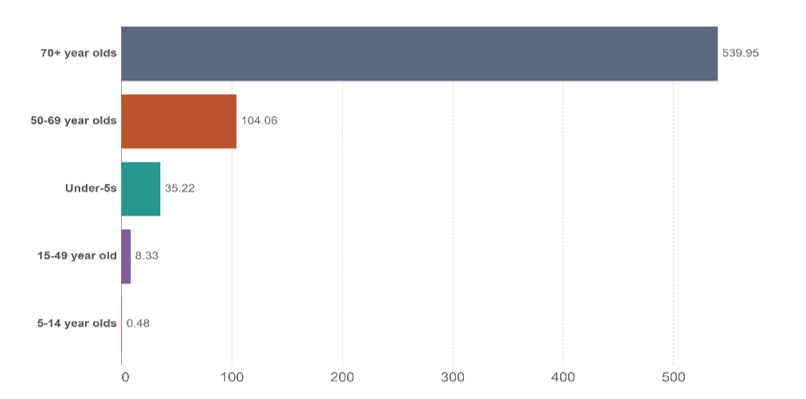
It is important to highlight that each air pollutant has a different degree to cause an impact on human health and its concentration would also impact the effect on the individual eventually exposed to it. These expositions are cumulative over the years, also called ‘stochastic effects’, and this can be observed on the Graph 18, as the highest mortality rate is on elderly ages, except by minors, that are also more susceptible not to the stochastic effect, but to the acute effect represented by some air pollutants (SEXTON e RYAN, 1988).
Graph 18. Outdoor air pollution deaths rates by age, per 100 thousand individuals, World, 2019
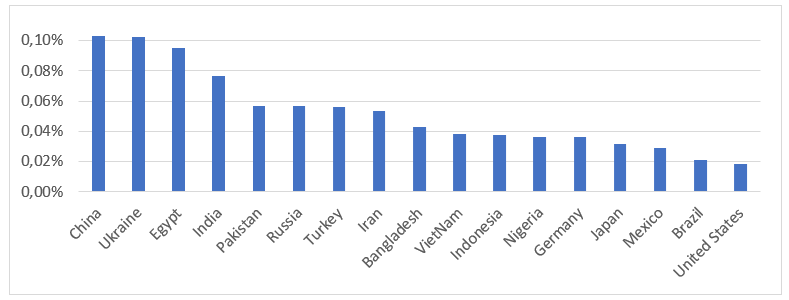
The Graph 19 from 2016, uses the Pareto relation to demonstrate the number of deaths rate related to Air Pollution by Country, from the dataset more than 52% of the deaths happened on China and India (3,456,780 people in 2016). In Ukraine, for example, pollution comes from the transportation and industrial zones, mainly by NO2, and the pollution is more concentrated on these 5 industrial areas. In 2016 Ukraine was starting its first steps into European Union standards of air pollution control. The meteorology has a big impact on the concentration of pollutants in the air (SAVENETS, 2020).
Graph 19. Number of deaths due to Outdoor Air Pollution/habitant, on top 80% countries with more deaths caused by Outdoor Air Pollution in 2016
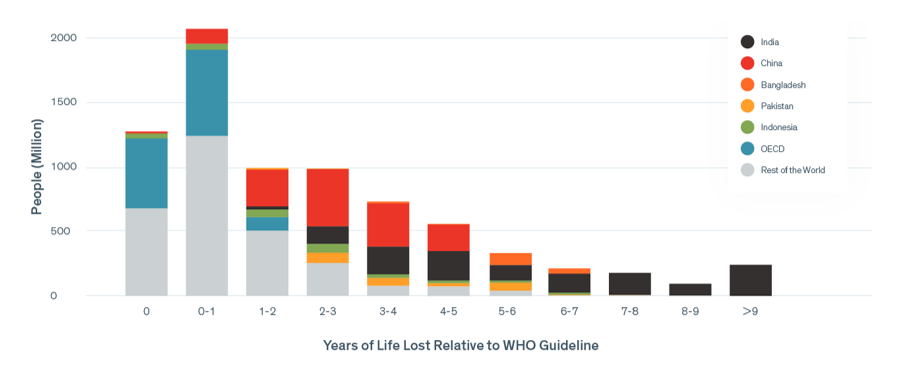
Considering the air pollutant, the concentration and climatology impact on the air pollution deaths, the Graphs 20 and 21 express the specific impact of the Air Pollutant PM2.5 relative to other risk factors and to the geographics (UNIVERSITY OF CHICAGO, 2022).
Graph 20. Life Expectancy Impact of PM2.5 and Unassociated Cause/Risk of Death, Global
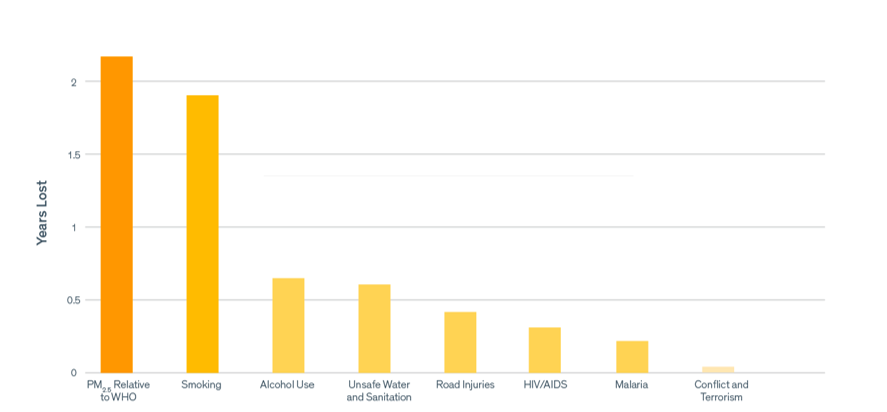
Graph 21. Life Expectancy Impact of PM2.5 and Unassociated Cause/Risk of Death – Global
2.1.10 CONTROL MEASURES
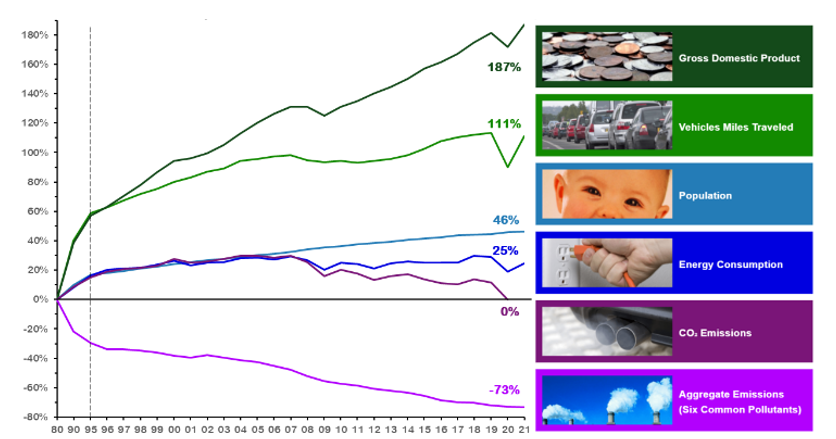
There was a general good progress in reduction on Air Pollutants in USA, as observed on Table 2, and this is also reflected on Graph 22, where even with the high industrial activity and economic development indicated Energy Consumption, Gross Domestic Product (GDP), Vehicle Miles Travelled and Population. There is a decrease on aggregated emissions of the most common Air Pollutants, despite the high volume of GHG. One important indicator here is the Vehicle Miles Travelled, that would represent an impact on Pollution in transport in some countries, but emission policies, fuel and vehicle technology evolution make an important contribution.
Table 2. Percent change in Air Quality, USA only
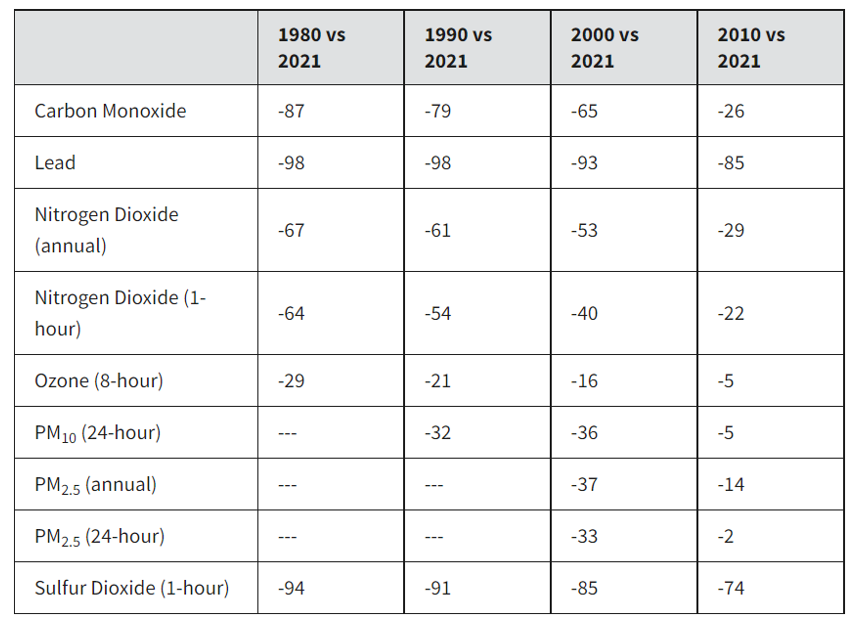
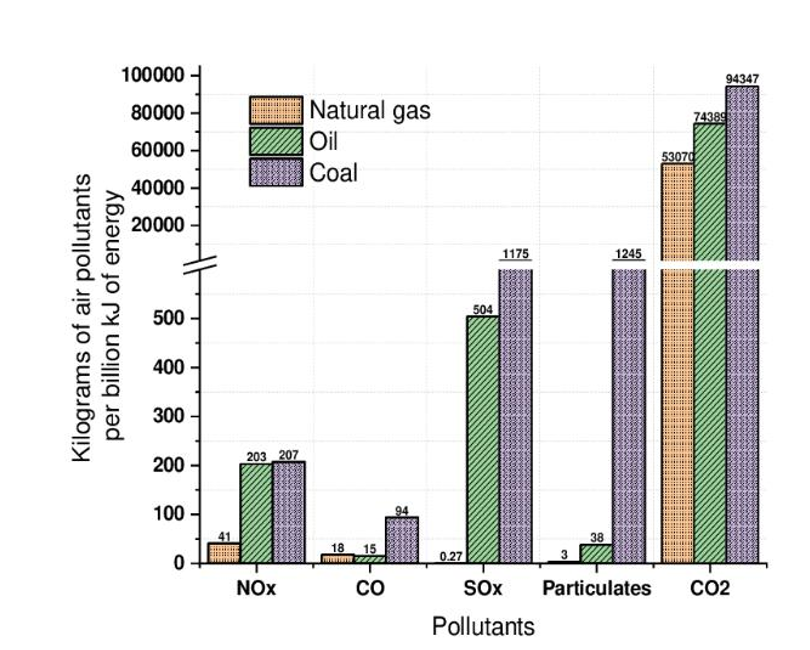
Most of the air pollutants relate to fossil fuels such as coal, oil-fuels, diesel, gasoline, or natural gas, but the level of pollutants from each differs on type and on volume, per Graph 25.
Graph 22. Comparison of Growth Areas and Emissions, 1980-2021
2.2 GREENHOUSE GASES (GHG)
Greenhouse gases are gases that have the potential to trap the sun heat on earth, leading to global warming: each gas has a different potential based on its time on the atmosphere and heat retaining capability. Some of the Greenhouse Gases (GHGs) are Carbon Dioxide (CO2), Methane (CH4), Nitrous Oxide (N2O), CCF-12 and the HCFC-22 (F-Gases). Based on each GHG potential there is a multiplier, and this multiplier can be used to add them to Carbon Dioxide Equivalent (CO2e) (LIMA e HAMZAGIC, 2022).
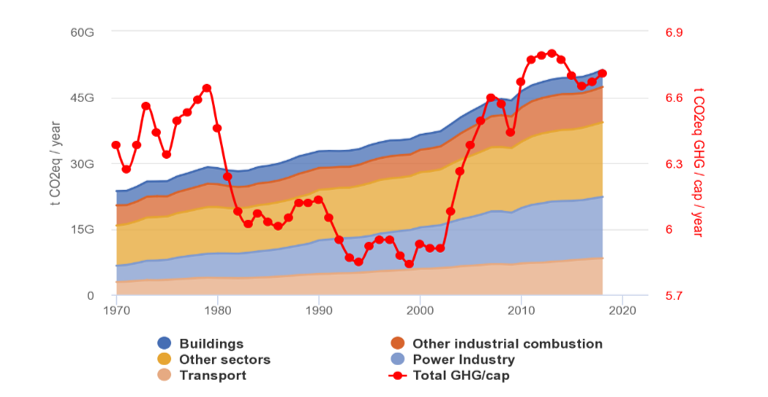
Even though some GHG are emitted by natural sources. The concern on the level of the emissions come from different economic sectors, such as buildings, power industry, transportation, other economy sectors and other industrial combustions, as shown in Graph 23. Other sectors, like agriculture and power industry are the ones that most contributes to GHG emissions, about 60% of it, followed by transportation and Other Industry Combustion with 16% each and buildings are the last with 8% of Global emissions (EUROPEAN COMMISSION, 2022).
Graph 23. Global GHG emissions in CO2e by sector
Even considering the GHG potential the most impacting GHG is the CO2, as expressed on Table 3, and the sector that most contributes to it is the Power followed by Transportation.
Table 3. 2018 Global GHG emissions by sector in CO2e (tons per year)
| Sector | CO2 | CH4 | N2O | F-Gases | All 2018 GHG (t CO2e/year) | % |
| Buildings | 3,487,852,530 | 307,493,588 | 78,764,744 | – | 3.874.110.862 | 8% |
| Other Ind. Comb. | 7,987,677,506 | 36,168,931 | 33,358,487 | – | 8.057.204.924 | 16% |
| Other Sectors | 4,193,254,299 | 8,999,971,287 | 2,571,268,358 | 1,233,296,007 | 16.997.789.950 | 33% |
| Power Industry | 13,905,060,784 | 11,499,407 | 83,469,597 | – | 14.000.029.788 | 27% |
| Transport | 8,142,335,550 | 27,454,121 | 100,652,203 | – | 8.270.441.874 | 16% |
| Total | 37,716,180,669 | 9,382,587,334 | 2,867,513,389 | 1,233,296,007 | 51.199.577.398 | |
| % | 74% | 18% | 6% | 2% |
Source: Adapted from European Commission (2022).
2.2.1 CARBON DIOXIDE (CO2)
The Carbon Dioxide is a common gas found on nature, but its levels on atmosphere have increased in the last centuries due to anthropogenic activities, mainly the burning of biomass and fossil fuels to produce energy, as of on the steel and cement industries. It is the most abundant GHG on the planet. The Carbon Dioxide cycle is also affected when the capability of absorbing it is reduced, either by ocean or by forest (THE UNIVERSITY OF WAIKATO, 2008).
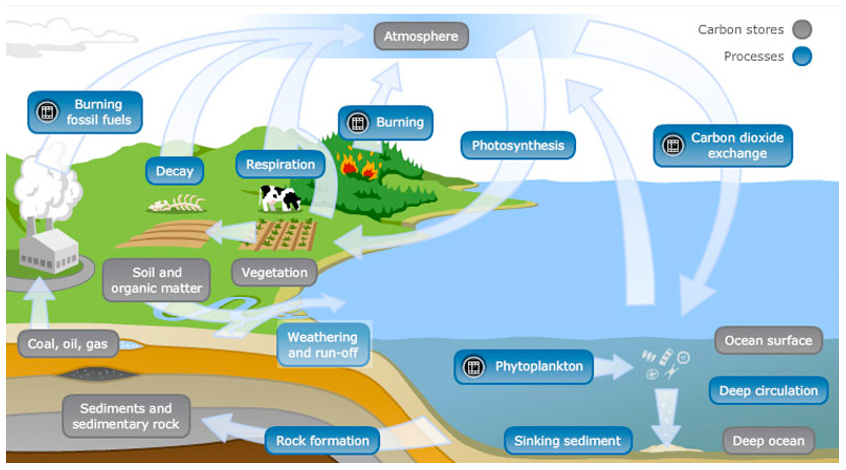
The biggest Carbon Dioxide absorbing mechanism occurs in the oceans, where millions of phytoplankton produce photosynthesis and convert the CO2 to O2, permanently storing this CO2 on the bottom of oceans as it finishes its living cycle in nature. The Picture 7 shows the carbon storage in gray and the carbon processes in blue. In gray it is observable the atmosphere, the soil and organic matter, coal, oil, gas (fossil fuels), the ocean surface and the ocean bottom as depository for the CO2. The process in blue includes the burning of fossil fuels or organic matter that converts the CO2 from its solid state to the atmosphere, the respiration of humans and animals that releases absorbs the O2 and releases CO2, and the photosynthesis process that converts the CO2 to O2 on forests, plants and phytoplankton (THE UNIVERSITY OF WAIKATO, 2008).
Picture 7. Carbon Cycle
2.2.2 METHANE (CH4)
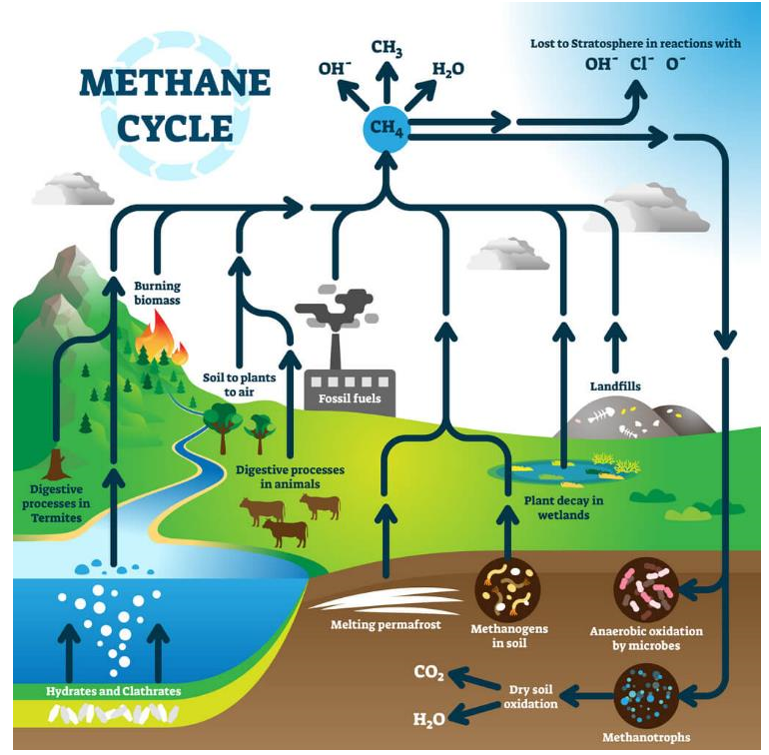
The Methane has a 28 times higher potential, from Assessment Report #5 (AR5), of causing global warming when compared to Carbon Dioxide, and it is the second on the emission chain. It is mostly emitted by agriculture industry globally, mainly rice culture (about 20% of global emissions), and adding to this there are some natural wetlands, termites, wild animals, and animal manure (another 25% of global emissions). Another industry that has a high impact on methane emissions is the natural gas industry (from 5 to 10% of global emissions). These processes are observable on Picture 8 whereby methanogenesis the organic matter in anaerobically mean by bacteria into CO2 and CH4 (Methane) (THOMAS; KUMAR and KUMAR, 2020).
Picture 8. Methane Cycle
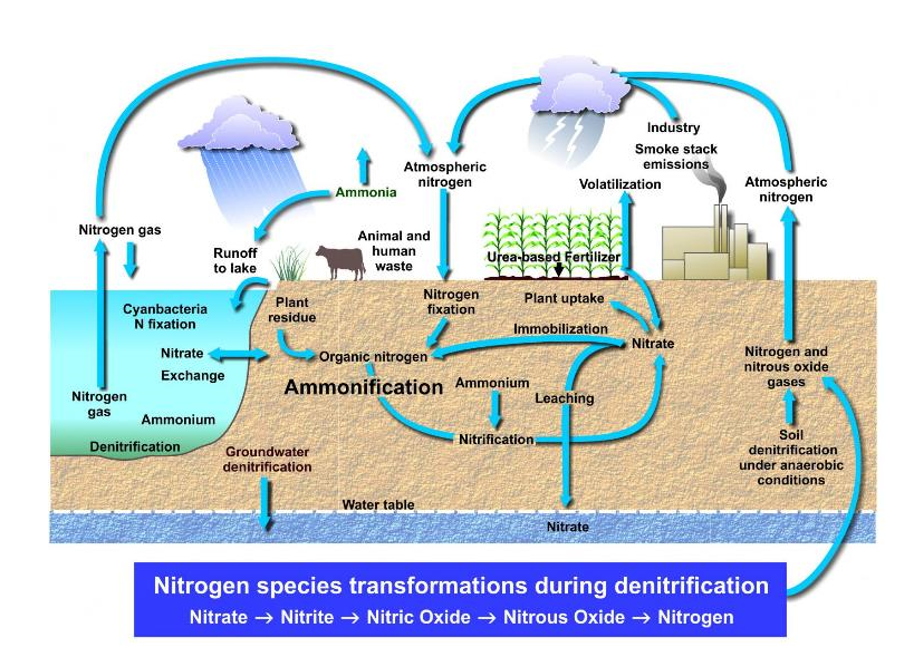
2.2.3 NITROUS OXIDE (N2O)
The Nitrous Oxide had a Global Warming Potential of 298. It has its main sources on the agriculture, fossil fuel combustion, wastewater management and industrial processes, on top of the regular natural nitrogen cycle in nature on the proportion of 40% anthropogenic and 60% natural. This cycle can be observed on Picture 9. From the anthropogenic sources, most is from the agriculture, almost 74% (from United States 2017, for example) on the process of fertilizers (what is also impacting the industry, mainly) or burning of some agriculture residues. On the fuel combustion it depends on the fuel additives and on the machinery, while on the residues side, it is used and released on water treatment plants (EPA, 2022d).
Picture 9. Nitrogen Cycle
2.2.4 F-GASES
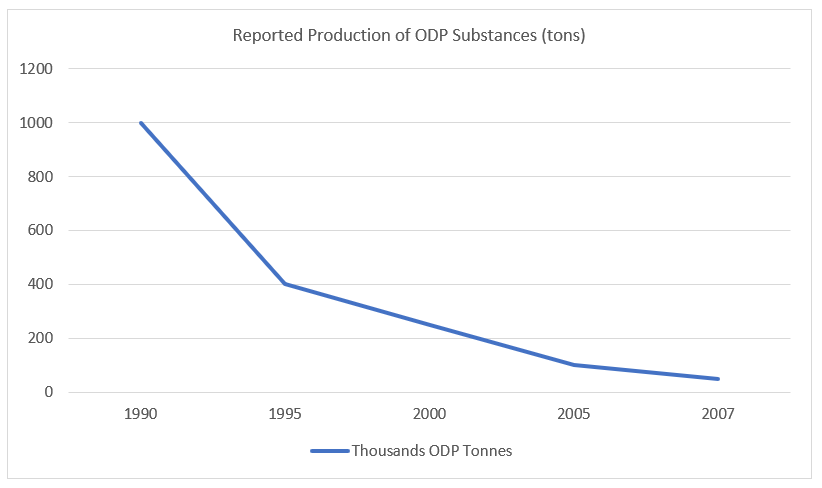
By F-Gases it should be considered, as examples, the Chlorofluorocarbons (CFC), hydrofluorocarbons (HFCs) and hydrochlorofluorocarbons (HCFC). These gases contribute to Greenhouse (GH) and contribute to damages to the Ozone in upper atmosphere, therefore called Ozone Depleting Substances (ODP), what increase human exposure to ultra-violet rays (UVB). About 84% of it are resulted from anthropogenic sources, and the rest of the 16% are natural. Most of CFC and HCFC production and import are prohibited in most of the places, as shown on Graph 24. Its GH potential could go as high as 14,000 depending on the substance. These are normally coolants (THE OZONE HOLE, 2022; MINNESOTA POLLUTION CONTROL AGENCY; UNITED NATIONS DEVELOPMENT PROGRAMME, 2012).
The Montreal Protocol was a global agreement protocol to protect the ozone layer by stopping the production of substances that could damage the ozone stratospheric ozone layer.
Graph 24. Decrease of ODP Production WW (approximated values from original source)
3. METHODOLOGY
Regarding its nature this is applied research, as it intends to identify correlations between GHG and Air Pollution. Considering its objectives this is explicative research, as it aims to explain these relationships and impact on human health and safety. According to technical protocols the research is documental, as it uses all type of available sources to collect data and experimental research when the information is tested using statistical models, what defines its quantitative approach style.
The part of documental research used 45 sources of information to understand and by this means, to translate this knowledge. The study used 67% of information from websites from recognized agencies and universities, like United Nations, World Health Organization, University of Chicago, Our World in Data, etc., plus 37% of journal papers, books and public reports. About 80% of the information was published between 2017 and 2022; More than 90% of the information are from international sources.
The main subjects researched were Emissions, what includes both Air Pollutants and GHG (32), Health (7), Energy (5) and Demographics (1).
Regarding the objectives, this was exploratory research that was looking for means to understand the relation between these two variables through all different sources and understand perspectives for the future.
For the regression model, only the following countries were considered given the lack of source of data for Coal Consumption: Algeria, Argentina, Australia, Austria, Azerbaijan, Bangladesh, Belarus, Belgium, Brazil, Bulgaria, Canada, Chile, China, Colombia, Croatia, Cyprus, Czechia, Denmark, Ecuador, Egypt, Estonia, Finland, France, Germany, Greece, Hungary, Iceland, India, Indonesia, Iran, Iraq, Ireland, Israel, Italy, Japan, Kazakhstan, Kuwait, Latvia, Lithuania, Luxembourg, Malaysia, Mexico, Morocco, Netherlands, New Zealand, North Macedonia, Norway, Oman, Pakistan, Peru, Philippines, Poland, Portugal, Qatar, Romania, Russia, Saudi Arabia, Singapore, Slovakia, Slovenia, South Africa, South Korea, Spain, Sri Lanka, Sweden, Switzerland, Thailand, Trinidad and Tobago, Turkey, Turkmenistan, Ukraine, United Arab Emirates, United Kingdom, United States, Uzbekistan, Venezuela and Vietnam.
4. RESULTS AND DISCUSSION
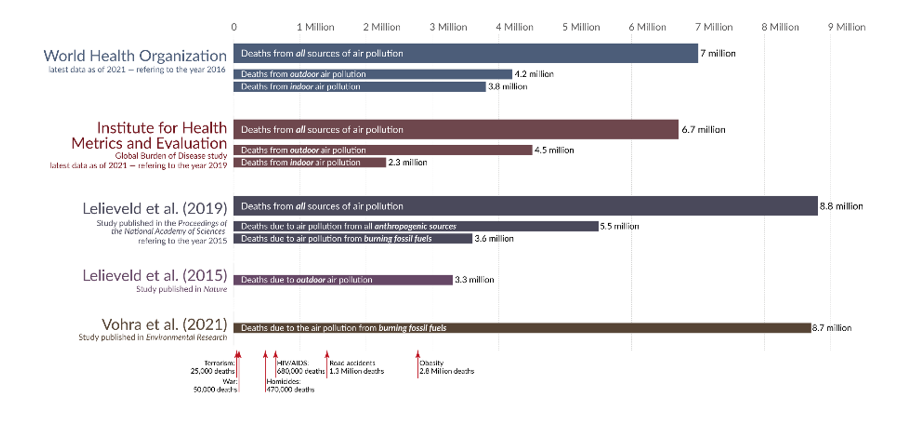
According to Rose (2020), Picture 10, the data from WHO (2021b) is not unique about deaths due to Air Pollution, although that was the reference for this work, which is not the highest, it averages well with other recognized numbers from other publications.
Picture 10. Number of deaths due to Air Pollution from different sources
Although both Air Pollution and Greenhouse Gases add to different death record statistics, from WHO (2021a) 7 million deaths every year from Air Pollution (internal, 3.8 million and external, 4.2 million), and from (ZHAO et al., 2021) about 5 million people die every year due to climate change. As it can be observed on Table 19 and Table 20 most of both emission types are related to combustion processes, but there is an inflection point where both start to split apart.
Table 19. Some sources of GHG
| GHG | Source |
| Carbon Dioxide (CO2) | Fossil Fuel Combustion, Traditional Usage of Biomass, Industrial Processes, Volcano, Wildfire, |
| Methane (CH4) | Agriculture, Traditional Usage of Biomass, Decomposition of Organic Material, waste, manure, Termites, Wild Animals, fossil fuels |
| Nitrous Oxide (N2O) | Agriculture, Fossil Fuels, waste, Fertilizers |
| CFC and HCFC (F-Gases) | Coolants |
Source: prepared by author.
Table 20. Some sources of Air Pollution
| Air Pollutant | Source |
| Carbon Monoxide (CO) | Fossil Fuel Combustion, Traditional Usage of Biomass, Volcano, Wildfire |
| Lead (Pb) | Combustion of Fuels containing lead and other chemical components, Industrial Processes, Cosmetics, Mining, Leaded paint, Welding and Soldering |
| Nitrogen Dioxide (NOX/NO2) | Combustion of Fossil Fuels at high temperature, mainly diesel and coal, Industrial process, waste |
| Particular Matter | Unpaved Roads, Construction Sites, Wildfires, Fossil Fuels |
| Sulfur Dioxide (SOX/SO2) | Industrial Processes, Volcano, Fossil Fuels |
| Volatile Organic Compounds (VOC) | Paint, Wax, Varnishes, Fossil Fuels, Pesticides, Industrial processes, |
| Ground Level Ozone (GLO) | Particular Matter, VOC, Nitrogen Dioxide |
| Ammonia (NH3) | Waste, Fertilizers, Industrial processes, decomposition of organic material, Manure, Aquaculture and Agriculture |
Source: prepared by author.
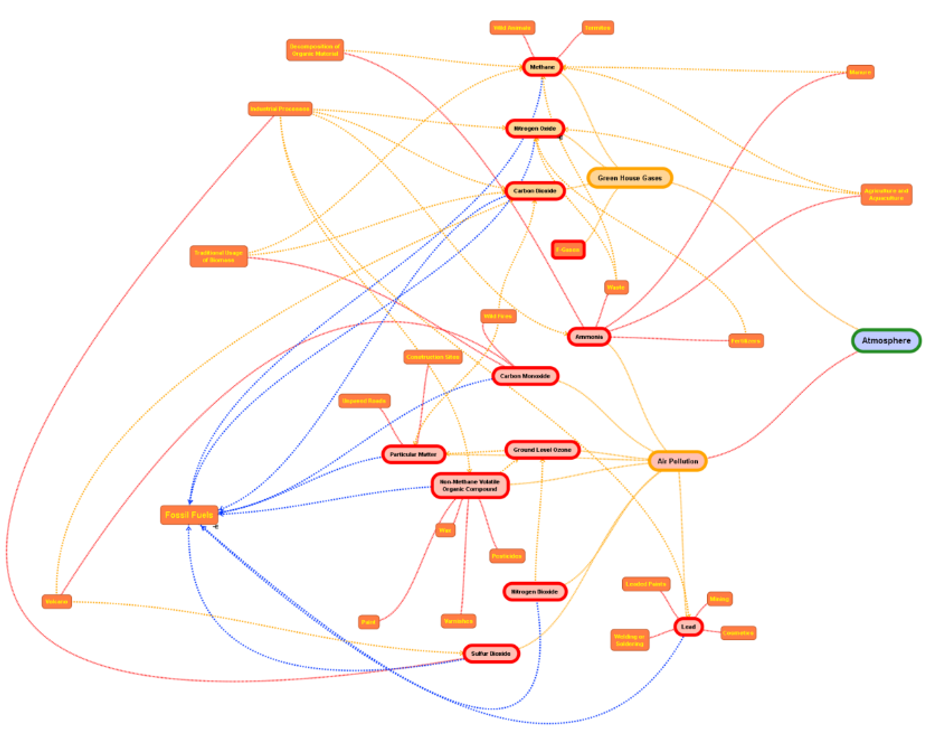
The Picture 11 partially shows the complex relations between pollutants (red), sources (orange), greenhouse gases (red) and the atmosphere (green), based on the connections, both fossil fuels and industrial processes seems to be the most contributors to GHG and Air Pollution.
Picture 11. Mind Map with relations between GHG, Air Pollutant and Sources
Although tables show fossil fuels to be the major contribution to air pollution the biggest difference is with the type of fuel in use, while Oil and Coal have high concentrations of pollutants, Natural Gas, or even Biomethane, from Biogas, have much lower concentrations on Pollutants and almost 44% less CO2 emissions than Coal and 30% less CO2 emissions than Oil, one of the reasons for this to be called ‘Transition Fuel’, per Graph 25.
Graph 25. Pollutants and CO2 from some Fossil Fuels
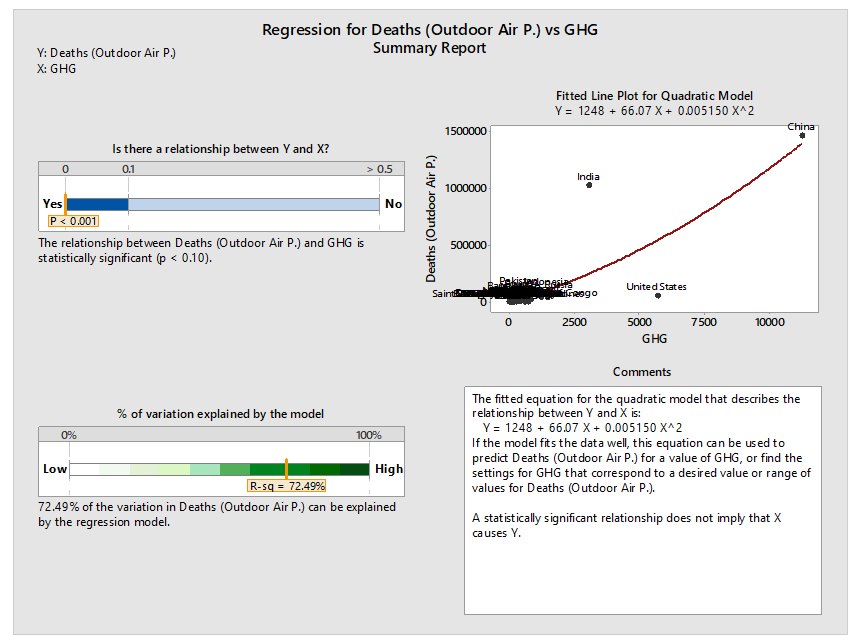
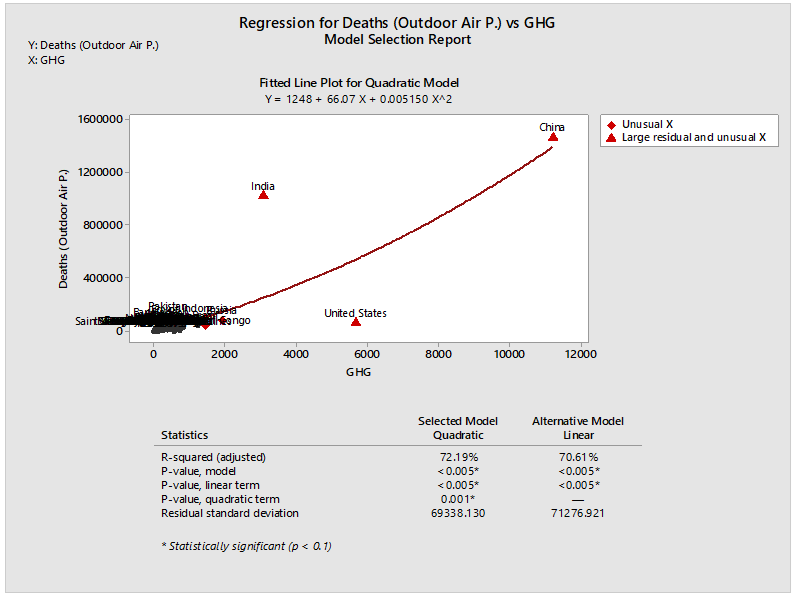
Another perspective on that is the relation between Outdoor Air Pollution Deaths and GHG emissions. Based on the data from this study based on data from (RITCHIE e ROSER, 2022), the regression shows a statistical significative relation between Deaths by Outdoor Air Pollution (Y) and GHG emissions (X). Some important aspects of this regression study are:
- Especially on graphs 12 and 13 the regression considers 183 countries, in oppose to the method from this overall study that only accounts for 77 countries,
- there are big clusters, meaning that there are other factors impacting our Y,
- On top of the cluster, 3 countries with high GHG emissions stand out: China, India and USA, that have different realities on Air Pollution,
- If considering the equations from Picture 13, it might not be applicable to some areas, as the constant of the equation might lead to a number incompatible with the population.
Picture 12. Direct regression study between Deaths due to Outdoor Air Pollution vs GHG emissions, Summary
Picture 13. Direct regression study between Deaths due to Outdoor Air Pollution vs GHG emissions, Model
On the attempt to reduce the effects highlighted on Pictures 12 and 13 other X variables were added to GHG emissions: parent location, population, and Coal Consumption, per Picture 14, 15 and 16.
Picture 14. Multiple Regression between Deaths by Outdoor Air Pollution and Variables, data from 2016
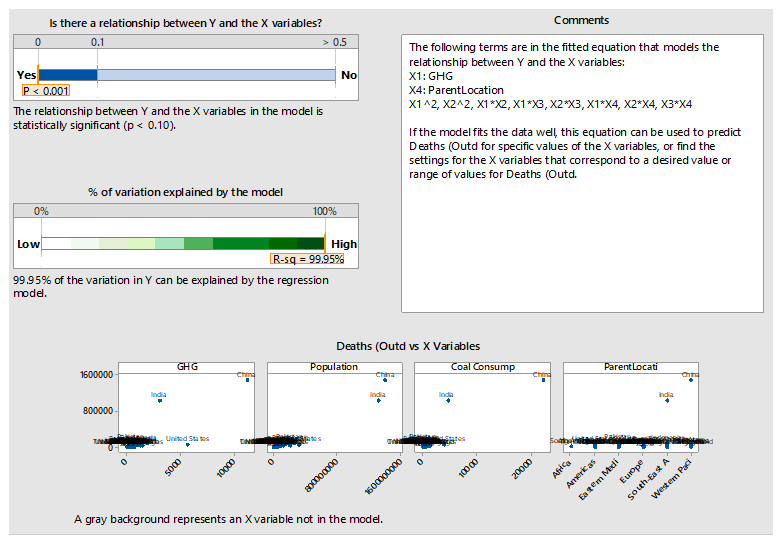
Each one of the variables (X) used for the study have presented a different type of behavior against the mean of deaths related to outdoor air pollution, in some cases a negative relation, as observed on Picture 15.
Picture 15. The Interaction and the Main Effect Plots of the tested variables
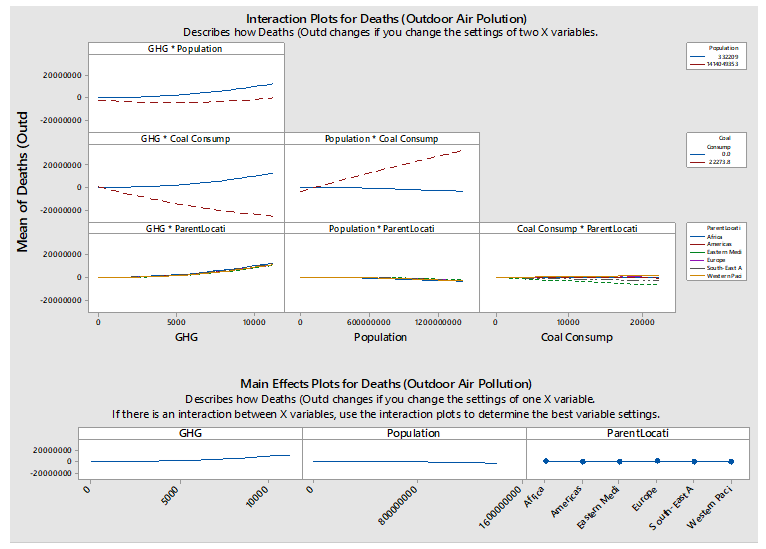
In the same way that it was observed that GHG and Air Pollution might be dissociated in some locations depending on the local implemented policies, type of fossil fuel mostly used, Graph 25, the relation between Deaths due to Outdoor Air Pollution is region dependent and need to be future grouped under other categories to build a better model.
Picture 16. Equations by Parent Location (Region) resulted from regression analysis

Picture 16 shows some examples of equations that could be used for an estimation of deaths due to Outdoor Air Pollution, based on GHG emissions, Population and Coal Consumption.
5. FINAL CONSIDERATIONS
The present study objective was to understand the relationship between Air Pollution and Greenhouse Gases (GHG), and as its guiding question: what is relationship between Air Pollution and Greenhouse Gases?
Being possible to verify, after development this research that Air Pollution and GHG are intrinsically connected through the most of its common sources, therefore, although the literature reveled 2 separated statistics, there are unseen links, as demonstrated on Picture 11. Another important observation from Graph 22 is related to the intensity of this relation, as with the implementation of new technologies and policies to prevent Air Pollution the relation between GHG and Air Pollution might become weaker, a phenomenon that started in the 70’s with the Air Pollution conscience growth.
Availability of more advanced and clean energy will support the reduction of Air Pollution deaths, internal or outdoor. The internal Air Pollution is more related to the usage of less advanced type of energy sources, which generate more Air Pollutants on higher concentration, and the Outdoor Air Pollution is impacted by the way and volume that some fossil fuels are converted to energy, so investments on renewables and efficiency are key, but not the only alternative.
The current focus on LNG, Biomethane and Natural Gas must keep its growth pace given its ~40% less intensive impact on CO2 emissions, significative less Air Pollution, and the potential for integration with other technologies like hydrogen. These power plants (current, in construction or in conversion from other fossil fuel to Natural Gas or similar) must contemplate tangible plans for technologies like Carbon Capture and Underground Storage (CCUS) or Carbon Capture and Storage (CCS) and be prepared to operate with Green Hydrogen on any given proportion.
This study also presents equations, Picture 13 and 16, that are not absolute but have the intention to show a relationship between GHG and Deaths by Outdoor Air Pollution, providing a new tool for estimations based on a safety impact that can help the development of projects focused on GHG emission reduction. Although the equations, from Picture 16, are regionally focused. It is important to highlight that each country would have its own reality and a more specific regression study should be done for more precise results, given the different actions being taken regarding air pollution controls. Another important aspect to clarify is that these estimated deaths should not be added to an already accounted number of deaths due to GHG emissions (ZHAO et al., 2021).
To conclude, the literature review and data presented, on this study, supports that there is a relation between GHG and Air Pollution Deaths, and that when there is the will for the change, the use of Technologies and Policies can make the difference to make that relation weaker. The overall Global reduction on Air Pollutants, followed by the work the World has done to reduce the Ozone Depleting Products shows that and are encouraging towards the Global Net Zero Goal for GHG.
BIBLIOGRAPHY
AMERICAN LUNG ASSOCIATION. Nitrogen Dioxide. American Lung Association, 2020. Available in: https://www.lung.org/clean-air/outdoors/what-makes-air-unhealthy/nitrogen-dioxide#:~:text=What%20Is%20Nitrogen%20Dioxide%3F,are%20burned%20at%20high%20temperatures. Access in: 28 jul. 2022.
BABARINDE, F.; ADIO, M. A. A Review of Carbon Capture and Sequestration Technology. Journal of Energy Technology and Environment, p. 1-11, 2020. Available in: DOI:10.37933/nipes.e/2.2020.1. Access in: 19 set. 2022.
BRAVO, A. H. et al. The potential impact of gasoline additives on air quality in developing countries. Clean Technologies and Environmental Policy, p. 174-181, August 2006. Available in: DOI 10.1007/s10098-005-0016-5. Access in: 19 set. 2022.
EUROPEAN COMMISSION. Country Fact Sheet. EDGAR – Emissions Database for Global Atmospheric Research. European Commission, 2022. Available in: <https://edgar.jrc.ec.europa.eu/country_profile>. Access in: 9 aug. 2022.
GOV.UK. National Statistics: Air quality statistics in the UK, 1987 to 2021 – Nitrogen dioxide (NO2). Department for Environment Food & Rural Affairs, 2022 Available in: https://www.gov.uk/government/statistics/air-quality-statistics/ntrogen-dioxide. Access in: 3 aug. 2022.
GOODKIND, A. L. et al. Fine-scale damage estimates of particulate matter air pollution reveal opportunities for location-specific mitigation of emissions. PNAS, Pasadena, v. 116, n. 18, p. 8775–8780, April 2019. Available in: https://doi.org/10.1073/pnas.1816102116. Access in: 4 aug. 2022
HAINES, A. Good Health in the Anthropocene Epoch: Potential for Transformative Solutions. In: AL-DELAIMY, W.; RAMANATHAN, V.; SÁNCHEZ SORONDO, M. Health of Planet and Our Responsibility. Cap. Chapter 24, p. 311-322. London: Springer, Cham, 2020.
HUANG, G. et al. Speciation of anthropogenic emissions of non-methane volatile organic compounds: a global gridded data set for 1970–2012. Atmospheric Chemistry and Physics, v. 17, p. 7683–7701, June 2017. Available in: https://doi.org/10.5194/acp-17-7683-2017. Access in: 3 aug. 2022.
KHANNA, K. How Methanogenic Archaea Contribute to Climate Change. American Society for Microbiology, 2022. Available in: https://asm.org/Articles/2022/May/How-Methanogenic-Archaea-Contribute-to-Climate-Cha. Access in: 11 aug. 2022.
LIMA, L. J. B.; HAMZAGIC, M. Strategies for the Energy Transition: Literature Review. Revista Científica Multidisciplinar Núcleo do Conhecimento, v. 8, n. 6, p. 96-120, June 2022. Available in: https://www.nucleodoconhecimento.com.br/environmental-engineering-en/energy-transition. Access in: 4 aug. 2022.
LEWIS, J. The Birth of EPA. US Environmental Protection Agency, 1985. Available in: https://archive.epa.gov/epa/aboutepa/birth-epa.html. Access in: 4 aug. 2022.
MINNESOTA POLLUTION CONTROL AGENCY. Chlorofluorocarbons (CFCs) and hydrofluorocarbons (HFCs). Minnesota Pollution Control Agency, s.d. Available in: https://www.pca.state.mn.us/air/chlorofluorocarbons-cfcs-and-hydrofluorocarbons-hfcs. Access in: 11 aug. 2022.
NASA. New NASA Satellite Maps Show Human Fingerprint on Global Air Qualit. NASA.gov, 2015. Available in: https://www.nasa.gov/press-release/new-nasa-satellite-maps-show-human-fingerprint-on-global-air-quality/. Access in: 6 aug. 2022.
NASA. Global Sulfur Dioxide Monitoring Home Page. Atmospheric Chemistry and Dynamics Laboratory, 2019. Available in: https://so2.gsfc.nasa.gov/. Access in: 6 aug. 2022.
ORGANISATION FOR ECONOMIC CO-OPERATION AND DEVELOPMENT – OECD. Environment at a Glance 2020. OECD Publishing: Paris, p. 1-68, 2020.
QYYUM, M. A. et al. Performance enhancement of offshore lng processes by introducing optimal mixed refrigerant self-cooling recuperator. International Conference on Applied Energy, p. 712-749, 2019. Available in: https://www.researchgate.net/profile/Muhammad-Abdul-Qyyum/publication/344489774_PERFORMANCE_ENHANCEMENT_OF_OFFSHORE_LNG_PROCESSES_BY_INTRODUCING_OPTIMAL_MIXED_REFRIGERANT_SELF-COOLING_RECUPERATOR/links/5f7c28a792851c14bcb16e16/PERFORMANCE-ENHANCEMENT-OF-OFFSHORE-LNG-PROCESSES-BY-INTRODUCING-OPTIMAL-MIXED-REFRIGERANT-SELF-COOLING-RECUPERATOR.pdf. Access in: 28 jul. 2022.
RITCHIE, H. What are the safest and cleanest sources of energy? Our World in Data, 2020. Available in: https://ourworldindata.org/safest-sources-of-energy. Access in: 3 aug. 2022.
RITCHIE, H.; ROSER, M. Air Pollution. Our World in Data, 2022. Available in: https://ourworldindata.org/air-pollution. Access in: 27 jul. 2022.
ROSER, M. The world’s energy problem. Our World in Data, 2020. Available in: https://ourworldindata.org/worlds-energy-problem. Access in: 3 aug. 2022.
SAVENETS, M. Air pollution in Ukraine: a view from the Sentinel-5P satellite. IDŐJÁRÁS: Quarterly Journal of the Hungarian Meteorological Service, Kyiv, v. 125, n. 2, p. 271-290, April 2020. Available in: DOI:10.28974/idojaras.2021.2.6. Access in: 27 jul. 2022.
SEXTON, K.; RYAN, P. B. Assessment of Human Exposure to Air Pollution: Methods, Measurements, and Models. National Library of Medicine, 1988. Available in: https://www.ncbi.nlm.nih.gov/books/NBK218147/#:~:text=The%20concentration%20of%20a%20specific,%2C%20micrograms%20per%20cubic%20meter). Access in: 27 jul. 2022.
THE OZONE HOLE. CFCs. The Ozone Hole, 2022. Available in: http://www.theozonehole.org/cfc.htm. Access in: 11 aug. 2022.
THE UNIVERSITY OF WAIKATO. Article: Carbon Cycle. Science Learning Hub, 2008. Available in: https://www.sciencelearn.org.nz/resources/1569-carbon-cycle. Access in: 11 aug. 2022.
THOMAS, J.; KUMAR, A.; KUMAR, A. Agricultural Methane Emissions: Consequences and Mitigations. International Journal of Current Microbiology and Applied Sciences, vol. 9, n. 2, p. 729-732, 2020. Available in: DOI: https://doi.org/10.20546/ijcmas.2020.902.089. Access in: 11 aug. 2022.
UNITED NATIONS. Business Action For Energy: Working for Sustainable Solutions – Air Pollution. United Nations. p. 2. 2007.
UNITED NATIONS. The Air We Share. United Nations, s.d. Available in: https://www.un.org/en/observances/clean-air-day. Access in: 27 jul. 2022.
UNITED NATIONS DEVELOPMENT PROGRAMME. 25 Years Montreal Protocol. United Nations: New York, p. 32, 2012.
UNIVERSITY OF CHICAGO. Particulate air pollution is the single greatest threat to human health globally. Pollution Facts, University Of Chicago, 2022. Available in: https://aqli.epic.uchicago.edu/pollution-facts/. Access in: 6 aug. 2022.
UNIVERSITY OF NEBRASKA – LINCOLN. Nitrogen Dynamics. Institute of Agriculture and Natural Resources, 2022. Available in: https://water.unl.edu/article/animal-manure-management/nitrogen-dynamics. Access in: 11 aug. 2022.
UNITED STATES ENVIRONMENTAL PROTECTION AGENCY – EPA. Our Nation’s Air: Trends Through 2020. U.S. Environmental Protection Agency (EPA), 2020. Available in: https://gispub.epa.gov/air/trendsreport/2021/. Access in: 4 aug. 2022.
UNITED STATES ENVIRONMENTAL PROTECTION AGENCY – EPA. Ammonia. CADDIS Volume 2. U.S. Environmental Protection Agency (EPA), 2022a. Available in: https://www.epa.gov/caddis-vol2/ammonia. Access in: 27 jul. 2022.
UNITED STATES ENVIRONMENTAL PROTECTION AGENCY – EPA. Emisiones de óxido nitroso. Agencia de Protección Ambiental de Estados Unidos, 2022b. Available in: https://espanol.epa.gov/la-energia-y-el-medioambiente/emisiones-de-oxido-nitroso#N2O%20references. Access in: 11 aug. 2022.
UNITED STATES ENVIRONMENTAL PROTECTION AGENCY – EPA. Health Effects of Ozone Pollution. Ground-level Ozone Pollution. U.S. Environmental Protection Agency (EPA), 2022c. Available in: https://www.epa.gov/ground-level-ozone-pollution/health-effects-ozone-pollution. Access in: 27 jul. 2022.
UNITED STATES ENVIRONMENTAL PROTECTION AGENCY – EPA. National Air Quality: Status and Trends of Key Air Pollutants. U.S. Environmental Protection Agency (EPA), 2022d. Available in: https://www.epa.gov/air-trends. Access in: 27 jul. 2022.
UNITED STATES ENVIRONMENTAL PROTECTION AGENCY – EPA. Particulate Matter (PM) Basics. Particulate Matter (PM) Pollution. U.S. Environmental Protection Agency (EPA), 2022e. Available in: https://www.epa.gov/pm-pollution/particulate-matter-pm-basics#PM. Access in: 27 jul. 2022.
UNITED STATES ENVIRONMENTAL PROTECTION AGENCY – EPA. Volatile Organic Compounds’ Impact on Indoor Air Quality. Indoor Air Quality (IAQ). U.S. Environmental Protection Agency (EPA), 2022f. Available in: https://www.epa.gov/indoor-air-quality-iaq/volatile-organic-compounds-impact-indoor-air-quality. Access in: 27 jul. 2022.
VOILAND, A. Fourteen years of carbon monoxide from MOPITT. NASA’s Earth Observatory, 2015. Available in: https://climate.nasa.gov/news/2291/fourteen-years-of-carbon-monoxide-from-mopitt/. Access in: 03 aug. 2022.
WORLD HEALTH ORGANIZATION – WHO. WHO: Breathe Life – How air pollution impacts your body. YouTube, 2018. Available in: https://www.youtube.com/watch?v=GVBeY1jSG9Y. Access in: 27 jul. 2022.
WORLD HEALTH ORGANIZATION – WHO. Air pollution. World Health Organization, 2021a. Available in: https://www.who.int/health-topics/air-pollution#tab=tab_1. Access in: 27 jul. 2022.
WORLD HEALTH ORGANIZATION – WHO. WHO global air quality guidelines. Particulate matter (PM2.5 and PM10), ozone, nitrogen dioxide,sulfur dioxide and carbon monoxide. World Health Organization. Geneva, p. 300, 2021b. (ISBN 978-92-4-003422-8).
WHO REGIONAL OFFICE FOR EUROPE. Lead. In: EUROPE, W. R. O. F. Air Quality Guidelines. 2. ed. Cap. 6.7, p. 1-17. Copenhagen: [s.n.], 2001.
ZHAO, Q. et al. Global, regional, and national burden of mortality associated with non-optimal ambient temperatures from2000 to 2019: a three-stage modelling study. Lancet Planet Health, vol. 05, n. 07, 2021. Available in: doi: 10.1016/S2542-5196(21)00081-4. Access in: 27 jul. 2022.
[1]Master in Mechanical Engineering from the University of Taubaté (UNITAU), MBA in Business Management from Fundação Getúlio Vargas (FGV), MBA in Project Management from the Foundation supporting CEFET/RJ, Specialist in Occupational Safety Engineering from Universidade Candido Mendes ( UCAM), Specialist in Petroleum Engineering from Universidade Estácio de Sá (UNESA), Graduated in Petroleum Engineering from Universidade Estácio de Sá (UNESA) and Graduated in Mechanical Technology with emphasis on Industrial Automation from CEFET/RJ, and certified Radioprotection Supervisor by CNEN. ORCID: 0000-0002-6647-3914.
[2]Advisor. Graduated in Architecture and Urbanism from the University of Taubaté, UNITAU, with a postgraduate degree in Marketing Management and Occupational Safety Engineering from the Polytechnic School of Pernambuco. Master in Regional Development Management from UNITAU and PhD in Production Engineering from Escola Politécnica da USP. ORCID: 0000-0001-8082-5763.
Sent: August, 2022.
Approved: September, 2022.