ORIGINAL ARTICLE
BEZERRA, Cicero Wellington Brito [1], NUNES, Gabrielle Pinto Soares Moura [2], GOES, Mauro Cosme de Carvalho [3], CRUZ, Francisco Fernandes da Silva da [4], NASCIMENTO, Ulisses Magalhães [5], SANTANA, Claudemir Gomes de [6], CARDOSO, Jaciene Jesus Freitas [7], SANTANA, Sirlane Aparecida Abreu [8], MELO, Suzyeth Monteiro [9]
BEZERRA, Cicero Wellington Brito. et al. Simplified electrocoagulation for efficient biodiesel washing water treatment. Revista Científica Multidisciplinar Núcleo do Conhecimento. Year. 08, Ed. 10, Vol. 02, pp. 136-165. Outubro de 2023. ISSN: 2448-0959, Access link: https://www.nucleodoconhecimento.com.br/quimica-en/simplified-electrocoagulation, DOI: 10.32749/nucleodoconhecimento.com.br/quimica-en/simplified-electrocoagulation
ABSTRACT
Biodiesel is commonly purified by washing with water, but its improper disposal poses serious environmental and economic issues. Electrocoagulation (EC) is an attractive technique for treating biodiesel fuel wastewater, owing to its effectiveness, ease of operation, and low cost operation. In this study, an experimental factorial design was employed to investigated the minimum parameters required for efficient and cost-effective treatment (pH: 3 – 9; voltage: 5 – 20 V). All experiments were conducted at room temperature (25º C) using a 1 L acrylic monopolar batch reactor. Aluminum electrode (12x5x 0.1cm) were used. The effluents were characterized before and after treatments, measuring Chemical Oxygen Demand (COD), pH, color, turbidity, conductivity, Dissolved Oxygen (DO), Oil & Grease (O&G), Total Dissolved Solids (TDS), fixed solids, and volatile solids. Kinetic experiments were performed to determine the minimum operating time (30 min). The obtained results demonstrated significant removal of turbidity (94.5%), color (96.4%), COD (83.9%), conductivity (37%), and O&G (93%). Additionally, the experimental and theoretical values showed good agreement, allowing for the development of predictive mathematical models for the analytical responses.
Keywords: Sustainable water treatment, Electrochemical technology, Biodiesel wastewater, Oil-rich phase.
HIGHLIGHTS
The electrochemical treatment, despite its simplicity and speed, achieved significant removal percentages of turbidity, color, and COD;
Mathematical models were successfully developed to predict the experimental results;
The removal percentage obtained in 30 min of treatment closely matches the percentage obtained with one hour of treatment.
1.INTRODUCTION
Biofuels have emerged as a promising alternative to mitigate the environmental, social, and economic impacts resulting from the extensive use of non-renewable energy sources. These sustainable fuels not only contribute to improving environmental quality but also reduce reliance on imported oil, thereby bolstering national economies and generating employment opportunities (Liu et al., 2021; Jeswani, Chilvers and Azapagic, 2020; Hoekman et al., 2012)
Within the realm of renewable and clean energy resources, biodiesel has garnered increasing demand due to its distinct advantages over petroleum diesel. Notably, biodiesel offers several technical characteristics such as its bio-origin, biodegradability, higher flash point, excellent lubrication properties, and significantly lower emissions of harmful compounds like sulfur oxide, carbon oxides, particulates, air toxics, and unburned hydrocarbons (Chuah et al., 2017; Shimada and Cestari, 2020; Brasil, 2022).
Typically, biodiesel is produced through the transesterification reaction of vegetable oils and animal fats using a strong base catalyst (KOH or NaOH) in the presence of an excess of short-chain alcohol (methanol or ethanol). This process (Fig. 1) involves vigorous stirring to ensure proper mixing between the alcohol and oil and temperature control to enhance the conversion of triglycerides (oil) into methyl or ethyl ester (biodiesel) and by-product glycerol (Daud et al., 2015; Farooq, Ramli and Subbarao, 2013; Saifuddin, Samiunddin and Kumaran, 2015; Ramos et al., 2011).
Figure 1. Simplified flowchart of transesterification process for biodiesel production
As depicted in Fig. 1, additional critical steps in biodiesel production include the separation of the alcohol/glycerol phase from the crude biodiesel, wet washing and subsequent drying of the biodiesel, as well as acidification and separation of crude glycerol phase from alcohol. However, the esters produced by transesterification still contain various impurities, such as free glycerin, unreacted glycerides, soaps, catalysts, and residual alcohol. High levels of these impurities can severely compromise the burn emission quality and reduce engine lifespan (Daud et al., 2015; Ramos et al., 2011; Jeswani, Chilvers and Azapagic, 2020; Saifuddin, Samiunddin and Kumaran, 2015, Chuah, et al., 2017, Putra et al., 2018). Thus, a purification process is to meet fuel quality criteria, as outlined in ANP’s Resolution 920/2023, (National Agency for Petroleum, Natural Gas and Biofuels) (Brasil, 2023), and to remove excess contaminants.
Currently, the industry employs wet washing to effectively remove biodiesel impurities due to the high solubility that alcohol, alkaline catalyst, and glycerol in water, the industry uses wet washing for the effective removal of such biodiesel impurities (Quadros et al., 2011). This process involves using warm, slightly acidic water to neutralize the alkaline catalyst, followed by successive washes with distilled water to remove remaining hydrophilic contaminants. However, this approach generates a significant volume of residual water effluent, especially considering Brazil’s annual biodiesel production of approximately 5.5 billion liters, resulting in approximately 12.9 billion liters of effluent per year (Biofuels Annual, 2018). Furthermore, the composition of this effluent includes an alkaline pH, a significant presence of catalyst, a high content of Oils and Greases (O&G), and low nitrogen concentration, making natural degradation challenging (Farooq, Ramli and Subbarao, 2013). Therefore, establishing economically attractive effective and easy-to-operate effluent treatment systems is becoming increasingly critical to comply with stringent quality specifications and environmental concerns, especially considering the mandatory increase in biofuel misture percentages in fossil diesel (Brasil, 2023).
To address this issue, researchers have explored various technologies for biodiesel wastewater treatment, including biological, physicochemical, electrochemical, and combined processes (An et al., 2017; Jaruwat, Pitakpoolsil and Hunsom, 2016; Gomes, Arroyo and Pereira, 2015; Sari-erkan, 2019; Goés et al., 2021a; Desai et al., 2017; Savci, 2017; Alves et al., 2016; Daud, Nasir and Awang, 2013; Ngamlerdpokin et al., 2011, Nidheesh, Zhou and Oturan, 2018). Among these methodologies, electrocoagulation has gained significant interest in the past decade due to its simplicity, ease of operation, shorter treatment time, rapid sedimentation of electrostatic flakes, lower sludge production, and high efficiency (Chen et al., 2021; Goés et al., 2021b; Shahedi et al., 2020). Another advantage of this technique is the absence of chemical addition, since the electrolytic cell provides the necessary coagulating (Goés et al., 2021b). Essentially, electrocoagulation involves passing an electrical current through sacrificial electrodes (usually aluminum), leading to the generation of a coagulating agent and H2(g) bubbles (Shahedi et al., 2020).
Numerous studies have demonstrated the high efficiency of electrocoagulation in removing various critical contaminants, including dyes, heavy metals, emulsions, and especially O&G (Goés et al., 2021b; Nidheesh et al., 2021; Bazrafshan et al., 2015; Razali, Hamid and Azoddein, 2016; Daud et al. 2015; De Meneses et al., 2012; An et al., 2017; Rincón and La Motta, 2014; Cordeiro et al., 2015; Vieira et al., 2017;). Notably, the reported efficiencies for O&G removal consistently been high ranging from 82% to 99% in just 30 minutes, motivating further exploration of simplified conditions (pH and voltage parameters) for the treatment of biodiesel wastewater (Ahmadi et al., 2013; Srirangsan, Ongwandee and Chavalparit, 2009; Siles et al., 2011).
In this study, we investigate the use of electrocoagulation technology under simplified conditions for the efficient treatment of biodiesel wastewater. By optimizing the key parameters of this process, we aim to develop an economically viable and environmentally friendly approach to meet the increasingly stringent regulatory requirements for biodiesel production.
2. MATERIAL AND METHODS
The chemicals used in this study were of analytical grade and used directly as supplied. They included KOH, KCl, methanol, and n-hexane (Isofar, Duque de Caxias, Rio de Janeiro, Brazil), HCl (Emsure®, Merck-Millipore, São Paulo, Brazil). Distilled water was exclusively used in the biodiesel washing and in the preparation of the acid solutions. Refined soybean oil was purchased from a local store.
2.1 WASH WATER
The wastewater employed in this study was generated during the lab-scale preparation of biodiesel. Briefly, the process involved using 1.0 Kg of soybean oil, 400 mL of methanol, and 15.0 g of catalyst (KOH). The methoxide solution was prepared by adding the KOH catalyst to methanol. The clean oil was then heated to 55 ºC on a hot plate, and the methoxide solution was carefully added to the oil flask while stirring for 90 min. Afterward, the mixture was transferred to the separatory funnel and after a 12 h of rest, the glycerin was removed.
The resulting crude biodiesel was washed initially with a 0.5 % HCl solution (to neutralize the catalyst) at 50 ºC, followed by successively washes with distilled water (at least five times) until reaching a neutron pH. This process aimed to remove any remaining methanol, catalyst, and glycerol from biodiesel. It is noteworthy that approximately 3 L of water were required to wash and neutralize 1 liter of prepared biodiesel. Samples of these wastewater streams were collected and analyzed for further investigation.
2.2 WASH WATER ANALYSIS
To assess the treatment efficiency, the following analyses were conducted on the wastewater: pH, Dissolved Oxygen Concentration (DO), Conductivity, Turbidity, Oil, and Grease (O&G), Total Dissolved Solids (TDS), Total Fixed Solid (TFS), Total Volatile Solids (TVS), and Color. All characterization analyses were performed following the official methods of analysis (Apha, Awwa and Wef, 2017). The pH analyses (SM 4500-H+) were performed using a digital pHmeter from the Tecnal Equipamentos Científicos, equipped with temperature correction. The dissolved oxygen concentrations (SM 4500-O) were measured using a multi-parameter equipment from Hanna Instruments. Conductivity was determined using a digital conductivity meter from Analyser Instrument, model 650. Turbidity measurements were conducted using the Nephelometric (NTU) method with a turbidimeter from Hanna Instruments, model HI 98713. For O&G determinations, the gravimetric method (SM 5520) with n-hexane extraction was employed. Total solids, fixed solids, and volatile solids were measured using Standard Method SM 2540 B and2540 E, respectively. The effluent color was examined according to SM 2120 methodology.
2.3 EXPERIMENTAL DESIGN
In an effort to minimize the number of tests, reduce costs, and identify optimum treatment conditions, we employed a simplified experimental approach known as a 2n factorial design. Here, “n” represents the number of controlled variables, and “2” indicates the minimum and maximum numbers levels of various factors. Such a streamlined approach proves valuable considering the time and resources required for analysis. While this method may not comprehensively analyze all influencing factors, when relevant variables are selected, the results can indicate the technique’s potential, trends, and directions for further investigations. Consequently, this approach helps expedite pilot-scale studies aimed at establishing the most efficient treatment conditions.
The chosen variables for this factorial design were the initial pH (x1) and applied voltage (x2), as they are recognized as significant factors in the electrocoagulation treatment, based on existing literature (De Meneses et al., 2012; Siles et al., 2011; Chavalparit and Ongwandee, 2009; Fernandes et al., 2016, Fernandes et al., 2021). Table 1 display the specific levels and combinations of these variables used as more significant variables.
Table 1. Original and coded labels of the selected variables
| Factors | Original Factor (x) | Coded Factors (X) | ||
| -1 | 0 | +1 | ||
| pHi | x1 | 3.0 | 6.0 | 9.0 |
| Applied Voltage/V | x2 | 5.0 | 12.5 | 20.0 |
Source: Author, 2023.
According to this planning, five tests were performed in duplicate and in a random manner. Table 2 shows the variation of the two major variables selected.
Table 2. Model matrix for 22design
| Tests | Coded factors | Process variables | ||
| x1 | x2 | pHi | Applied Voltage/V | |
| A | -1 | -1 | 3.0 | 5.0 |
| B | 0 | 0 | 6.0 | 12.5 |
| C | -1 | +1 | 3.0 | 20.0 |
| D | +1 | -1 | 9.0 | 5.0 |
| E | +1 | +1 | 9.0 | 20.0 |
Source: Author, 2023.
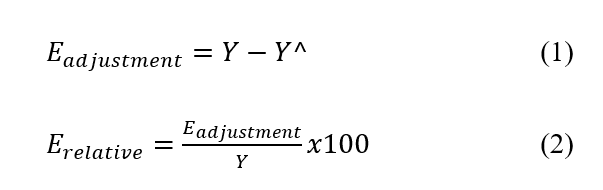
The equations (1) and (2) were utilized to evaluate the similarity between the experimental outcomes and the predictions generated by the model (Rodrigues and Iemma, 2014).
Where ![]() corresponds to the experimental value and
corresponds to the experimental value and ![]() to the model response.
to the model response.
The desirability function proposed by Derringer and Suich (1980) aims to identify the optimal values for each analyzed variable based on the experimental design. Each response variable is converted into a function ![]() with a numerical range from 0 to 1, where 1 represents the maximum desirability, and 0 indicates the minimum desirability, as outlined in equations (3) to (5). In these equations, α and β represent the lowest and highest values obtained from the ith response variable, respectively, while wi represents the importance level. The desirability predicted by the mathematical model for each dependent variable is integrated with the Desirability Function (DF), leading to determination of the overall desirability.
with a numerical range from 0 to 1, where 1 represents the maximum desirability, and 0 indicates the minimum desirability, as outlined in equations (3) to (5). In these equations, α and β represent the lowest and highest values obtained from the ith response variable, respectively, while wi represents the importance level. The desirability predicted by the mathematical model for each dependent variable is integrated with the Desirability Function (DF), leading to determination of the overall desirability.
2.4 BATCH REACTOR
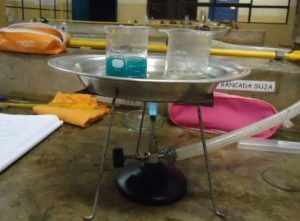
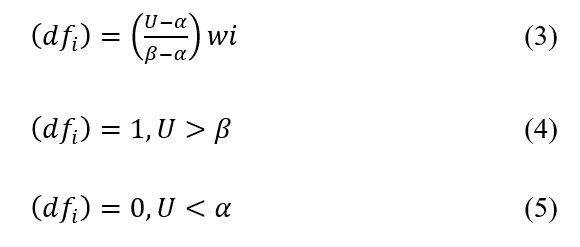
There are various design possibilities for an electrolytic cell, and multiple factors can influence the electrolysis reactions and, consequently, the treatment outcome of a liquid effluent (Daud et al., 2015; An et al., 2017; Derringer and Suich, 1980). However, to maintain simplicity, we opted for an elementary electrochemical module. The experimental setup is illustrated in Fig 2. The EC cell was assembled using a 1 L cylindrical acrylic beaker, with a wooden cover to support the set of electrodes. Two aluminum plates, each measuring 12x5x0.1, were employed as the electrodes, and teflon spacers were utilized to maintain a fixed distance of 0.01 m between them. The respective area of each electrode was 0.00486 m2. Throughout the experiments, 500 mL of wastewater was placed in the EC cell and stirred at 200 rpm, with the temperature maintained at 27±2 oC. The treatment process lasted for 60 min for each run.
The current density in the batch reactor was controlled using a Nadal Digital Power Feed Source, which allowed for voltage adjustment within the range of 0 to 25 V. Regular samples of the liquid were taken at intervals for analysis, focusing on key parameters such as COD and turbidity. Additionally, it was crucial to maintain the settled wastewater at the desired pH level, which was achieved by carefully adjusting the pH using either HCl or NaOH solutions.
Figure 2. Schematic illustration of bench scale EC reactor with monopolar aluminum electrodes: a) DC power supply; b) aluminum electrodes (+ anode; – cathode); c) acrylic container; d) stirring plate
2.5 EVALUATION OF ELECTRODE CONSUMPTION AND ENERGY EXPENDITURE
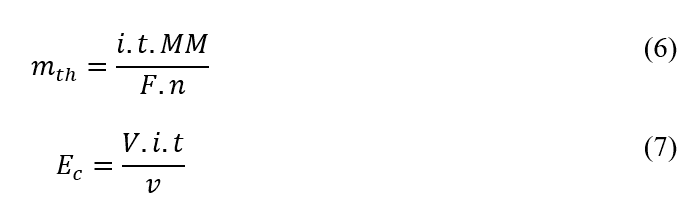
The consumed mass of the electrode and Energy Consumption (EC) were calculated by Eqs. (6) and (7), respectively, using the following parameters: where: i represents the operating current (A), t is the reaction time (h), MM is the molar mass of the aluminum (g mol-1), F is the Faraday’s constant (C mol-1), n is the number of electrons involved in the aluminum oxidation reaction (nAl = 3), V is the operating voltage (volt), and v is the volume of effluent (m3). These equations are widely in the field, providing reliable estimations of electrode consumption and energy expenditure (Crespilho and Rezende, 2004; Cerqueira, Souza and Marques, 2014; Kobya et al., 2006).
2.6 ELECTROCOAGULATION KINETICS
After the establishment of the best CE conditions, kinetic studies were carried out in order to better evaluate the experimental design. Every 10 min, for a total of 60 min, an aliquot was removed from the electrochemical cell for analysis of color, turbidity, and COD. The results obtained were adjusted to the first and second-order kinetic models according to equations 8 and 9 (Azizian, 2004):
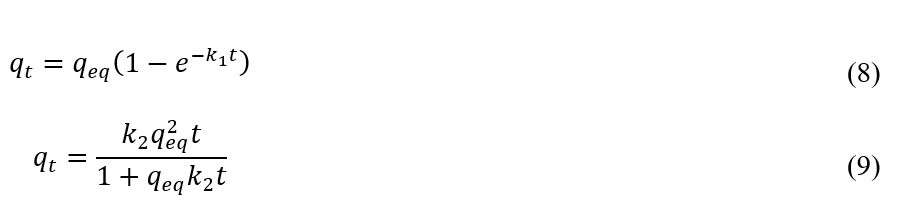
where qeq(mg g-1) is the adsorbed amount on equilibrium; qt (mg g-1) is the adsorption capacity at time t (min); k1 (min-1) and k2(g mg-1 min-1) are the pseudo-first order and the second-order rate constants, respectively.
3. RESULTS AND DISCUSSION
3.1 WASTEWATER CHARACTERIZATION (CRUDE EFFLUENT)
The biodiesel production system strongly influences the characteristics of the biodiesel wastewater, which can present different percentages of free fatty acids (non-transesterified), alcohol, glycerol, soap, and part of the catalyst (Azizian, 2004; Daud et al., 2015). As a result, some variation in the average values for the physical-chemical parameters of this effluent is expected. Veljković, Stamenković, &Tasić (2014), for example, demonstrated ranges for pH (3.3–11.2), Chemical Oxygen Demand (COD, 11–590 g L-1), Biologic Oxygen Demand (BOD, 1.6–300 g/L), grease and oil (0.4–22 g L-1), Total Organic Carbon (TOC, 1.7–40 g/L) and total suspended solids (0.3–8.9 g L-1). Table 3 presents the mean values for the analyzed parameters in this work and the limits established by the National Environment Council, CONAMA Resolutions 430/2011 and 357/2005, which provides the conditions and standards for effluent releases. Although CONAMA’s Resolution 430/2011, does not establish turbidity, color and DO values, it complements Resolution 357/2005, which determines the quality conditions of Class 1 Fresh Waters for turbidity, DO, and color (Brasil, 2011; Brasil 2005).
The comparison between the values of the parameters presented by the CE and the recommended effluent limitation guidelines in Brazil reveals that turbidity, color, and DO are critical parameters for this class of effluent. For instance, color levels (mg Pt L-1) should be natural to the water body and virtually absent in the case of dyes from anthropic sources. The high turbidity level presented by this effluent, which is related to the concentration of emulsion droplets and the particulates present, exceeded the recommended limits, indicating that high values of color and turbidity would impair the penetration of light and, consequently, the photosynthesis, thereby interfering with the natural balance of the aquatic environment (Sharma, Sharma and Soni, 2021). Dissolved Oxygen (DO), which indicates the amount of this gas in solution and the consequent water quality, also presented a problem. Low values of dissolved oxygen (< 2 mg L-1) characterize an environmental condition called hypoxia, endangering the lives of several aquatic organisms. Although the DO value for the CE effluent falls below the indicated regulated limits, it does not represent an extreme condition of hypoxia or anoxia. However, it highlights the necessity to aerate the effluent during treatment, and as such, this parameter should be closely monitored throughout the treatment.
Table 3. Parameters of biodiesel wastewaters and permissible limit (range)
| Parameter | Average values found | Standards established by CONAMA a |
| pH | 3.01 | 5 – 9 |
| Temperature / °C | 25.7 | < 40 e ΔT < 3 at the mixing zone limit |
| Color / mg Pt L-1 | 445 | Natural to the water body |
| Turbidity / NTU b | >750 | < 40 |
| Conductivity / µS cm-1 | 299 | – |
| DO / mg L-1 | 4.80 | > 6 |
| COD / mg O2 L-1 | 320 | – |
| O&G / mg L-1 | 16.02 | Mineral oils 20; vegetable oils and animal fats 50 |
| Total Dissolved Solids / mg L-1 | 7.700 | – |
| Total Fixed Solids / mg L-1 | 400 | – |
| Total Volatile Solids / mg L-1 | 7.300 | – |
Source: aCONAMA 430/2011, 357/2005. b NTU – Nephelometric turbidity unit.
In light of these findings, it is evident that further treatment is necessary for the biodiesel wastewater before discharging it into the environment to comply with the established regulatory standards. Potential aeration methods can be considered to improve dissolved oxygen levels, while additional treatments may be explored to address turbidity and color concerns. Implementing appropriate mitigation strategies and optimizing the treatment process will be vital in achieving efficient and environmentally responsible biodiesel wastewater management.
3.2 STATISTICAL ANALYSES
Analysis of Variance (ANOVA) was conducted to obtain the predictive and adjusted models. Table 4 presents the results obtained, with emphasis on terms that were not statistically significant (p < 0.05). As shown, all effects were statistically significant for color and turbidity, while only the voltage was significant for COD. The Pareto diagram (Fig. 3) provides a clear representation of the statistically important effects. Effects beyond the dotted line, defined at 0.05, should be included in the mathematical model. The independent variable that most positively influenced responses was the applied voltage. Thus, higher voltage led to greater removal of turbidity, color, and COD. The pH and pH-voltage factors were not significant for COD, as predicted by ANOVA.
Figure 4 presents a comparative graph between the observed and predicted values, in agreement with the percentage error values (> 20%) presented in Table 4. It is evident that the proposed model accurately describes the experimental data, showing high determination coefficients for turbidity (85.1%) and color (85.3%), with an even higher value for COD at 96.7%.
Figure 3. Pareto chart for variables effects and their interactions: (a) turbidity, (b) color and (c) COD
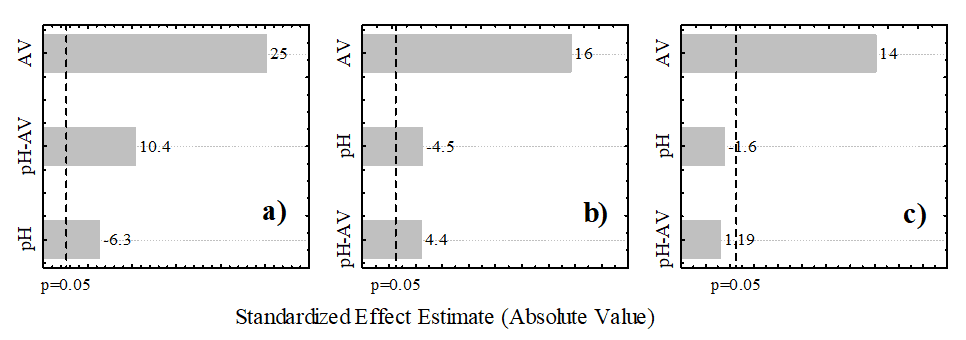
Figure 4. Experimental versus predicted values for the removal of (a) turbidity, (b) color and (c) COD
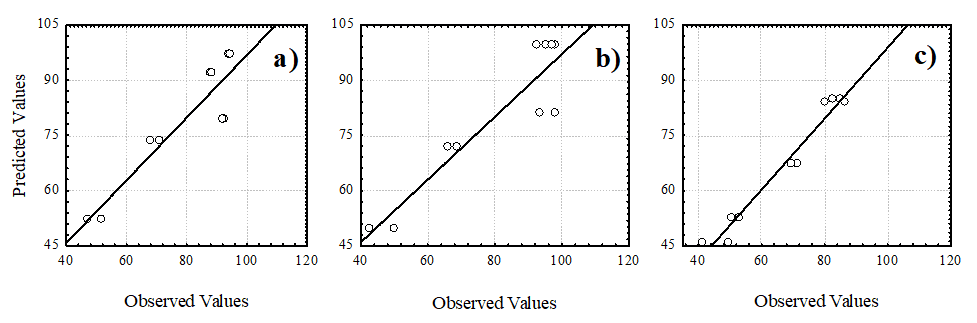
Table 4. ANOVA and relative error results for removing turbidity and color, and for COD
| Analysis of Variance | |||||||||||||||||
| Factor | Mean | pH | AVa | pH-AV | Lack of fit | PE b | Total SS | ||||||||||
| Turbidity | SS c | * | 127 | 2011 | 343 | 419 | 16 | 2916 | |||||||||
| p-value | * | < 0.05 | < 0.05 | < 0.05 | < 0.05 | * | * | ||||||||||
| Regr. coeff. d | 82.0 | – 4.96 | 0.369 | 0.291 | * | * | * | ||||||||||
| p-value | < 0.05 | < 0.05 | 0.107 | < 0.05 | * | * | * | ||||||||||
| Color | SS | * | 250 | 3031 | 243 | 547 | 62 | 4133 | |||||||||
| p-value | * | < 0.05 | < 0.05 | < 0.05 | < 0.05 | * | * | ||||||||||
| Regr. coeff. | 77.2 | – 4.92 | 1.13 | 0.245 | * | * | * | ||||||||||
| p-value | < 0.05 | < 0.05 | < 0.05 | < 0.05 | * | * | * | ||||||||||
| COD | SS | * | 30.1 | 2460 | 18 | 24.8 | 62.1 | 2595 | |||||||||
| p-value | * | 0.18 | < 0.05 | 0.29 | 0.22 | * | * | ||||||||||
| Regr. coeff. | 46.4 | – 1.47 | 1.94 | 0.07 | * | * | * | ||||||||||
| p-value | < 0.05 | 0.12 | < 0.05 | 0.29 | * | * | * | ||||||||||
| Relative error | |||||||||||||||||
| Turbidity | E. value e | 68 | 47.4 | 87.9 | 94.3 | 92.6 | 71.2 | 51.9 | 88.5 | 94.6 | 92 | ||||||
| Pred. value f | 73.4 | 52.3 | 92 | 97.1 | 79.4 | 73.4 | 52.4 | 92 | 97.1 | 79.4 | |||||||
| RE / % g | 7.94 | 10.3 | 4.66 | 2.97 | 14.3 | 3.09 | 0.96 | 3.95 | 2.64 | 13.7 | |||||||
| Color | E. value | 68.8 | 42.7 | 98.2 | 95.5 | 93.3 | 66.1 | 50.2 | 92.5 | 97.3 | 98.2 | ||||||
| Pred. Value | 71.7 | 49.5 | 99.6 | 99.5 | 81 | 71.7 | 49.5 | 99.6 | 99.5 | 81 | |||||||
| RE / % | 4.22 | 15.9 | 1.43 | 4.19 | 13.2 | 8.47 | 1.39 | 7.68 | 2.26 | 17.5 | |||||||
| COD | E. value | 50.6 | 49.4 | 82.6 | 80.1 | 71.3 | 53.0 | 41.1 | 85.2 | 86.4 | 69.4 | ||||||
| Pred. Value | 52.7 | 45.9 | 84.8 | 83.9 | 67.2 | 52.7 | 45.9 | 84.3 | 83.9 | 67.2 | |||||||
| RE / % | 4.15 | 7.09 | 2.66 | 4.74 | 5.75 | 0.57 | 11.7 | 1.06 | 2.89 | 3.17 | |||||||
a Applied voltage, b Pure error, c Sum square, d Regression coefficient, e experimental value, f predicted value, g relative error, * not applicable.
Source: Author, 2023.
Despite the lack of significant adjustment for turbidity and color (Table 4), this does not preclude the development of a predictive model. The evaluation of the relative error was essential for constructing possible models with predictive characteristics (turbidity and color). Deviations less than or equal to 20% between observed and predicted data ensure a viable predictive model (Rodrigues and Iemma, 2014). Coded coefficients for each significant factor was determined (Table 4). These coefficients are important for validating the proposed models and describing the system’s behavior. The following equations express the response variables as a function of the statistically significant linear factors (p <0.05):
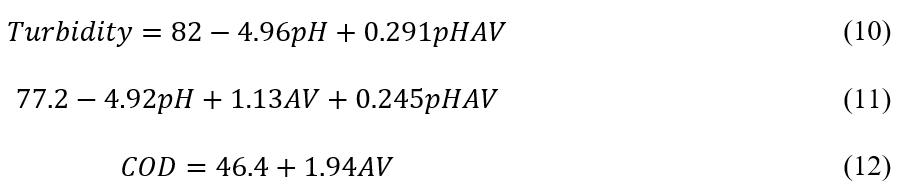
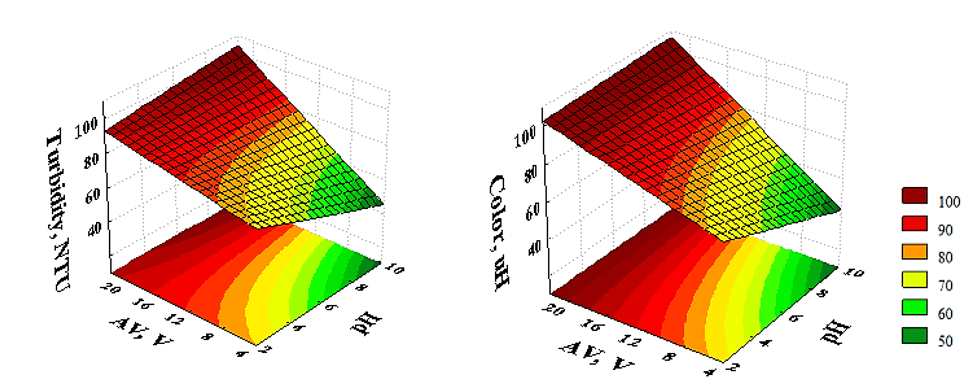
Response surfaces (Fig. 5) allow visualization of the experimental conditions that yield the best system operating responses. In this case, the response parameter is a function of two significant main effects of the model. Predicting the COD behavior could not be achieved in this manner, since the voltage is the only significant factor for the determined model, and at least two factors are necessary for its execution. For the other variables, it is evident that there is a linear behavior arising from the interaction between them. On both surfaces, higher voltage values promote an increase in the response variable. The pH profile has minimal interference in the best-operating conditions for the two three-dimensional sets since there is little curvature as a function of pH in the regions with the greatest potential for turbidity and color removal.
Figure 5. Response surfaces for the variables: turbidity and color
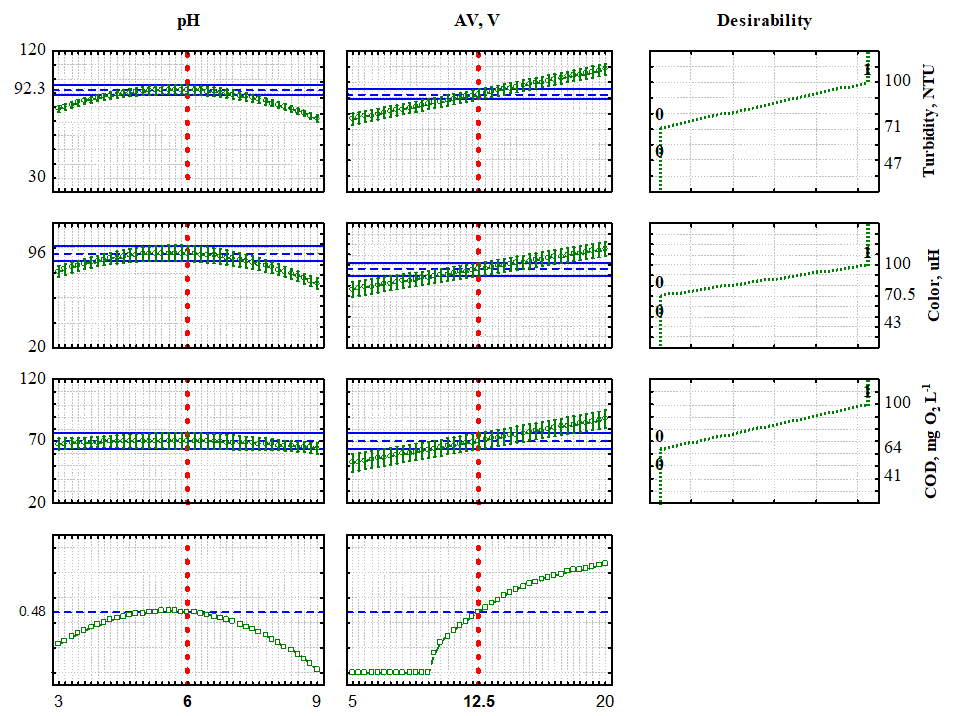
The desirability function revealed that pH 6.0 and an applied voltage of 12.5 V were identified as the optimal conditions investigated in this study. These values are represented by red dashed lines at the bottom of Fig. 6. On the right side of the figure, the desirability of achieving 100% removal for the three studied responses is illustrated. By considering these ideal conditions, it becomes feasible to attain the optimized values highlighted on the left side of the figure, thereby adapting the treated effluent to meet the standards for disposal in water bodies, as prescribed by Brazilian legislation.
Figure 6. Expected values and desirability for the removal of turbidity, color and COD
3.3 TREATMENT EFFICIENCY
Figure 7 visually illustrates the appearance of the generated effluent in biodiesel purification (RE) and after the electrolytic treatment, based on the predetermined conditions established by the factorial planning (Table 2).
Figure 7. Raw effluent (RE) and treated effluents (A – E) for each performed test (Table 2)
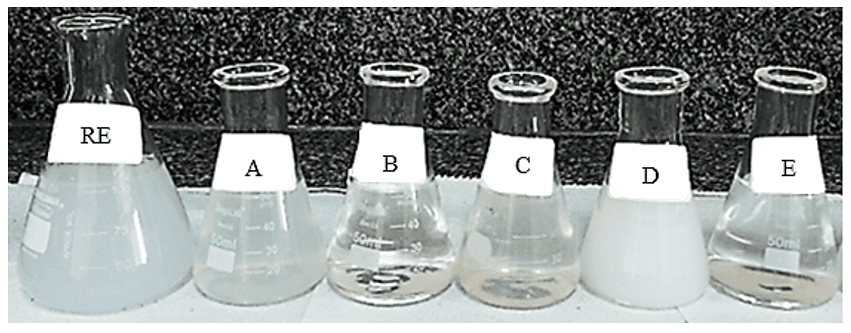
The raw Effluent (RE) exhibited a cloudy appearance with high turbidity (> 750 NTU) and color values. However, for most the conditions (except for the D and A-test with an applied voltage of 5 V), significant removal of turbidity and color was achieved, surpassing 90%, particularly reaching 92% in B (pH 6, applied voltage 12.5 V) and 94% in E (pH 9, applied voltage 20 V). Detailed results for all experimental conditions are presented in Table 5.
Table 5. The overall removal efficiency of the treatment processes (30 min)
| Tests | Process variables Removal, % | Experimental values | ||||||
| pHi | Voltag,
V |
Turbidity,
NTU |
Color,
uH |
COD,
mg O2 L-1 |
pHf | Conductivit
μScm-1 |
DO, mg L-1 | |
| A | 3.00 | 5.00 | 69.6 +1.6 | 67.4 +1.3 | 51.8 +1.2 | 4.95 +1.42 | 200.5 +1.1 | 5.43+1.51 |
| B | 6.00 | 12.5 | 92.3 +0.3 | 95.8 +2.4 | 70.3 +0.9 | 8.42 +0.67 | 260.5 +0.8 | 4.49+0.87 |
| C | 3.00 | 20.0 | 88.2 +0.3 | 95,3 +2.9 | 83.9 +1.3 | 4.85 +2.18 | 202.1+0.9 | 5.50 +1.28 |
| D | 9.00 | 5.00 | 49.6 +2.3 | 46.5 +3.8 | 45.2 +4.1 | 8.16 +0.95 | 258.1+1.5 | 4.95+0.97 |
| E | 9.00 | 20.0 | 94.5 +0.2 | 96.4 +0.9 | 83.3 +0.3 | 8.77 +1.48 | 254.5 +2.2 | 4.12 +2.36 |
Source: Author, 2023.
The chemistry of Al3+ is highly dependent on the pH, making the initial pH of the effluent a crucial operational factor that significantly influences the performance of the electrochemical process. Throughout the electrocoagulation process, there is observed variation in the pH of the effluent, as indicated in Table 5. Similar findings were reported by Mouedhen et al. (2008), who observed that an initially acidic pH results in an increase in the final pH, while the opposite occurs for an alkaline initial pH. This phenomenon can be attributed to the production of hydrogen at the cathode, generating an excess of OH– ions, as well as the formation of the aluminate ions in the presence of an alkaline environmental, reducing the availability of OH– ions. Moreover, the increase in pH is also influenced by the transfer of CO2, which is released from the medium due to the agitation caused by H2 bubbles (Chen, Chen and Yue, 2000).
3.4 KINETICS STUDIES
Kinetic tests were conducted under the optimal experimental conditions, specifically at pH 6 and 12.5V, and pH 9 and 20 V, to determine the minimum required time for the electrochemical treatment to achieve maximum efficiency in treating the effluent. The results presented in Fig. 8 illustrate the impact of varying the electrolysis time (0 to 60 min) on turbidity and color removal efficiency, as well as the percentage reduction in the amount of chemical oxidant needed to oxidize the remaining organic matter (COD) in the effluent.
Notable, a substantial removal of turbidity and color (~ 90%) is observed within the first 20 minutes. As the electrolysis time is extended, the removal efficiency improves, leading to visually clear effluent with values that comply with the current Brazilian regulations. The minimum time required to attain maximum removal values under both conditions was approximately 30 minutes. The kinetic model that exhibited the best fit was the pseudo-first order, yielding compatible theoretical and experimental removals (Table 6), except for COD values, at pH 6 and 12.5 V. In this particular case, the velocity constant value suggests no adsorption, which contradicts the experimental observations, indicating a lack of fit for the model.
Figure 8. Time-dependent removal efficiency for color, turbidity and COD
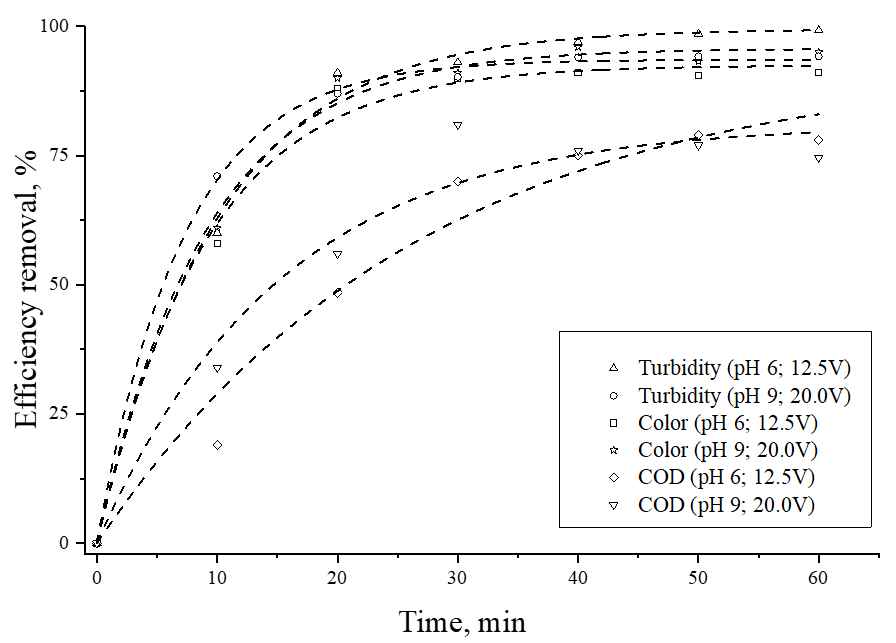
Table 6. Results of pseudo–first-order kinetic model fit for turbidity, color and COD removal.
| Response variable | Experimental conditions | Re. exp.a,
% |
Re. theo.b,
% |
k1,
min-1 |
R2
|
| Turbidity | pH 6.0; 12.5 V | 99.2 | 99.5 | 0.100 | 1.00 |
| pH 9.0; 20.0 V | 94.2 | 93.6 | 0.100 | 1.00 | |
| Color | pH 6.0; 12.5 V | 91.0 | 92.5 | 0.100 | 1.00 |
| pH 9.0; 20.0 V | 96.0 | 95.7 | 0.100 | 1.00 | |
| COD | pH 6.0; 12.5 V | 79.0 | 92.9 | 0.000 | 1.00 |
| pH 9.0; 20.0 V | 81.0 | 81.2 | 0.100 | 1.00 |
a Experimental removal rate, b Theoretical removal rate.
Source: Author, 2023.
Although Brazilian regulations do not specifically mention the chemical oxygen demand parameter (COD) in classifying water bodies or setting standards for the discharge of liquid effluents, this analysis is commonly used as an indicator of organic matter concentration in samples (Brasil, 2011). As evident from Fig. 8, after 30 min of treatment, the amount of material to remove the remaining organic matter in the effluent significantly decreases (70% for pH 6, 12.5V; and 80% for pH 9, 20V) compare to untreated effluent, highlighting the efficiency and success of the adopted procedures. The use of this technique, depending on the pH, impacts electrode consumption. Additionally, metal ions released as result of pH-dependent hydrolysis of aluminum interact with suspended particles, facilitating their removal (Goés et al., 2021b).
Table 7 display the electrode and energy consumption at 30 minutes and 60 minutes. The experimental obtained values align with literature data (De Meneses et al., 2012; Cerqueira, Souza and Marques, 2014). A comparison between theoretical and experimental mass loss indicates that due to aluminum’s oxidation potential and its amphoteric nature, Al3+ ions are spontaneously formed. Typically, at alkaline pH (>9), aluminum hydroxide flakes exhibit reduced reactivity, leading to less effective flocculation (Cerqueira, Souza and Marques, 2014). Nevertheless, the results demonstrate significant removal efficiency at pH 9.
Table 7. Loss of electrode mass and energy consumption in the best conditions.
| Used conditions | Theoretical mass loss,
Mg |
Experimental mass loss,
mg |
Energy consumed
kWhm-3 |
||
| pH | Voltage, V | Time, min | |||
| 6.0 | 12.5 | 60 | 100.73 | 135 + 25.1 | 7.5 |
| 6.0 | 12.5 | 30 | 50.36 | 72 + 15.7 | 3.7 |
| 9.0 | 20.0 | 60 | 301.17 | 382 + 29.4 | 11.8 |
| 9.0 | 20.0 | 30 | 195.40 | 210 + 25.1 | 9.4 |
Source: Author, 2023.
Under the best pH and voltage conditions, as well as the lower cost (lower electrode mass loss, reduced electrical power, and pH closer to the effluent), parameters such as conductivity, dissolved oxygen, and O&G were also investigated in the final effluent. The original values of conductivity and O&G in the crude oil (Table 3) were respectively reduced by 37 and 93%, with no significant variation observed for DO. As evident, the simplified methodology employed was highly effective, aligning the effluent characteristics with the regulatory requirements for discharge into water bodies or for potential reuse.
4. CONCLUSION
The electrocoagulation process demonstrated remarkable efficiency in removing key parameters such as pH, O&G, color, turbidity, and COD. In just 30 minutes of treatment, we achieved impressive removal efficiencies of up 98% for color, turbidity, and COD parameters and 93% for O&G. All investigated parameters were effectively treated. Despite its simplified nature, this treatment method enabled the effluent to meet current Brazilian legislation requirements.
The kinetic study further highlighted the effectiveness of the electrocoagulation process, showing that significant removal could be attained within a much shorter treatment time compared to longer durations. This finding not only underscores the efficiency of the technique but also has implications for cost-effectiveness, as shorter treatment times can reduce operational expenses.
However, despite achieving high removal rates and the obtaining treated effluent under optimal conditions, it is crucial to identify a working range that generates statistically significant effects to develop a systematic approach to the electrolytic treatment.
In conclusion, the electrocoagulation process holds great promise for the treatment of biodiesel wastewater, offering substantial removal efficiencies for color, turbidity, and COD. While meeting regulatory standards remains a challenge, continued research and optimization efforts can lead to an environmentally compliant and cost-effective solution for treating biodiesel effluents. By establishing a well-defined working range and refining the electrolytic treatment process, we can ensure sustainable and efficient wastewater treatment, contributing to environmental preservation and resource conservation.
5. ACKNOWLEDGMENTS
The authors acknowledge financial support from PRH-ANP (Programa de Recursos Humanos da Agência Nacional de Petróleo, Gás Natural e Biocombustíveis) and FAPEMA (Fundação de Amparo à Pesquisa e ao Desenvolvimento Científico e Tecnológico do Maranhão).
REFERENCES
AHMADI, S. et al. Removal of oil from biodiesel wastewater by electrocoagulation method. Korean J. Chem. Eng. v. 30, p. 634–641, mar. 2013. DOI: https://doi.org/10.1007/s11814-012-0162-5.
ALVES, M et al. Biodiesel dry purification with sugarcane bagasse. Ind Crop Prod. v. 89, p. 119-127, oct. 2016. DOI: https://doi.org/10.1016/j.indcrop.2016.05.005.
AN, C. et al. Emerging usage of electrocoagulation technology for oil removal from wastewater: A review. Sci. Total Environ, v. 579, p.537-568, feb. 2017. DOI: https://doi.org/10.1016/j.scitotenv.2016.11.062.
BAIRD, R. B. (APHA), EATON, A. D. (AWWA), RICE, E. W. (WEF), Standart methods for the examination of water and wastewater. 23. ed. Washington:American Public Health Association, 2017.
AZIZIAN, S. Kinetic models of sorption: a theoretical analysis. J Colloid Interf Sci. v. 276, n. 1, p. 47-52, aug. 2004. DOI: https://doi.org/10.1016/j.jcis.2004.03.048.
BAZRAFSHAN, E. et al. Heavy metals removal from aqueous environments by electrocoagulation process– a systematic review. J Environ Health Sci Engineer, v. 13, n. 74, p. 1-16, oct. 2015. DOI: https://doi.org/10.1186/s40201-015-0233-8.
BIOFUELS ANNUAL. Global Agricultural Information Network. GAIN Report Number BR18017, v. 17, oct. 2018. Disponível em: <https://www.fas.usda.gov/data/brazil-biofuels-annual-4>. Acesso em: 15 jul. 2023.
BRASIL. Agência Nacional do Petróleo, Gás Natural e Biocombustíveis. Anuário Estatístico 2022. Disponível em: <https://www.gov.br/anp/pt-br/centrais-de-conteudo/publicacoes/anuario-estatistico/anuario-estatistico-2022>. Acesso em: 28 ago. 2023.
BRASIL. Agência Nacional do Petróleo, Gás Natural e Biocombustíveis. Resolução ANP n° 920 de 04 de abril de 2023. Estabelece a especificação do biodiesel e as obrigações quanto ao controle da qualidade a serem atendidas pelos agentes econômicos que comercializem o produto em território nacional. Diário Oficial da União; Brasília; 2023. Disponível em: <https://www.gov.br/anp/pt-br/assuntos/producaoefornecimentodebiocombustiveis/biodiesel/especificacao-do-biodiesel>. Acesso em: 31 ago. 2023.
BRASIL. Ministério do Meio Ambiente. Resolução CONAMAn° 357 de 17 de março de 2005. Dispõe sobre a classificação dos corpos de água e diretrizes ambientais para o seu enquadramento, bem como estabelece as condições e padrões de lançamento de efluentes, e dá outras providências. Diário Oficial da União; Brasília; 2005. Disponível em: https://www.icmbio.gov.br/cepsul/images/stories/legislacao/Resolucao/2005/res_conama_357_2005_classificacao_corpos_agua_rtfcda_altrd_res_393_2007_397_2008_410_2009_430_2011.pdf. Acesso em: 20 maio 2023.
BRASIL. Ministério do Meio Ambiente. Resolução CONAMAn° 430 de 13 de maio de 2011. Dispõe sobre as condições e padrões de lançamento de efluentes, complementa e altera a Resolução nº 357, de 17 de março de 2005, do Conselho Nacional do Meio Ambiente-CONAMA. Diário Oficial da União; Brasília; 2011. Disponível em: <https://www.suape.pe.gov.br/pt/publicacoes/245-resolucao/185-conama-n-430-de-2011?layout=publicacoes.>. Acesso em: 20 maio 2023.
CERQUEIRA, A. A.; SOUZA, P. S. A.; MARQUES, M. R. C. Effects of direct and alternating current on the treatment of oily water in an electroflocculation process. Brazilian Journal of Chemical Engineering, v. 31, n 03, p. 693-701, 2014. DOI: dx.doi.org/10.1590/0104-6632.20140313s00002363.
CHAVALPARIT, O; ONGWANDEE, M., Optimizing electrocoagulation process for the treatment of biodiesel wastewater using response surface methodology. J Environ Sci, v. 21, n 11, p. 1491-1496, apr. 2009. DOI: https://doi.org/10.1016/S1001-0742(08)62445-6.
CHEN, R. et al. Evaluation of electrocoagulation process for high-strength swine wastewater pretreatment. Separation and Purification Technology, v. 272, p. 118900, oct. 2021. DOI: https://doi.org/10.1016/J.SEPPUR.2021.118900.
CHEN, X; CHEN, G; YUE, P. L. Separation of pollutants from restaurant wastewater by electrocoagulation. Separation and Purification Technology, v. 19, n 1–2, p. 65-76, jun. 2000. DOI: https://doi.org/10.1016/S1383-5866(99)00072-6.
CHUAH, L. et al. A review of cleaner intensification technologies in biodiesel production. J Clean Prod., v. 146, p. 181-193, mar. 2017. DOI: https://doi.org/10.1016/j.jclepro.2016.05.017.
CORDEIRO, R. et al., Purificação e reutilização de águas residuárias da produção de biodiesel por meio da eletrofloculação. Rev. Bras. Gest. Ambient., v. 2, n°2, p. 51-58, jun 2015.
CRESPILHO, F. N.; REZENDE, M. O. O. Eletroflotação: Princípios e aplicações. São Carlos: RiMa, 2004.
DAUD, N. M. et al. Production of biodiesel and its wastewater treatment technologies: A review. Process Saf. Environ. Prot, v. 94, p. 487-508, mar. 2015. DOI: https://doi.org/10.1016/j.psep.2014.10.009.
DAUD, Z.; NASIR, N.; AWANG, H. Treatment of biodiesel wastewater by coagulation and flocculation using polyaluminum chloride. Aust. J. Basic & App. Sci., v. 7, p. 258-262, 2013.
DE MENESES, J. M. et al. Treatment of biodiesel wastewater by electrocoagulation/flotation process: investigation of operational parameters. Quim. Nova, v. 35, n. 2, p. 235-240, 2012.
DERRINGER, G.; SUICH, R. Simultaneous Optimization of Several Response Variables J. Qual. Technol., v. 12, n. 4, p. 214-219, 1980.
DESAI, S. K. et al. Polyurethane functionalized starch nanoparticles for the purification of biodiesel. J. ApplPolym Sci. v. 134, feb. 2017. DOI: https://doi.org/10.1002/app.44463.
FAROOQ, M.; RAMLI, A.; SUBBARAO, D. Biodiesel production from waste cooking oil using bifunctional heterogeneous solid catalysts. J Clean Prod., v.59, p. 131-140, nov. 2013.
FERNANDES, T. F. et al. Planta experimental para tratamento de efluente da produção do biodiesel. In: FRANCISCO, P. R. M. et al. (Org.). Ciência, inovação e tecnologia: coletânea de publicações 2014/2015. Brasilia: EPGRAF, 2016, p. 222-228.
FERNANDES, T. F. et al. Performance of a two Chambers Reactor for the Treatment of an Oily Effluent by Electro flocculation. International Journal of Advanced Engineering, Management and Science, v. 7, n. 7, july 2021. DOI: https://dx.doi.org/10.22161/ijaems.77.7.
GOÉS, M. C. C. et al. Pectin and SDS as auxiliary flocculants for complementary treatment of textile wastewater by electrocoagulation. Korean Journal of Chemical Engineering, v 38, n 8, p.1631–1641, jun. 2021a. DOI: https://doi:10.1007/s11814-021-0812-6.
GOÉS, M. C. C. et al. Sequential Design of Experiments for Removal of Methylene Blue Dye by Electrocoagulation Associated with Dissolved-Air System. Journal of the Brazilian Chemical Society, v. 32, n. 11, p. 2047–2060, jul. 2021b. DOI: https://doi.org/10.21577/0103-5053.20210095.
GOMES, M. C. S; ARROYO, P. A; PEREIRA, N. C. Influence of oil quality on biodiesel purification by ultrafiltration. Journal of Membrane Science, v. 496, p. 242-249, dec. 2015. DOI: https://doi.org/10.1016/j.memsci.2015.09.004.
HOEKMAN. S. K. et al. Review of biodiesel composition, properties, and specifications Renew SustEnerg Rev., v. 16, n. 143, p. 143-169, jan. 2012. DOI: https://doi.org/10.1016/j.rser.2011.07.143.
JARUWAT, P.; PITAKPOOLSIL W.; HUNSOM, M. Treatment of biodiesel wastewater by indirect electrooxidation: Effect of additives and process kinetics. Korean J Chem Eng., v. 33, p. 2090-2096, apr. 2016.
JESWANI, H. K. , CHILVERS, A.; AZAPAGIC, A. Environmental sustainability of biofuels: a review. Procedures of the royal society A. Londres, v. 476, n 2243, p. 1-37, nov. 2020. DOI: https://doi.org/10.1098/rspa.2020.0351.
KOBYA, M. et al. Treatment of potato chips manufacturing wastewater by electrocoagulation. Desalination, v. 190, n 1-3, p. 201-211, apr, 2006. DOI: https://doi.org/10.1016/j.desal.2005.10.006.
LIU, Y. et al. Biofuels for a sustainable future. Cell,v. 184, n. 6, p. 1636-1647, mar. 2021. DOI: https://doi.org/10.1016/j.cell.2021.01.052.
MOUEDHEN, G. et al. F. Behavior of aluminum electrodes in electrocoagulation process. J Harzad Mater., v. 150, n 1, p. 124-135, jan. 2008. DOI: https://doi.org/10.1016/j.jhazmat.2007.04.090.
NGAMLERDPOKIN, K. et al. Remediation of biodiesel wastewater by chemical- and electro-coagulation: a comparative study. Journal of environmental management., v. 92, n 10, p. 2454-2460, oct. 2011. DOI: https://doi.org/10.1016/j.jenvman.2011.05.006.
NIDHEESH, P.V. et al. An overview on combined electrocoagulation-degradation processes for the effective treatment of water and wastewater. Chemosphere, v. 263, p. 127907, jan. 2021. DOI: https://doi.org/10.1016/j.chemosphere.2020.127907.
NIDHEESH, P. V.; ZHOU, M.; OTURAN, M. A. An overview on the removal of synthetic dyes from water by electrochemical advanced oxidation processes. Chemosphere, v. 197, p. 210-227, apr. 2018. DOI: https://doi.org/10.1016/j.chemosphere.2017.12.195.
PUTRA, M. et al. A cleaner process for biodiesel production from waste cooking oil using waste materials as a heterogeneous catalyst and its kinetic study. Journal of Cleaner Production, v. 195, p. 1249-1258, sept. 2018. DOI: https://doi.org/10.1016/J.JCLEPRO.2018.06.010.
QUADROS, D. P. C. et al. Contaminantes em Biodiesel e Controle de qualidade. Rev. Virtual Quim., v. 3, n. 5, p. 376-384, oct., 2011.
RAMOS, L. P. et al. Tecnologias de Produção de Biodiesel Rev. Virtual Quim., v. 3, n 5, p. 385-405, oct., 2011.
RAZALI, M. N.; HAMID, M. Y. S.; AZODDEIN, A. A. M. Recovery of mineral oil from waste emulsion using electrocoagulation method. Matec Web of Conferences, v. 38, jan. 2016. DOI: https://doi.org/10.1051/matecconf/20163803005.
RINCÓN, G. J.; LA MOTTA, E. J. Simultaneous removal of oil and grease, and heavy metals from artificial bilge water using electro-coagulation/flotation. J. Environ. Management, v. 144, p., 42-50, nov. 2014. DOI: https://doi.org/10.1016/j.jenvman.2014.05.004.
RODRIGUES, M. I.; IEMMA A. F. Experimental design and process optimization. 1st edition. New York: CRC Press, 2014.
SAIFUDDIN, N., SAMIUNDDIN, A., KUMARAN, P.A Review on Processing Technology for Biodiesel Production. Trends Appl Sci Res., v. 10, n 1, p. 1-37, 2015. DOI: https://scialert.net/abstract/?doi=tasr.2015.1.37.
SARI-ERKAN, H. Wastewater treatment from the biodiesel production using waste cooking oil by electrocoagulation: a multivariate approach. Water Sci Technol., v.79, p. 2366–2377, jul. 2019. DOI: https://doi.org/10.2166/WST.2019.238.
SAVCI, S. Treatment of biodiesel wastewater using yellow mustard seeds. Turkish. Journal of Engineering, v. 1, n. 1, p. 11 – 17, may 2017. DOI: https://doi.org/10.31127/TUJE.315927.
SHAHEDI, A. et al. A review on industrial wastewater treatment via electrocoagulation processes. Current opinion in Electrochemistry, v. 22, p. 154-169, aug. 2020. DOI: https://doi.org/10.1016/j.coelec.2020.05.009.
SHARMA, J.; SHARMA, S.; SONI, V. Classification and impact of synthetic textile dyes on Aquatic Flora: A review. Regional Studies in Marine Science, v. 45, p. 101802, jun. 2021. DOI: https://doi.org/10.1016/j.rsma.2021.101802.
SHIMADA, G. B.; CESTARI, A. Synthesis of heterogeneous catalysts by the hydrolytic Sol-Gel method for the biodiesel production. Renewable Energy., v. 156, p. 389-394, aug. 2020. DOI: https://doi.org/10.1016/j.renene.2020.04.095.
SILES, J. A. et al. Physical–chemical and biomethanization treatments of wastewater from biodiesel manufacturing. Bioresource Technology, v. 102, n 10, p. 6348-6351, 2011. DOI: https://doi.org/10.1016/j.biortech.2011.02.106.
SRIRANGSAN, A; ONGWANDEE, M.; CHAVALPARIT, O. Treatment of Biodiesel Wastewater by Electrocoagulation Process. EnvironmentAsia, v. 2, n. 2, p. 15-19, jul 2009. DOI: https://doi.org/10.14456/ea.2009.11.
VELJKOVIĆ, V. B.; STAMENKOVIĆ, O. S.; TASIĆ, M. B. The wastewater treatment in the biodiesel production with alkali-catalyzed transesterification. Renewable and Sustainable Energy Reviews. v. 32, p. 40-60, jan. 2014. DOI: https://doi.org/10.1016/j.rser.2014.01.007.
VIEIRA, S. P.; OLIVEIRA, F. C. F.; CAVALCANTI, L. A. P. Síntese do percloreto de ferro a partir das águas residuais da produção de biodiesel tratadas por eletrofloculação para confecção de placas de circuito impresso. Holos, v.1, p. 205–213, jul 2017. DOI: https://doi.org/10.15628/holos.2017.5116.
[1] Advisor. He has a PhD in Physical Chemistry from the São Carlos Chemistry Institute (1999); Master’s degree in Analytical Chemistry from the São Carlos Chemistry Institute (1995), Bachelor’s degree in Industrial Chemistry from the Federal University of Maranhão (1992) and in Pedagogy from the Faculty of Maranhão – FACAM (2020). ORCID: https://orcid.org/0000-0001-9058-9469. Currículo Lattes: http://lattes.cnpq.br/1474300723265204.
[2] Master in Chemistry. ORCID: https://orcid.org/0009-0005-2328-1938. Currículo Lattes: http://lattes.cnpq.br/6787585972019020.
[3] PhD. ORCID: https://orcid.org/0000-0001-7056-8353. Currículo Lattes: https://lattes.cnpq.br/8611108545763667.
[4] Master in Chemistry. ORCID: https://orcid.org/0000-0002-5943-1513. Currículo Lattes: https://lattes.cnpq.br/4604039466178280.
[5] PhD. ORCID: https://orcid.org/0000-0003-0710-4745. Currículo Lattes: http://lattes.cnpq.br/3964114535425211.
[6] PhD in Analytical Chemistry, Master in Analytical Chemistry and Bachelor in Chemistry. ORCID: https://orcid.org/0000-0003-0917-2936. Currículo Lattes: http://lattes.cnpq.br/0005464426041071.
[7] PhD. ORCID: https://orcid.org/0000-0001-7181-0340. Currículo Lattes: https://lattes.cnpq.br/9623483674506357.
[8] PhD in Analytical Chemistry. ORCID: https://orcid.org/0000-0003-1872-3007. Currículo Lattes: http://lattes.cnpq.br/1052349578152491.
[9] PhD in Analytical and Inorganic Chemistry – IQSC/USP; Master’s degree in Biodiversity and Conservation-UFMA; Degree in Industrial Chemistry-UFMA. ORCID: https://orcid.org/0009-0006-9928-9941. Currículo Lattes: http://lattes.cnpq.br/6655290793830830.
Posted: August 9, 2023.
Approved: September 22, 2023.