ORIGINAL ARTICLE
MELO, Magaly Abreu de Andrade Palhares de [1], MELO, Luis Alberto Martins Palhares de [2], CALDAS, Camilo Onoda [3]
MELO, Magaly Abreu de Andrade Palhares de. MELO, Luis Alberto Martins Palhares de. CALDAS, Camilo Onoda. A quantitative assessment of mediation/conciliation as a process for improving the efficiency of the judiciary apparatus. Revista Científica Multidisciplinar Núcleo do Conhecimento. Year 06, Ed. 06, Vol. 17, pp. 129-155. June 2021. ISSN: 2448-0959, Access link: https://www.nucleodoconhecimento.com.br/law/judiciary-apparatus
ABSTRACT
The Judiciary Power is a body demanded by Brazilian society for the resolution of conflicts of the most varied natures and, therefore, it takes considerable time to finalize litigation. One way to speed up the Judiciary processes can be through mediation and conciliation procedures, which became public policies through the dictates of CNJ Resolution 125/2010, the 2015 New Code of Civil Procedure and the Mediation Law (Law No. 13,140/2015). This work aimed to evaluate and investigate the efficiency of mediation/conciliation in relation to the resolution of conflicts of cases dealt with in the Court of First Instance of the TJSP, TJRJ and TJPI. Basically, the assessment made considered estimates of the probability of occurrence of closing time of processes handled via mediation/conciliation and these estimated values were applied to actual data of processes processed (or still in progress) in Court in the period from 2013 to 2019, performing thus, a simulation of the scope of the duration of the process until its final closure. The simulation results showed a reasonable improvement in the efficiency of conflict resolution, quantitatively evaluated in terms of the reduction (1) of the time to process closure, (2) the process load/judge/year and (3) the process load /server/year. As a recommendation, it was suggested that further studies be carried out to assess the efficiency via mediation/conciliation with other data (procedural costs, personnel, court, etc.) to improve the robustness of the assessment of the mediation/conciliation.
Keywords: Mediation, Conciliation, Efficiency of the Judiciary, Speed of judicial proceedings.
INTRODUCTION
The Judiciary is an agency extremely demanded by Brazilian society for conflict management/resolution of various natures: labor, civil, consumerist, criminal, tax man, etc. This exacerbated demand causes a natural cramming of processes with slowness to judge them.
It is notorious the popular catchphrase that states that “justice is delong, but not fails”. This signals, in some way, a social stereotype related to justice. It is the image that the work of the judiciary takes place with slowness.
According to the arguments brought by Rutckeviski (2002) the image that justice does not follow the evolution of our era can be proven by the delay in resolving the conflicts demanded. The lack of procedural speed, therefore, is one of the greatest difficulties faced today due to the dense and dragged framework of the judiciary.
According to Alvim (2003), the intrinsic lack in the organizational structure of the Judiciary is one of the culprits for the slowness of the trials brought to him.
And in fact, several authors allude to the slowness of justice. For example, Rutckeviski (2002) comments that “the lack of procedural speed is one of the greatest difficulties faced today due to the dense and dragged framework of the judiciary”. Alvim (2003) comments on this slowness of justice considering that “the intrinsic lack in the organizational structure of the Judiciary is one of the culprits for the slowness of the trials brought to him”.
Thus, actions aimed at speeding up the judicial process itself can contribute considerably to its efficiency. In this context, the appropriate/alternative mechanisms of conflict resolution, mediation/conciliation/arbitration, are viable suggestions to harmonize and speed up procedures promoting as a consequence the undrowning of the judiciary, for example, as with mediation.
Mediation and Conciliation, despite being considered as contemporary and alternative mechanisms to the Judiciary, has some of its citations reported at the time of Confucius, but substantially became Public Policy through the dictates of Resolution 125/2010 of the CNJ, the New Code of Civil Procedure 2015 and the Mediation Law (Law No. 13.140/2015).
As a Public Policy, both mediation and conciliation were being demanded and corroborated with the implementation of Judiciary Centers for Conflict Resolution – CEJUSC and jointly and in line with the emergence of extrajudicial support structures, such as Chambers and Extrajudicial Services, as well as for the incentive the work of independent professionals, the so-called ad hoc mediators.
Thus, mediation/conciliation can be an alternative to speed up the processes, thus providing efficiency in the resolution of conflicts/judicial proceedings in relation to the time and allocation of human resources used to dissipate judicial litigation.
This study aimed to investigate the efficiency of mediation/conciliation in relation to the resolution of conflicts of cases dealt with in the Court at first instance. In the scope of this work, efficiency was quantitatively evaluated through four indicators: (1) the duration of the process; (2) the index of the number of cases being processed by a magistrate in a given year; (3) the index of the number of cases being processed per server operating in the 1st degree area in a given year and (4) the annual rate of closure of proceedings under way.
Basically the evaluation made in this work was to consider estimates of the probability of occurrence of closing time of cases treated via mediation / conciliation and apply these estimated values to actual data of cases processed (or still pending) in court in the period from 2013 to 2019, thus performing a simulation of the scope of the duration of the process until its definitive closure. The following procedures are presented.
MATERIALS AND METHODS
One way to consider the efficiency of the operation of the judicial system is made by assessing the speed of the life cycle of the processes that are being processed in the context of justice to resolve conflicts and, certainly, the shorter the life cycle of the process (until its definitive closure), the better the performance of the work of the judicial sphere That is. effectiveness and greater efficiency of this work. And a priori, what is postulated in this work is the fact that mediation and/or conciliation are processes that usually provide shorter life cycle time, when compared to resolution processes by the ‘traditional ways’ of Justice.
To measure the efficiency of mediation/conciliation, cases of first instance were chosen, because already at this stage the judicial system is somehow triggered and, thus, it is possible to carry out the investigation on the efficiency of the conciliatory process.
The basic data for the preparation of this work come from two data sources: (1) CNJ research data (2019) and (2) historical series data from 2013 to 2019, available on the CNJ website on the Internet (CNJ, 2021 ). In what follows, data from these sources used in this work are cited.
THE CNJ DATA (2019)
In CNJ (2019) a study was conducted with the objective of “investigating the flow and form of management of state first-degree justice processes (halls and courts of the interior and the capital), with respect to the existence of conciliation and/or mediation”. (CNJ,2019, p.19). In the data collection phase, the authors performed an automated evaluation procedure (text mining) of documents of judicial decisions published on the websites of the state courts of justice of Rio de Janeiro (TJRJ) and São Paulo (TJSP) referring to the processes initialized and finalized between January 2013 and December 2017, and documents of the Court of Justice of Piauí (TJPI) of processes of 2016 and 2017.
The text mining process implemented by the authors essentially consisted of applying searches in the digitized texts:
from some keyword that identifies the finalization of the processes after some conciliation or mediation procedure(…) thus, the processes in which the expression ‘homologated’ or any of its variations (‘homologous’) were searched (CNJ, 2019, p. 43).
The authors distinguish between “approved processes” and “non-approved processes”. The authors consider that according to the context of the research,
it is considered that the proceedings finalized by an homologatory judgment have undergone some kind of mediation or conciliation and, even if the process took place outside the judiciary (in the lawyers’ office, for example), the judicial machine was moved and, therefore, played some role in the outcome of the process (CNJ, 2019, p. 92).
Based on the data mining process, the authors estimated the percentage of approved processes and the percentage of processes not approved in the TJPI, TJRJ and TJSP, where an approved process, for the authors, is a process that had some kind of mediation/conciliation. One of the procedures provided the estimation of the rate of approved processes under the jurisdiction of the TJPI, TJRJ and TJPI. For this, the authors evaluated processes of 91, 81 and 317 municipalities in Piauí, Rio de Janeiro and São Paulo, respectively. The summarized data of the results obtained are presented in Table 1.
Table 1 – Rate of approved processes from processes of 91, 81 and 317 municipalities of Piauí, Rio de Janeiro and São Paulo, respectively
| UF | Number of municipalities evaluated | Evaluation period | Finished Processes Evaluated | Law Suit approved |
Law Suit approved(%) |
| PI | 91 | 2016 and 2017 | 92.236 | 1.908 | 2,07 % |
| RJ | 81 | 2013 to 2017 | 11.554.778 | 147.663 | 1,28 % |
| SP | 317 | 2013 to 2017 | 9.635.190 | 772.950 | 8,02 % |
Source: Prepared by the authors based on Tables 3, 9 and 12 of CNJ (2019).
In addition, the authors also carried out work to estimate the closing time of approved and non-approved processes. And it is the data from this work that serve as a basis for, in this present work, to use the estimates of the probability of occurrence of closing time of processes handled via mediation/conciliation.
To this end, the authors evaluated the duration of the processes (measured in days) based on a sample of 256,056 processes from 17 municipalities, five from Piauí, eight from São Paulo and four from Rio de Janeiro. In statistical jargon, the studied variable time of process duration is considered a random variable. Let us designate this variable as Y. The authors considered the variable Y (duration time) of the approved and non-approved processes among the 256,056 processes per state (PI, RJ and SP) and developed six probability function estimators for that variable : (1) the distribution of Y for processes approved in Piauí; (2) the distribution of Y for processes not approved in Piauí; (3) the distribution of Y for processes approved in Rio de Janeiro; (4) the distribution of Y for processes not ratified in Rio de Janeiro; (5) the distribution of Y for processes ratified in São Paulo and (6) the distribution of Y for processes not ratified in São Paulo.
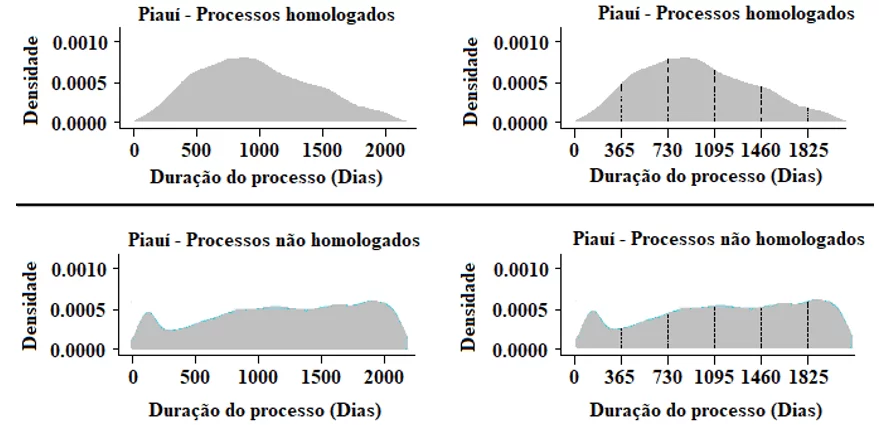
In Figure 21 in CNJ (2019, p. 101) the graphs of the six probability distributions of Y are presented and, in this work, in Figure 1, by way of illustration, the graphs of the probability distribution of Y for homologated and non-homologated processes in the state of Piauí of the five municipalities of Piauí whose duration was investigated are presented.
In Figure 1, the graphs on the left above and below are images from Figure 21 (CNJ, 2019, p.101) and to the right above and below present the density function of variable Y for homologated and non-homologated processes of Piauí respectively, highlighting the areas of duration of one year (0 to 365 days), two years (366 to 730 days), three years (731 to 1095 days), four years (1096 to 1460 days), five years (1461 to 1825 days) and six years or more (1826 onwards). These graphs on the right are highlighting these 365-day intervals, as they were used in the scope of this study.
Figure 1 – Probability distribution graphs of the random variable Y = process duration time (measured in days) for approved and non-homologated processes in the state of Piauí.
Based on the image of these graphs, y probability estimates were performed for time intervals of 365 days. Table 2 shows these estimated values, highlighting once again that they come from the 256,056 processes considered to evaluate the duration of each process.
Table 2 – Probability of duration in years of the 256,056 approved and non-homologated processes of 17 municipalities of Piauí (5), Rio de Janeiro (4) and São Paulo (8)
| Probability of terminating the process | |||||||
| UF | closure
of the process |
1 to
365 days (1 year) |
366 a
730 days (2 years) |
731 a
1095 days (3 years) |
1096 to
1460 days (4 years) |
1461 a
1825 days (5 years) |
≥ 1826
Days (≥ 6 years) |
| PI | Approved | 0,08378 | 0,26254 | 0,30370 | 0,20701 | 0,11349 | 0,02947 |
| PI | Not approved | 0,11031 | 0,12678 | 0,18942 | 0,19666 | 0,21338 | 0,16346 |
| RJ | Approved | 0,26445 | 0,31739 | 0,22030 | 0,12296 | 0,06782 | 0,00707 |
| RJ | Not approved | 0,25121 | 0,21401 | 0,16586 | 0,12153 | 0,11159 | 0,13580 |
| SP | Approved | 0,43516 | 0,32410 | 0,14317 | 0,06840 | 0,02476 | 0,00441 |
| SP | Not approved | 0,19311 | 0,17613 | 0,15813 | 0,16624 | 0,14952 | 0,15687 |
Source: prepared by the authors based on Figure 21 of CNJ (2019, p. 101).
Based on Table 2, you can estimate the probability of closing a given process at one-year time intervals. For example, the estimate of the probability of a process approved in Rio de Janeiro ending in three years (between 731 and 1095 days) is:
P (Y = 3) = 0.22030 = 22.03%. (1)
In statistical jargon, the random variable is Y (duration in process days)and now we are considering this variable measured in years (365-day intervals). Thus, in (1) it is stated, in statistical jargon, that the probability of Y being three years (between 731 and 1095 days) is 22.03%.
Take as another example the probability of an unapproved process in São Paulo ending in four years (between 1096 and 1460 days) would be written in statistical jargon as presented in (2).
P (Y = 4) = 0.16624 = 16.624% ≈ 16.62%. (2)
In other words, according to Table 2, we can say that a first instance process in São Paulo that is not approved has a 16.62% probability of ending in four years (between 1096 and 1460 days). Assuming that on a given day there is the registration of n = 200 new cases of first degree in São Paulo and that they will not be homologated. Thus, of these n = 200 cases, it is expected that 200 * 16.62% = 33.24 cases are resolved only in four years (between 1096 and 1460 days). In statistical jargon it says that “the expected value (hope) for Y = 4 is 33.24 cases” and is written accordingto (3).
E (Y = 4) = 200 * 16.62% = 33.24 cases. (3)
These values from Table 2 are used in the simulation of this work as estimators of the probability of closure at a given time t, of a process approved or not approved in São Paulo, Rio de Janeiro and Piauí.
THE DATA OF CNJ (2021)
The CNJ Database (2021) has several historical series from various legal bodies, including data from the TJPI, TJRJ and TJSP. In order to calculate the indicators of this present work, it is necessary to have data on the number of magistrates and court employees and the aforementioned database has this historical series.
For the purpose of this work, three variables were accessed from the time series from 2013 to 2019 for the TJRJ and TJSP and from the time series from 2016 to 2019 for the TJPI. These periods were chosen because Rio de Janeiro and São Paulo have processes evaluated by CNJ (2019) from 2013 to 2017 and for Piauí the processes evaluated were from 2016 and 2017. The variables used are shown in Table 3.
Table 3 – CNJ historical series variables from 2013 to 2019 (2021) used
| Variable code in the CNJ Database | Variable Description |
| cn1 | New 1st degree cases arising in the year |
| mag | Total available magistrates (in the year) |
| sajud1 | Total servers in the Judicial Area of the 1st Degree in the year |
Source: prepared by the authors based on Figure 21 of CNJ (2019, p. 101).
Based on these three variables collected from 2013 to 2019 and based on the estimated values of probability of time of end of the life cycle of the processes presented in Table 2, the simulations of the dynamics of the process closure time were performed.
SIMULATION OF PROCESS-ENDING TIME DYNAMICS
Tables 1 and 2 show the rate of approved (and not indirectly approved) processes and the probability of closing a case in one, two, three, four, five and six or more years. With these data it is possible to simulate the time dynamics of the processes that were effectively new cases of first degree for the TJPI, TJRJ and TJSP, whose values are available in the CNJ Database (2021).
To evaluate the time dynamics of the closure of cases, only the actual data of new cases from 2013 to 2109 for the TJRJ and TJSP and only the new cases of 2016 and 2017 of the TJPI were considered. Therefore, the processes initiated before 2013 for the TJRJ and TJSP were not computed or the processes initiated before 2016 for the TJPI.
Thus, the records of new first-degree cases occurred in the years 2013 to 2019 in the TJRJ and TJSP and the cases that occurred from 2016 to 2019 in the TJPI were accessed. Then, the estimate of each ‘batch’ of new cases in the year was calculated, the percentage that had ‘approved’ closure (made through mediation/conciliation) and ‘non-approved’ closure based on the approval percentages shown in Table 1. Then, the duration time of each process approved and not approved was estimated, based on Table 2, for each process. Finally, the estimate of cases in progress for the year in question was calculated for each year. For better understanding, the procedure performed for the TJSP data is presented below. This procedure was the same as for the TJRJ and TJPI.
Initially, to exemplify, let us take the result of the number of new first-degree cases in 2013 of the TJSP. This data comes from the variable cn1 mentioned in Table 3. According to CNJ (2021) were N = 4,188,012 new first-degree cases in 2013. Based on Table 1, in São Paulo it is estimated that 8.02% of the cases are solved with ‘homologated’ status and the other cases are resolved with status ‘not approved’. Thus, considering this rate, it is expected that of the 4,188,012 cases, H = 4,188,012 * 8.02% = 335,878.56 is expected ≈ 335,879 approved cases and NH = N – H = 4,188,012 – 335,879 = 3,852,133 cases not approved. Table 4 presents estimates for approved cases (H) and non-homologated (NH) of new first-degree cases registered in the TJSP from 2013 to 2019.
Table 4 – New cases of the first degree of the years 2013 to 2019 of the TJSP and expected values of cases approved and not approved thereof
| (A) | (B) | (C) | |
| Year | New 1st degree cases (N)
(cn1) |
Approved processes (H) (Expected value: 8.02%) |
not homologated (NH)
(Expected value: 91.98%) |
| 2013 | 4.188.012 | 335.879 | 3.852.133 |
| 2014 | 4.180.691 | 335.291 | 3.845.400 |
| 2015 | 3.204.471 | 256.999 | 2.947.472 |
| 2016 | 3.624.887 | 290.716 | 3.334.171 |
| 2017 | 4.005.941 | 321.276 | 3.684.665 |
| 2018 | 3.843.648 | 308.261 | 3.535.387 |
| 2019 | 3.925.116 | 314.794 | 3.610.322 |
Note.: (A) Data obtained from CNJ (2021) (B) Proportion of cases approved in the TJSP: 8.02% (See Table 1) (C) Proportion of processes not approved in the TJSP: 91.98% (See Table 1) Source: prepared by the authors.
Next, it is desired to estimate, for each of the new cases of each year, how long it will end. To perform this estimate, Table 2 was used, where a process closure estimate is estimated in one, two, three, four, five and six or more years. For example, consider the N = 4,188,012 new first-degree cases that entered the TJSP in 2013. Of these cases, 335,879 are expected to be approved and the other 3,852,133 are not approved.
Thus, the number of cases approved in São Paulo with closure in one year (between 1 and 365 days) could be estimated, simply by multiplying the H = 335,879 new (expected) cases approved by the probability of closure in a year which, as it can be seen in Table 2, it is worth 0.43516 ≈ 43.52%. Thus, of the 335,879 cases expected to be resolved by approval, it is expected that 335,879 * 43.52% = 146,174.54 ≈ 146,175 cases will be closed in one year. And so it is done for the other values of new cases.
However, in this work, we chose to carry out a draw to simulate the closing time of each approved and non-approved process based on the probability values presented in Table 2. The statistical software R (2019) was used to carry out the drawings, using if the sample function of that software. In Figure 2, by way of illustration, the code in language R used for the sampling of N = 4,188,012 new cases of first degree in São Paulo in 2013 is presented, ending in one year, two years and so on until six or more years.
Figure 2 – Code in R for sampling N = 4,188,012 new cases of first degree in São Paulo in 2013 ending in one year, two years and so on for up to six or more years.
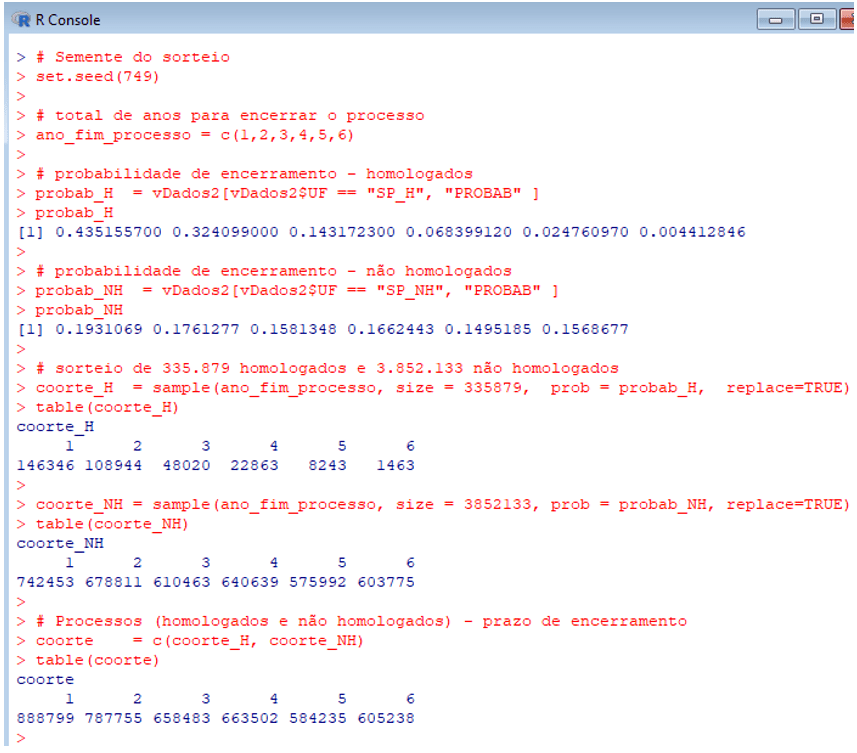
As shown in Figure 2, the program variables in R coorte_H and coorte_NH summarize the distribution of the end of N = 4,188,012 processes. For example, 22,863 of the 335,879 (expected) processes approved in São Paulo are expected to be closed in four years (see the value in the variable coorte_H of the R code). And it is expected, for example, that 603,775 of the 3,852,133 unapproved cases will end in six or more years (see the value in the variable coorte_NH of the R code). For best illustration, table 5 shows these values generated by lot in the R software environment.
Table 5 – Distribution of N = 4,188,012 new first-degree cases in São Paulo in 2013 by the expected values of approved and non-homologated processes with expected closure values in one, two, three, four, five or six or more years
| Process | 1 to
365 days (1 year) |
366 to
730 days (2 years) |
731 to
1095 days (3 years) |
1096 to
1460 days (4 years) |
1461 to
1825 days (5 years) |
≥ 1826
Days (≥ 6 years) |
Total |
| SP – H | 146.346 | 108.944 | 48.020 | 22.863 | 8.243 | 1.463 | 335.879 |
| SP – NH | 742.453 | 678.811 | 610.463 | 640.639 | 575.992 | 603.775 | 3.852.133 |
| SP -Total | 888.799 | 787.755 | 658.483 | 663.502 | 584.235 | 605.238 | 4.188.012 |
Source: prepared by the authors.
From Table 5 we have that of the N = 4,188,012 new cases from 2013, 888,799 (approved and non-approved) will close in the first year of the process (in 2013). Then, in the second year, 787,755 processes will be closed (in 2014). And so on. It is highlighted once again that these are expected values obtained based on the probability distribution of the random variable Y (time of process duration) obtained from the work of CNJ (2019). This drawing procedure via code R was performed for all new cases (cn1) from 2013 to 2019 for the TJRJ and TJSP processes and new cases (cn1) from 2016 to 2019 for the TJPI processes.
To exemplify, table 6 presents the expected total of closed cases (homologated or not) in one, two, three, four, five and six or more years for new first-degree cases from 2013 to 2019 of the TJSP.
Table 6 – Expected total of closed cases (homologated or not) in one, two, three, four, five and six or more years for the new first-degree cases of the years 2013 to 2019 of the TJSP.
| Expected value of closed cases (approved or not) | |||||||
| Year | New cases
1st degree (cn1) |
1 to
365 days (1 year) |
366 to
730 days (2 years) |
731 to
1095 days (3 years) |
1096 to
1460 days (4 years) |
1461 to
1825 days (5 years) |
≥ 1826
Days (≥ 6 years) |
| 2013 | 4.188.012 | 888.799 | 787.755 | 658.483 | 663.502 | 584.235 | 605.238 |
| 2014 | 4.180.691 | 887.301 | 786.319 | 657.365 | 662.372 | 583.172 | 604.162 |
| 2015 | 3.204.471 | 680.326 | 602.709 | 503.557 | 507.519 | 447.275 | 463.085 |
| 2016 | 3.624.887 | 769.372 | 681.589 | 569.707 | 574.151 | 506.017 | 524.051 |
| 2017 | 4.005.941 | 850.145 | 753.420 | 629.885 | 634.495 | 559.051 | 578.945 |
| 2018 | 3.843.648 | 815.810 | 722.595 | 604.450 | 608.702 | 536.519 | 555.572 |
| 2019 | 3.925.116 | 832.942 | 737.991 | 617.214 | 621.685 | 547.975 | 567.309 |
Source: prepared by the authors.
With the expected closing time values of approved and unapproved cases (in years) it is possible to verify the total of cases in progress over the years and thus estimate the other three indicators of interest in this work: (1) the index of cases per magistrate, (2) the index of cases per server and (3) the annual rate of closure of cases.
However, there is no information on the start date and end date of the processes in the CNJ database. We only know the year in which the new cases (cn1) started. Thus, to facilitate the understanding of the simulation of the dynamics of the closing time of processes and later calculate the indicators of interest, it was considered that all new cases of first degree registered occurred on the first day of the year, that is, January 1st. This is why the interval of 365 days (one year) was chosen to estimate the probability of closing the process. Thus, if a process started in 2013 and is expected to close for one year, this year is the year 2013, regardless of the day/month it was started, as it is considered to have started on 01/01/2013.
Lexis diagrams were constructed to visualize this process closure time dynamics for tjpi, TJRJ and TJSP data. For illustration, the Lexis diagram for the TJSP data is presented in Figure 3.
Figure 3 – Lexis diagram of the closing dynamics of TJSP first instance processes that began between 2013 and 2019.
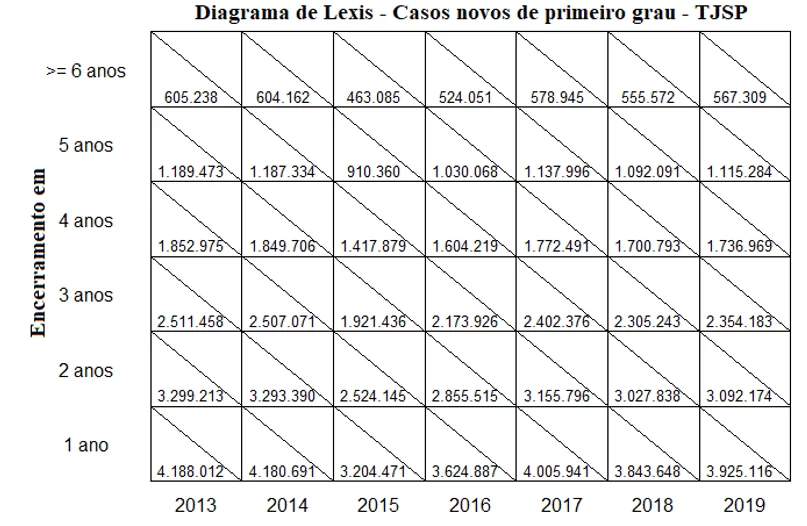
In the Lexis diagram, the number of ‘active’ processes in a given year is arranged in the diagonal columns on the left based on the year in question. To exemplify the construction and reading of the Lexis diagram be as follows: In 2013, N = 4,188,012 new cases were recorded that began, by convention, on 01/01/2013. According to Table 6, 888,799 cases (approved and non-homologated) of these 4,188,012 will be closed in one year, that is, in the same year that began in 2013. But the judicial machine was triggered for all 4,188,012 cases. Thus, in the Lexis diagram in column 2013 and line 1 year is recorded the value of processes worked by the Court, i.e., 4,188,012.
But, for the second year (in 2014), from these 4,188,012 processes, we must subtract 888,799 that were resolved in 2013. Thus, in 2014 there remain 4,188,012 – 888,799 = 3,299,213 processes from the 2013 ‘batch’. recorded in column 2013 row 2 years of the Lexis diagram. From Table 6, it can be seen that the expected value of processes from the 2013 batch to be closed with two years is 787,755. Thus, of the 3,299,213 processes of the 2013 batch in progress in the second year (in 2014), 787,755 will be closed. Hence, 3,299,213 – 787,755 = 2,511,458 processes from the ‘2013 batch’ will follow in the third year (in 2015). This value of 2,511,458 is recorded in column 2013 row 3 years.
Thus, the Lexis diagram is filled in for each column referring to a given year. Table 6 has all the values needed to complete this diagram. One more example: to fill in the values of the ‘2018 batch’, it is noted in Table 6 that in 2018 3,843,648 new cases occurred. This value is recorded in column 2018 row 1 year. Already in that same year 815,810 were closed. Thus, for the second year of the ‘2018 batch’ (in 2019) there are 3,843,648 – 815,810 = 3,027,838 processes left and this is registered in the 2018 column, line 2 years. And of these 3,027,838 processes that are ‘two years old’, 722,595 will close in this second year. This will leave 3,027,838 – 722,595 = 2,305,243 processes from the ‘2018 batch’ that will go on to its third year (in 2020). This record is in column 2018 row 3 years.
After completing the columns year by year it is then possible to check the number of processes in the process of a given year that, as said, are arranged in the diagonal columns on the left based on the year in question. For the year 2013 there is a total of 4,188,012 cases that occupied in some instance the judicial machine. In 2014, 4,180,691 new cases were entered, as observed in Table 6. But additionally, there is still the remainder of 3,299,213 ‘lot 2013’ cases. Then diagonally to the left of 2014 in the Lexis diagram we have recorded 4,180,691 (column 2014 row 1 year) + 3,299,213 (column 2013 row 2 years) = 7,479,904 cases (first degree) being processed in the TJSP in 2014.
In 2018, for example, we have 12,383,821 1st degree cases that occupy the judiciary in some way, distributed as follows: 3,843,648 new cases from 2018 (column 2018, row 1 year) + 3,155,796 cases from 2 years of 2017 (column 2017 line 2 years) + 2,173,926 processes of 3 years of 2016 (column 2016 line 3 years) + 1,417,879 processes of 4 years of 2015 (column 2015 line 4 years) + 1,187,334 processes of 5 years of 2014 ( column 2014 row 5 years) + 605,238 processes of 6 years (or more) from 2013 (column 2013 row >= 6 years).
In this way, a reasonable estimate of the volume of processes is obtained each year and from there it is possible to calculate the indicators used in this work, resulting from the simulation.
INDICATORS – INDEX OF CASES BY MAGISTRATE AND BY SERVERS PER YEAR
Since one has an estimate of the volume of cases being processed over the years and the (actual) data of the variables mag and sajud1 are obtained (see Table 3), it is simple to calculate the index of first-degree cases by magistrates and/or by servants over the years. For example, according to the CNJ database (2021), in 2013 the TJSP had 2,501 magistrates and in 2014 there were 2,566 active magistrates, not only for first-degree cases, but for other instances.
Still, a reasonable statistic that helps measure the efficiency of justice would be the value of the reason for prosecutions per magistrate. So in São Paulo in 2013 we would have an index of 4,188,012 / 2,501 = 1,674.74 cases/magistrate and in 2014 this index is (3.3 299,213 + 4,180,691) / 2,566 = 7,479,904 / 2,566 = 2,915.01 cases/magistrate. A 74% increase in the burden of magistrates’ proceedings from 2013 to 2014. And it is worth noting again that we consider only the distribution of first-degree cases by all magistrates and, in this calculation, the cases prior to 2013 are not computed, which would certainly increase this rate.
The reasons for magistrate and server were calculated for the years 2013 to 2019 for the TJRJ and TJSP. For the TJPI, for the years 2016 to 2019. To exemplify, table 7 presents the values of the indices for magistrates and servers for the TJSP data.
Table 7 – Number of cases by magistrate and by civil servants of the batches of new cases of first degree (cn1) from 2013 to 2019 in the TJSP
| Year | Total of processes in progress | Total magistrates
(mag) |
Index processes by magistrate | Total servers
(1st degree) (sejud1) |
Index processes by server | ||
| 2013 | 4.188.012 | 2.501 | 1674,53 | 39.411 | 106,27 | ||
| 2014 | 7.479.904 | 2.566 | 2915,01 | 41.173 | 181,67 | ||
| 2015 | 9.009.319 | 2.335 | 3858,38 | 35.335 | 254,97 | ||
| 2016 | 10.509.078 | 2.397 | 4384,26 | 35.973 | 292,14 | ||
| 2017 | 11.822.071 | 2.519 | 4693,16 | 35.004 | 337,73 | ||
| 2018 | 12.383.821 | 2.581 | 4798,07 | 35.005 | 353,77 | ||
| 2019 | 12.474.071 | 2.503 | 4983,65 | 34.060 | 366,24 |
Source: prepared by the authors.
INDICATOR – RATE OF CLOSED PROCESSES IN THE YEAR
Another indicator that can signal the efficiency of mediation/conciliation is the rate of closed cases (E) in the year in relation to all cases being processed in the year (T). It is the result of the E/T division that can range from zero to one. The closer to the unit, this signals that more processes were terminated in the year. If the fee is the unit, it means that all the proceedings being processed in the year were closed in the same year.
To exemplify, Table 8 presents the values of the rates of lawsuits closed in the years 2013 to 2019 resulting from the simulation of closure of the TJSP processes.
Table 8 – Closing rate of proceedings in the year – TJSP
| Year | Closed Cases
(E) |
Proceedings in progress
(T) |
Closing rate
(E/T) |
| 2013 | 888.799 | 4.188.012 | 0,2122 |
| 2014 | 1.675.056 | 7.479.904 | 0,2239 |
| 2015 | 2.125.128 | 9.009.319 | 0,2359 |
| 2016 | 2.692.948 | 10.509.078 | 0,2562 |
| 2017 | 3.281.898 | 11.822.071 | 0,2776 |
| 2018 | 3.834.866 | 12.383.821 | 0,3097 |
| 2019 | 3.811.010 | 12.474.071 | 0,3055 |
Note: closed processes (E) are expected closing values (see Table 6) Source: prepared by the authors.
EFFICIENCY VIA MEDIATION/CONCILIATION
The procedures performed with the data of the TJSP, TJRJ and TJPI and that were exemplified above with the tjsp data to obtain indicators of measurement of the efficiency of mediation/conciliation are based on the estimation of the percentage of approved processes (with some solution via mediation/conciliation) of 8.02%, 1.27% and 2.07% for the first instance processes of the TJSP, TJRJ and TJPI respectively.
The objective of this work is to investigate whether mediation/conciliation can provide greater speed to the processes, contributing with greater efficiency of the judiciary. Assuming that at the control of the TJSP, TJRJ and TJPI efforts are made to increase the resolution of conflicts through mediation/conciliation, simulation was performed with data from 2013 to 2019 of the CNJ assuming that the three courts achieved a rate of 25% mediation/conciliation and then another simulation was performed with a rate of 50%. For this procedure, the probability of resolution of the approved processes was maintained as described in Table 2.
The results of these simulations for the data of the three courts are presented in Figures 4 to 9 below.
Figure 4 – Simulations of the values of indicators (a) processes/magistrate/year and (b) processes/servers/year the TJSP data.
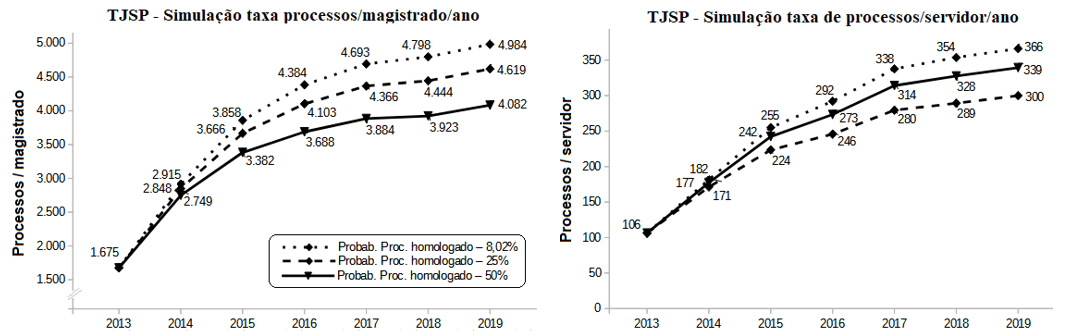
For the index of cases/magistrate with the data of the TJSP, figure 4 shows an expected value of 1,675 cases/magistrate in 2013. In 2015 considering the approval rate of 8.02% would be expected an index of 3,858 cases/magistrate (considering the legacy of remaining cases of 2013, 2014 and the new ones in 2015). By simulation, if the approval rate was 25%, this rate would fall to 3,666 cases/magistrate. This represents 3,858 – 3,666 = 192 fewer cases per magistrate representing 192 / 3,858 = 4.98% less cases for each magistrate in the period of two years (2013 to 2015). And by simulation, if the approval rate was 50%, this rate would fall to 3,382 cases/magistrate. This represents 3,858 – 3,382 = 476 fewer cases per magistrate, i.e. 476 / 3,858 = 12.34% less cases for each magistrate in the period of two years (2013 to 2015).
It should be taken into account that the rate of cases/magistrate depends on the number of new cases and the number of magistrates allocated to the Court. If in a given year the number of cases is much higher than the new cases of previous years and the number of magistrates is maintained or even reduced, the rate of cases/magistrate of course will increase. But these situations are independent of the mediation/conciliation process.
Anyway, according to Figure 4, assuming that in the period 2013 to 2019 the proportion of approved processes was 25% (probably a target more easily achieved compared to the proportion of 50%) in 2019 a load of 4,619 cases/magistrate would be expected, while if the proportion of approved cases were the current estimated 8.02%, in 2019 a load of 4,984 cases/magistrate would be expected. This means that the rate of approved cases of 25% would result in a reduction of 4,984 – 4,619 = 365 cases, i.e. 365 / 4,984 = 7.32% of fewer cases for each magistrate. Similarly, the load of processes per server in 2019 would present a reduction of 366 – 300 = 66 processes, i.e. 66 / 366 = 18.03% fewer processes for each server.
This would certainly contribute to improving the quality of the work of the magistrate and the servant, contributing to the general improvement of the functioning of the judicial system, that is, improving the efficiency of the work of justice.
Figure 5 – Simulations of the values of indicators (a) processes/magistrate/year and (b) processes/servers/year the data of the TJRJ.
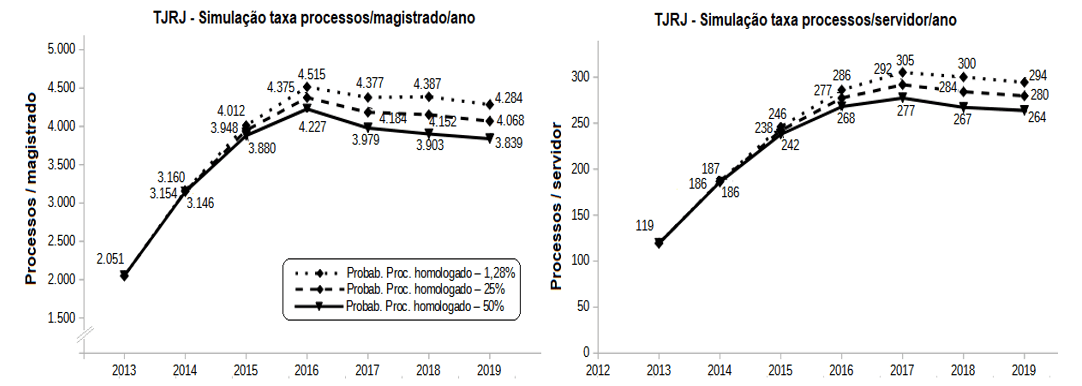
For the index of cases/magistrate with the data of the TJRJ, figure 5 shows an expected value of 2,051 cases/magistrate in 2013. In 2016 considering the approval rate of 1.28% (estimated value for Rio de Janeiro – see Table 1) an index of 4,515 cases/magistrate would be expected (considering the legacy of remaining processes of 2013, 2014, 2015 and the new ones for 2016). By simulation, if the approval rate was 25%, this rate would fall to 4,375 cases/magistrate. This represents 4,515 – 4,375 = 140 fewer cases per magistrate representing 140 / 4,515 = 3.10% less cases for each magistrate over a period of three years (2013 to 2016). And by simulation, if the approval rate was 50%, this rate would fall to 4,227 cases/magistrate. This represents 4,515 – 4,227 = 288 fewer cases per magistrate, i.e. 288 / 4,515 = 6.38% less cases for each magistrate in the three-year period (2013 to 2016).
Assuming that in the period from 2013 to 2019 the proportion of approved processes was 25% (probably a more easily achieved target compared to the proportion of 50%) in 2019 a load of 4,068 cases/magistrate would be expected, while if the proportion of approved cases were the current estimated 1.28%, in 2019 a load of 4,284 cases/magistrate would be expected. This means that the rate of approved cases of 25% would result in a reduction of 4,284 – 4,068 = 216 cases, i.e. 216 / 4,284 = 5.04% of fewer cases for each magistrate. Similarly, the load of processes per server in 2019 would present a reduction of 294 – 280 = 14 processes, i.e. 14 / 294 = 4.76% fewer processes for each server.
Figure 6 – Simulations of the values of indicators (a) processes/magistrate/year and (b) processes/servers/year the data of the TJPI.
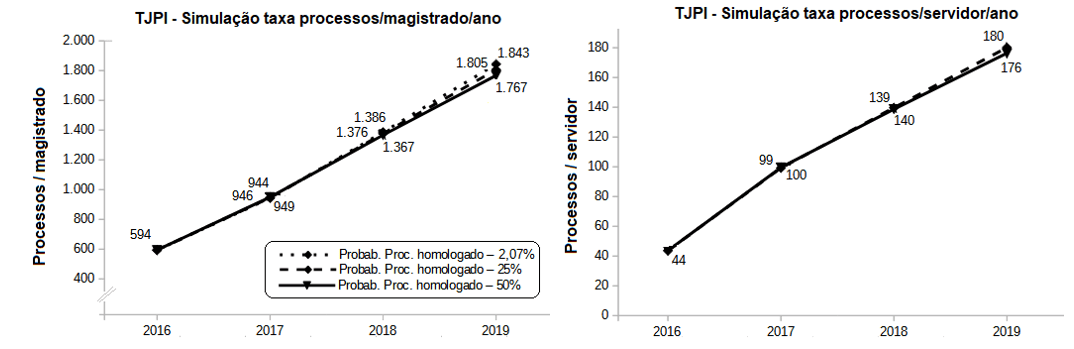
The results of the simulation for the Piauí data are shown in Figure 6 and what is verified is that with the approval process in the proportion of 25% a reduction of 18 years (2016 to 2019) is obtained 43 – 1805 = 38 cases/magistrate which corresponds to a reduction of 38 / 1805 = 2.06% less cases for each magistrate in the period of three years (2016 to 2019).Similar reduction is obtained for servers, because in 2019 we would have 180 – 176 = 4 fewer processes for each server which represents 4 / 180 = 2.22% less workload.
Figure 7 – Simulations of the values of the closing rates of the processes in the year for the TJSP.
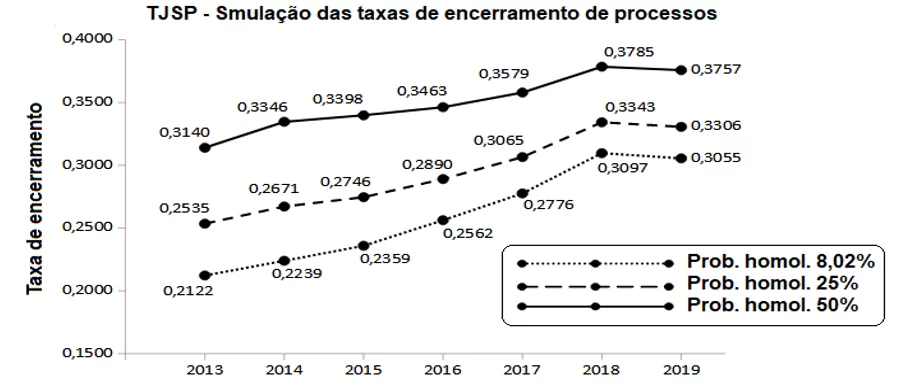
In Figure 7, for the TJSP, considering the proportion of 25% for approved processes, an annual closure rate is expected on average 3% higher when compared to the current approval rate (8.02% of the data sample). In 2019, for example, the closure rate is 33.06% for the 25% approval rate while this same rate is 30.55% if the approval ratio is 8.02%. This means that in 2019, in a batch of 100 cases, 33.06 would be expected to be terminated with the approval ratio of 25%. But if the approval ratio was 8.02% it would be expected to close 30.55 cases, approximately three fewer processes therefore.
Figure 8 – Simulations of the values of the closing rates of the processes in the year for the TJRJ.
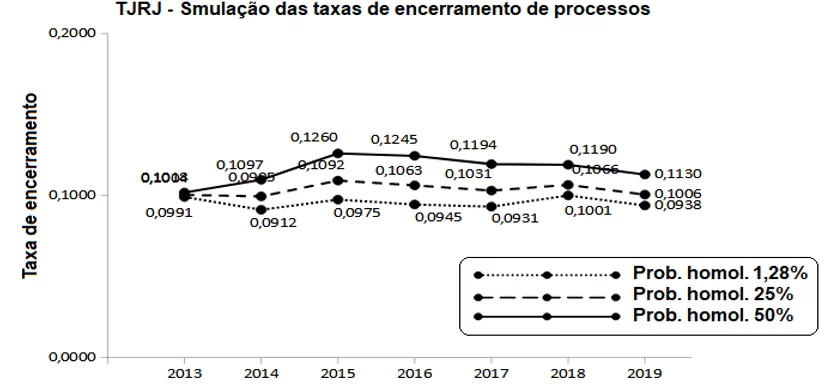
For the TJRJ data, it can be said that the closure rate basically remains unchanged, maintaining the difference of a process, if the approval ratio is 25%.
Figure 9 – Simulations of the values of the closing rates of the proceedings in the year for the TJPI.
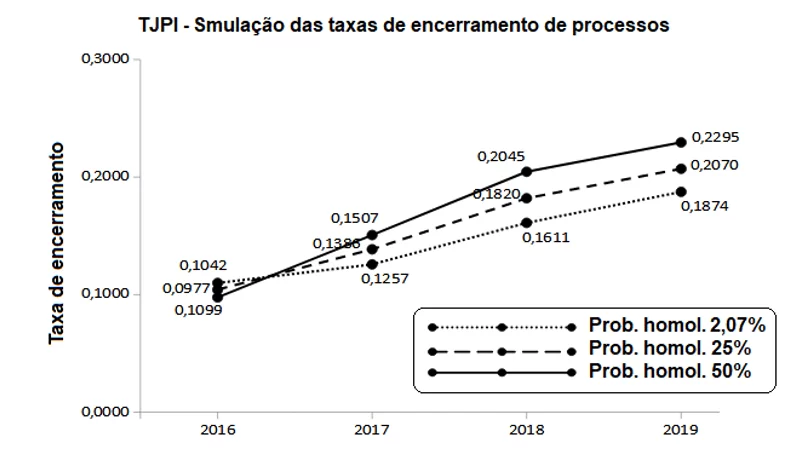
For the TJPI data, it is observed that after three years (2016 to 2019) the closure rate is approximately 2% higher, comparing a homologation ratio of 25% with the estimated proportion of 2.07% (sample data). In 2019, of each batch of 100 cases, it would be expected the closure of 20.70 cases against the expected value of 18.74 cases with approval rate at 2.07%.
RESULTS AND DISCUSSION
The fundamental data for the results of this study consist of the probability values of the process closure time (approved and not approved) that are presented in Table 2. It is noteworthy that the data in this table come from a sample of 256,056 processes from 17 municipalities, five piauienses, eight paulistas and four from Rio de Janeiro as previously commented.
Suppose that a closure time of a case of up to two years is considered appropriate, that is, it is efficient in terms of the action of the Justice for conflict resolution. Then, based on Table 2, the approved processes in São Paulo are likely to end in up to two years of 0.43516 + 0.32410 = 0.75926 ≈ 75.93%. For non-approved cases, this probability is worth 0.19311 + 0.17613 = 0.36924 ≈ 36.92%. This means that mediation/conciliation presents a greater chance of conflict resolution in two or fewer years when compared to the significant reduction of the life of the process within the judicial sphere.
In other words, data from the sample of cases under the TJSP indicated that out of every 100 new cases of 1st degree that were approved, 76 were closed within two years, while out of every 100 new cases not approved, only 37 were closed in this same period, which evidences the efficiency of mediation/conciliation as less time provides less distribution of case load by magistrates and servers and consequently an increase in the quality of case evaluation by them, and also some degree of cost reduction in general for the judiciary.
For the interpretation of the data of the three courts, table 9 presents the probabilities, chances of closure and root of approved cases and processes not approved within two years based on the estimates of probability of closure presented in Table 2.
Table 9 – Probability, chance (odds) and odds ratio (odds ratio) of approved and non-approved processes within two years
| (THE) Probability close process |
(B) Chance Closing Up to 2 years X More than 2 years |
(Ç) Odds Ratio Closing Homologated X Not approved in up to two years |
|||||
| UF | Closing the process | (A1)
until 2 years old |
(A2)
More than 2 years |
(A1/A2) | |||
| PI | Approved | 0,34632 | 0,65368 | 0,5298 | |||
| PI | Not approved | 0,23709 | 0,76291 | 0,3108 | 1,7046 | ||
| RJ | Approved | 0,58184 | 0,41816 | 1,3914 | |||
| RJ | Not approved | 0,46522 | 0,53478 | 0,8699 | 1,5995 | ||
| SP | Approved | 0,75926 | 0,24074 | 3,1539 | |||
| SP | Not approved | 0,36924 | 0,63076 | 0,6330 | 4,9825 | ||
Source: prepared by the authors.
There is a conceptual difference between probability and chance (in English, chance translates to odds). The chance is the result of dividing the probability of occurrence of a certain event of interest E (in our case E represents the event process closed within 2 years) by the probability of non-occurrence of this event E. In Table 9, in column (A) these values are found.
For example, in Piauí, the chance (odds) of an approved process being resolved in up to two years compared to its resolution in more than two years is 0.34632 / 0.65368 = 0.5298. As the chance is less than one unit, it is better to ‘read’ the inverse: 1 / 0.5298 = 1.8875 which means that ‘in Piauí, the chance of an approved process ending in more than two years is 1 .8875 times greater than the chance of this project to finish in up to two years’. And we can also say that ‘in Piauí, the chance of an approved process finishing in more than two years is 88.75% greater than the chance of this project finishing in up to two years’.
Another example: In São Paulo, the chance (odds) of an approved process being resolved in up to two years compared to its resolution in more than two years is 0.75926 / 0.24074 = 3.1539. We can then say that ‘in São Paulo, the chance of an approved process finishing within two years is 3.1539 times greater than the chance of this project finishing in more than two years’.
If we consider that the data sample is, in fact representative, then the data indicate that in Piauí the processes are more ‘time consuming’ (more than two years for resolution), are homologated or not (note that in Piauí the chance of an unhomologated process ending after two years is 1 / 0.3108 = 3.2175 times greater than being closed in up to two years). For the state of São Paulo, an approved process signals great chances of closure in up to two years, which in turn provides better efficiency of justice in general.
Finally, we can assess the (odds ratio) of approved processes in relation to non-approved processes ending within two years. The odds ratio is the result of the division (reason) of chances (odds) of closing in up to 2 years of approved processes and non-approved processes. As seen in column (C) of Table 9, in Piauí the odds ratio of approved projects ending within two years is 0.5298 / 0.3108 = 1.7046 times higher compared to non-approved processes, that is, they are 70.46% more likely to finish in two years.
We see that in São Paulo, the ratio of chance is almost five times higher in favor of the approved processes (4.9825). If the data of the sample used are really representative of the evaluated states, then São Paulo showed that homologated processes are three times more likely to be resolved in up to two years than they are resolved in more than two years. And this, by the simulations performed indicate a reasonable degree of efficiency, here in this work reflected in the reduction of the burden of cases by magistrate and by server and even a slight reduction in the closure rate over time.
In Rio de Janeiro, the simulation also showed a reasonable efficiency gain, because an approved process has 1.3914 times more or 39.14% more chances of being solved in up to two years compared to the chances of being solved in more than two years. In addition, a process approved in Rio de Janeiro presented, by simulation 1.5995 times or 59.95% more chances of ending in up to two years compared to an unapproved process.
And finally, the data from Piauí showed that the trend is the processes take more than two years to finalize whether approved processes or not. Even so, if they are approved, in relation to non-homologated patients, they had a higher chance of closure in up to two years (70.46%).
CONCLUSIONS AND RECOMMENDATIONS
In this work, the simulation with real data worked with estimates of also real data could signal, although simply, scenarios for the work of justice encompassing mediation/conciliation procedures. Obtaining more efficiency of justice measured in a simple way through the temporal dynamics of the burden of proceedings by magistrate, by server, by the rate of closure and by the speed of the life cycle of the proceedings seems to signal in favor of these procedures.
However, to improve the simulation process it may be necessary to carry out a more robust and comprehensive probabilistic sampling plan. For example, to improve simulation, it would be interesting to get more data from the lifecycle of each process (exact start and end date, eventual obstacles, etc.). and other data such as process costs, procedures between sectors triggered, etc. The sample used in this work was undeniably relevant and easily accessible. However, perhaps the representativeness of this sample to the scope of the Courts may not be ideal and hence the warning to carry out future work with robust sampling planning.
Finally, data from Piauí showed that the trend is for processes to take more than two years to complete, whether processes are approved or not. Even so, if they are ratified, in relation to those not ratified, they had a greater chance of closure within two years (70.46%).
REFERENCES
ALVIM, José Eduardo Carreira. Justiça: acesso e descesso. Rio de Janeiro: EMASRF, 2003. Disponível em: Justiça: acesso e descesso – Jus.com.br | Jus Navigandi. Acesso em: 4 de jun. 2021.
BRASIL. Lei Nº 13.105, de 16 de março de 2015. Código de Processo Civil. 2015b. Disponível em: http://www.planalto.gov.br/ccivil_03/_Ato2015-2018/2015/Lei/L13105.htm. Acesso em: 10 mar. 2021.
BRASIL. Lei Nº 13.140, de 26 de junho de 2015. Dispõe sobre a mediação entre particulares como meio de solução de controvérsias e sobre à autocomposição de conflitos no âmbito da administração pública; altera a Lei no 9.469, de 10 de julho de 1997, e o Decreto no 70.235, de 6 de março de 1972; e revoga o § 2o do art. 6o da Lei no 9.469, de 10 de julho de 1997. 2015c. Disponível em: http://www.planalto.gov.br/ccivil_03/_ato2015-2018/2015/lei/l13140.htm. Acesso em: 10 mar. 2019.
CONSELHO NACIONAL DE JUSTIÇA. Justiça em Números 2020. Brasília: CNJ. Disponível em: WEB-V3-Justiça-em-Números-2020-atualizado-em-25-08-2020.pdf (cnj.jus.br). Acesso em: 4 de jan. 2021.
R CORE TEAM (2019). R: A language and environment for statistical computing. R Foundation for Statistical Computing, Vienna, Austria. URL https://www.R-project.org/.
RUTCKEVISKI, João Carlos. A democratização do acesso à justiça: uma abordagem sobre a aproximação do judiciário da realidade social. Monografia apresentada como requisito parcial à conclusão do Curso de bacharelado em Direito na Universidade Federal do Paraná, Curitiba, 2002. Disponível em: A democratização do acesso à justiça : uma abordagem sobre a aproximação do judiciário da realidade social (ufpr.br). Acesso em: 04 de jun. 2021.
[1] Master’s student in Law – Alternative solutions for business disputes at São Paulo School of Law – EPD, Postgraduate in Appropriate Methods in Conflict Resolution at Brazilian Institute of Public Law – IDP, Graduated in Law at Brasília University Center – UniCEUB.
[2] PhD in Geography from UnB.
[3] Advisor. Doctorate in Law.
Submitted: June, 2021.
Approved: June, 2021.