ORIGINAL ARTICLE
MENDONÇA, Alisson Emanuel Goes de [1], SILVA, Francisco José da Silva e [2], COUTINHO, Luciano Reis[3]
MENDONÇA, Alisson Emanuel Goes de. SILVA, Francisco José da Silva e. COUTINHO, Luciano Reis. Learning Model for Analytical Prediction of Tax Revenues from Tax Invoice Information. Revista Científica Multidisciplinar Núcleo do Conhecimento. Year 09, Ed. 07, Vol. 01, pp. 05-26. July 2024. ISSN: 2448-0959, Acess link: https://www.nucleodoconhecimento.com.br/computer-engineering/learning-model, DOI: 10.32749/nucleodoconhecimento.com.br/computer-engineering/learning-model
ABSTRACT
In Brazil, the tax on goods and services, known by the acronym ICMS, holds significant prominence in the revenue of the federative units, approximately 90%. Its value depends on economic activity, whose tax information the taxpayers record in electronic invoices issued to the tax agencies. This paper proposes a learning architecture to predict ICMS revenue through a dataset derived from tax information. The learning architecture uses a segmented approach that starts with splitting the training and validation datasets according to a given parameter. After that, the architecture fits several machine learning models for each split subset (segment). Finally, the architecture chooses the fit machine learning model (learning instance) that produces the best prediction result for each segment. These learning instances compose a hybrid instance set to predict the records of a test dataset. The proposed architecture reduced the error compared to the traditional non-segmented approaches tested (by 18.40%) and to the current methodology of the tax agency that supported this research (by 51.90%). The low prediction error suggests that the model holds promise in estimating revenue.
Keywords: Tax revenue forecasting, Machine learning, Segmented learning, Tax collection, ICMS.
1. INTRODUCTION
In Brazil, public administrations at all levels of government must adhere to principles and rules that define limits and formalities for creating the public budget. In essence, this plan is formulated through revenue forecasts and based on these forecasts, the determination of expenses. In terms of revenue representation among the federative units (UF) in Brazil, the primary source is the tax on goods and services, known as ICMS. In some federative units, such as in the case of Maranhão (MA), this tax accounts for approximately 90% of the monthly revenue.
Although there are rules for estimating revenue, this process occurs before economic operations unfold. Considering that unpredictable events can strongly impact the economy, as was the case during the COVID-19 crisis, revising the estimated revenue information will provide a more accurate basis for public managers to execute expenditures, especially after the completion of economic operations in each monthly period. For this purpose, the tax department adopts its statistical model to reassess the monthly revenue estimate, considering the operations conducted in the previous month.
In this context, this research provides an architecture model for estimating revenue based on the tax information of taxpayers, named the Hybrid Instance Set (). The model’s architecture aims to address the peculiarities of the tax system and the diverse economic realities of taxpayers. Furthermore, it seeks to improve predictive accuracy compared to the non-segmented approach of machine learning models and the model currently used by the Secretary for Finance of Maranhão (SEFAZ-MA). This improvement is based on two hypotheses. The first hypothesis involves splitting the training and validation dataset into clusters (segments) of tax information generated by taxpayers that meet specific similarity criteria. Based on this, the hypothesis is that training a learning model in each segment will result in more accurate predictions. The second hypothesis suggests that applying different learning models for the same segment and selecting the learning model that achieves the best predictive result can enable better adaptation to segment peculiarities and improve the final estimation accuracy. Additionally, these two hypotheses were tested in scenarios to identify the influence of the temporal extension of the training dataset and the influence of the temporal proximity of the training and validation dataset to the prediction moment.
As an improvement to current approaches in the literature, the architecture model aims not only for a low deviation between the total estimated and total paid but also to achieve this low deviation for each taxpayer in each assessment period. Therefore, this learning architecture supports the analytical view of the information resulting from the prediction. The predicted results for year 2021 generated by the proposed model improves the estimate by reducing the deviation model by 18.40% compared to the non-segmented learning approach and by 51.90% compared to that of the current SEFAZ-MA model.
The remainder of the article is organized follows. Section 2 reports on related works. Section 3 describes the Hybrid Instance Set methodology. Section 4 provides details on the experiments, results, and respective analyses. Section 5 presents the conclusion and suggestions for future research.
2. RELATED WORKS
There are already studies evaluating several models and aspects that contribute to improving the predictive accuracy of tax revenue, which is the focus of this research. To systematize the analysis of the studies identified, we divided them into three groups based on the characteristics and limitations of the predictive data used in the learning phase: those that use revenue time series, whether just the gross revenue values or values stratified into different types of revenue; those that combine economic indicators like the gross domestic product, inflation rate, credit rating, consumer price index, and others; and those that use tax information from some kind of tax document issued by the taxpayer. This classification is summarized in the Predictive Data column of Table 1. Additionally, this table reports the learning models used in each study (Base Models) and the ability to provide a detailed analytical view of the estimated revenue for each taxpayer in each monthly period (in Support Analytical View).
Table 1 – Summary comparison of articles

Compared to the related work, our research supports an analytical view due to the granularity of the prediction, given that the estimate of tax revenue occurs for each taxpayer and each monthly period. Additionally, this research overcomes a limitation highlighted in some studies that used tax information: the quantity and quality of taxpayer fiscal data. Access to the SEFAZ-MA database, which contains all the tax information for taxpayers in Maranhão, allowed us to work with a sufficient and up-to-date set of information across various market niches and allowed the tested scenarios to more accurately portray the performance of specific models within the fiscal context. Finally, the experiments assessed the effect of the temporal extension of training data may impact the model’s accuracy, problem addressed in the work of Bayer (2015).
3. HYBRID INSTANCE SET METHODOLOGY (HIS)
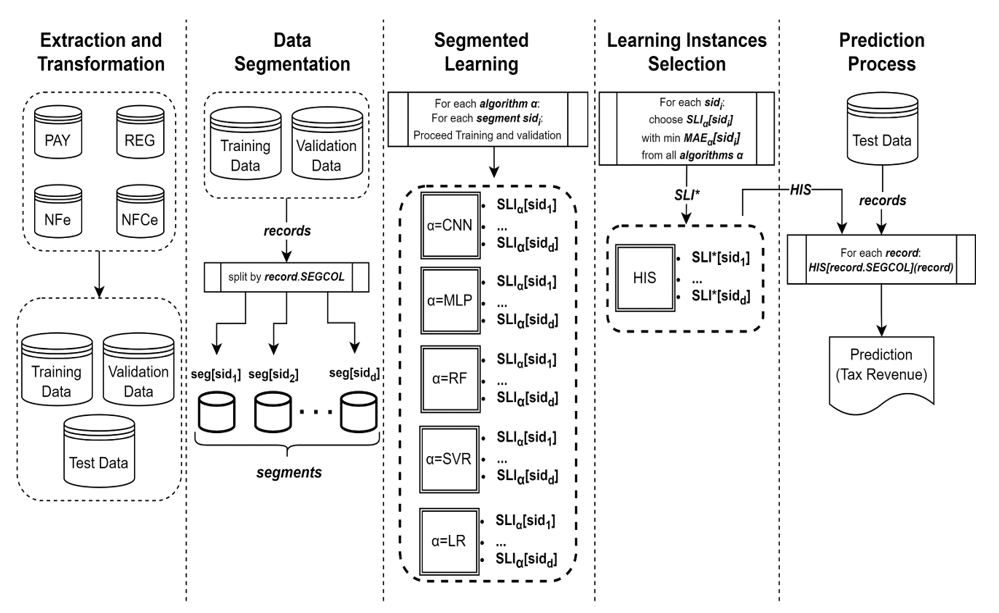
The entire flow of the proposed model learning methodology is illustrated in Figure 1. It begins with the Extraction and Transformation step in which the bases with tax information are prepared for the creation of training, validation, and testing datasets. In the second step, the Data Segmentation¸ training and validation datasets are divided into smaller sets (segments) according to a given categorical parameter. Next, in the Segmented Learning step, the learning process fits several machine learning algorithms for each segment. After that, in the Learning Instances Selection, the methodology chooses the machine learning model (learning instance) that produces the best prediction result for each segment. Finally, the Prediction Process gets the learning instance according to the segment identifier of each record to predict tax revenue. The following sections will provide detailed explanations of these stages.
Figure 1 – Segmented learning model flowchart
3.1 DATA SOURCES
The Secretary for Finance of Maranhão (SEFAZ-MA) provided the fiscal information for this study. These data are protected by fiscal confidentiality; hence, the research was conducted under a confidentiality agreement that prohibits the disclosure of the data.
Multiple data sources store fiscal information. Based on their relevance to federative unit revenue, this research utilized four subsets from the following sources: Taxpayer Registry (REG), Payments (PAY), Electronic Invoice (NFe[4]), and Electronic Invoice for Consumer (NFCe[5]).
The REG database stores information related to the taxpayer and the economic sector in which they operate. Among this information, the one utilized in this research is the National Registry of Legal Entities (CNPJ[6]) number. By convention, this number consists of 14 digits following a specific formation rule: the first 8 digits (ROOT CNPJ) identify the corporate group, which can be composed of one or more establishments; the next 4 digits, along with the ROOT CNPJ, identify an establishment within the corporate group; and the last 2 digits are verification digits.
The calculation system stipulates that the taxpayer must calculate the tax amount for each monthly period and pay it by the twentieth day of the subsequent month after the calculation. The PAY database stores the date and information of the payment amounts made by each establishment for the various tax natures.
The taxpayer provides economic and tax information for each commercial operation in two tax documents: the NFe and the NFCe. The former is more comprehensive, distinguishing between 6 fields of different tax natures, albeit with more formalities in completion. The latter is simpler, distinguishing only 2 distinct tax nature fields, and is used to represent transactions with smaller amounts conducted in-person at retail establishments. The NFe database stores electronic invoices, while the NFCe database stores electronic invoices for consumers.
3.2 EXTRACTION AND TRANSFORMATION
The process of creating an analytical model begins with the data extraction phase. In this step, the extractors capture the data, and perform cleaning and transformation. Cleaning involves removing invalid fiscal documents based on criteria that classify values as exorbitant or events that nullify a particular operation. Transformation aggregates the information monthly in accordance with the ICMS calculation system. As there are tax audit systems that control the entry of information into the SEFAZ, the data exhibit few structural or consistency issues.
To streamline experimentation time without compromising result reliability, we limited the dataset to a subset of 70 economic groups with significant representation in fiscal revenue and economic activity across various market segments. The subset of data consists of 6,201 distinct establishments and 127,654 records from January 2015 to December 2021. Each record depicts the monthly revenue and economic values of operations for each establishment.
Table 2 lists the variables and their respective concepts. These variables were selected due to their strong correlation with the amount of tax to be paid, in accordance with the ICMS calculation system established in tax legislation.
Table 2 – Details of the dataset columns

The methodology divided the dataset into 3 subsets: training, validation, and testing. The learning stage uses the training and validation datasets. The experimentation used the testing dataset to provide an unbiased evaluation of the final models fit on the training dataset. Section 5 will present the details of these datasets according to each evaluation scenario.
3.3 DATA SEGMENTATION
The segmentation process precedes the learning phase and splits the training and validation datasets by clustering records according to categorical column informed as a parameter. Thus, let  be either the training or the validation dataset and let
  be a given categorical column. The segmentation process partitions into mutually exclusive subsets
  defined as:

where  the segment identifiers, are the distinct values of , for
  .
.
For the purpose of this research, the parameter was the ROOT CNPJ (Table 2). Therefore, considering that the dataset has 70 corporate groups, this number also represents the quantity  of distinct segments. Figure 2 illustrates the values (M – millions; K – thousands) of the predictive variables and the aggregated Revenue for some segments.
Figure 2 – Field values for 5 Segments in Brazilian currency (R$)

Figure 3 illustrates the values of predictive variables and aggregated Revenue annually over the historical series.
Figure 3 – Field values in Brazilian currency (R$)

Figure 4 illustrates the quantity of records and revenue in each segment. Each record represents the economic information and the fiscal revenue value of a taxpayer, aggregated monthly.
Figure 4 – Distribution of the number of registrations and tax revenue by segment

The relationship between the tax burden reported in fiscal documents and the amount of tax paid exhibits significant variations, due to the peculiarities of each taxpayer. Some enjoy tax benefits, while others have taxation rules that increase or decrease the tax amount for various reasons, such as the type of economic activity, the number of jobs the company generates, and other factors. The depicted segments showcase the diverse peculiarities of taxpayers, both in the distribution of tax burden values across various variables and in the accumulated value of each.
3.4 SEGMENTED LEARNING
The segmented learning approach proposed in this research involves training and validation steps for each segment, and this process is repeated with different algorithms. This study used the following algorithms: Multilayer Perceptron (MLP), Support Vector Machines (SVR), Convolutional Neural Network (CNN), Random Forest (RF), and Linear Regression (LR). The selection was based on algorithms validated in the literature and with different learning logics to enable greater adaptability to the realities and peculiarities of taxpayers. Considering that learning models based on recurrent neural networks, including LSTM, do not ignore the data order and temporal significance (Huang et al., 2020), they were excluded from the experiments since the descriptive data of economic operations do not contain relevant information stored in previous sequences, and the underlying patterns change over time due to changes in tax legislation.
The training process applies the same variations of hyperparameter settings, according to the architecture of each algorithm, to the created segments. Finally, the training process fits a Learning Instance (regression function)  that predicts the estimated revenue (Table 2) for each record
  and according to each algorithm
Regarding the metric used in the validation process, consider that is the revenue paid by each taxpayer in each period. Given that our primary goal is for

the metric used in this research and that reflects the deviations for all records in a segment is the Mean Absolute Error, as follow:

where  is a prediction function,
  and
and  is the total number of records. When
  , we define
  as follows:

3.5 LEARNING INSTANCES SELECTION
The learning instance selection step begins by analyzing the metrics of the learning instances. For each segment identifier  , the learning instance with the smallest
  among all algorithms used in the segmented learning phase is selected to compose the Hybrid Instances Set (HIS), as follows:

where  , and
, and 
The revenue forecasting process requires the categorical segmentation parameter. Thus, for each record in a dataset, the model obtains the segment identification and retrieves the corresponding  in the
  . After that, prediction is performed with the predictive variables of the record. Therefore, due to the granularity of the prediction, the model supports an analytical view with drill-down and drill-up to enable a more complete analysis of the collection behavior.
4. EXPERIMENTS AND RESULTS
The proposed segmented learning approach in this study aims a better refinement of learning based on two hypotheses. The first is that segmented learning can produce a more assertive predictive model. The second is that the selection of the learning instance that produced the best result in the established metric among the instances of the various algorithms used in the learning phase can better adapt to the heterogeneity of the dataset.
To evaluate the first hypothesis, we fitted machine learning algorithms in the training and validation datasets with the same variations in hyperparameter configurations twice according to the segmented and non-segmented approaches. The non-segmented generates only one learning instance, denoted as  , according to each algorithm
  . The segmented approach generates multiple learning instances
  , one for each algorithm and each segment
  , as explained in section 3. Then, the process used the learning instances of both approaches to predict the test dataset to compare the predictive results.
To evaluate the second hypothesis, we used the Hybrid Instance Set  to predict the test dataset. Finally, the experimental process applied the current SEFAZ-MA model to predict the test dataset. Tables 5 to 7 in section 5.3 lists the predictive results.
4.1 SCENARIO DETAILING
Considering the mutability of legislation and its effects on the relationship between predictive variables and monthly revenue, this research evaluated the influence of the temporal extension of training data and its proximity to the prediction moment. Therefore, the experimentation adopted division by time frame to extract training, validation, and test sets. Table 3 lists two scenarios explored in the experiments. In each scenario and for each dataset  , the table details the following characteristics. The Time Frame indicates the interval in years that contains records. The Records Number is the dataset size ( ). The Distinct Payers informs the number of distinct taxpayers. The Total Revenue represents the sum of revenues from all records r in a dataset DS, given by:

Table 3 – Details of the experiment scenarios

The 1st and 2nd scenarios assess the effect of the temporal extension of the training dataset on predicting revenue for the test dataset records in the time frame of 2021.
The detailed scenarios demanded the creation of two Hybrid Instances Set  . Given that the dataset has 70 distinct segments, each generated
  will have 70 . The distributions of
for each algorithm are listed in Table 4.
Table 4 – Distribution of the 70 SLI* in each algorithm

Table 4 shows that all algorithms achieved better metrics in some segments, albeit with less expressiveness for some algorithms.
4.2 RESULTS AND DISCUSSION
Following the sequence of scenarios enumerated in Table 3, the experimental results are presented in the tables in this section. Each row of Tables 5 to 7 corresponds to the prediction of an algorithm performed on the test dataset. The first column is the RANK, which represents the position in ascending order by the value of the MAE. The second is the MODEL, which refers to the algorithm regression function used in the prediction. The third column is the TOTAL ESTIMATED, which represents the sum of estimated revenues from each record in a test dataset , given by:

Where  is a regression function among the following options:
  ,
,  and SEFAZ-MA model.
The fourth and fifth columns are the TOTAL ERROR and the TOTAL ERROR %, 0respectively, given by the following formulas:

The sixth is the MAE, the mean absolute error of predictions.
The results produced by the currently used methodology in the SEFAZ-MA are presented in another table after the scenarios for each target year of prediction. Some tables have highlighted rows because the analyses and discussions emphasize them.
4.2.1 TEST DATASET: 2021 TIME FRAME
Analyzing Tables 5 and 6, it can be observed that, predominantly, the algorithms trained in the segmented approach  achieved better results than when trained in the traditional non-segmented approach
  , with the exception of the
  technique. It is also possible to perceive the effect of the temporal extension of the training dataset. For the target year 2021, the increase in the temporal extension harmed the MAE of the techniques, except for
  and
and  .
.
Tables 5 and 6 show that the models in the top 4 positions estimated revenue with a total error below 3%. According to this criterion, the best result was produced by 
(Table 6), with an approximate difference of less than 12 million, out of a total of approximately 2.5 billion, representing a deviation of only 0.5%. Although this measure is important for secondary purpose, an increase in the MAE indicates that the deviations for each prediction are larger, with a trade-off between positive and negative deviations, making it challenging to obtain an analytical view.
Table 5 – Prediction results for the 1st Scenario: HIS01; Training Time 2015-2019

Table 6 – Prediction results for the 2nd Scenario: HIS02; Training Time Frame 2017-2019

Table 7 – Prediction results for 2021 – SEFAZ-MA

Figure 5 illustrates the top 10 models and the SEFAZ-MA model for the predictions of the target year 2021. On the X-axis, the arrangement of the models and the respective time frame used in training are in descending order of the MAE. The results show that a lower TOTAL ERROR % (orange line) does not necessarily indicate the best result for an analytical approach, given by the smaller MAE result (blue bars).
Figure 5 – Top 10 MAEs and SEFAZ-MA MAE for 2021 forecasts

The proposed model, was able to generate the best result in both the scenarios of Table 5 and Table 6. Considering the best result of the traditional approach, (underlined in Table 6) and adding to the comparison the results of the model currently used by SEFAZ-MA (Table 7), the best (underlined in Table 6) reduced the deviations by 18.4% and 51.9%, respectively.
5. CONCLUSIONS
This study proposes a segmented learning model to estimate fiscal revenue based on economic information used in the system for calculating the amount to be paid. The predictions from segmented learning architecture were compared with traditional non-segmented learning approaches and with the model currently applied by the fiscal agency that holds the information used in this research.
The proposed model, the Hybrid Instances Set , yielded the largest reductions in the deviation measured by the established metric between the estimated and actual revenues in all the designed experimentation scenarios. As illustrated in Figure 5, comparing the current method and ,
there was a reduction in the MAE from 38,578.41 to 18,557.92. Regarding the effects of the temporal extension of the training dataset, the results show a consistent improvement on shorter time series.
Future research can evaluate models to estimate future tax information and use this information in the proposed model, as well as address optimization strategies for the training stage. Additionally, due to its analytical capability, it is possible to combine descriptive variables dependent on tax legislation to evaluate the model’s application in studies that measure impact in case of changes in the tax calculation system. It is possible to evaluate the model as a support tool for detecting signs of tax evasion by grouping taxpayers from the same economic sector. Finally, studies to validate the model in other non-tax and even non-governmental contexts can assess the scalability of the proposed model.
ACKNOWLEDGMENT
The authors would like to thank the Secretary for Finance of Maranhão SEFAZ-MA, CAPES – Finance code 001 and FAPEMA Process APP-09405/22.
REFERENCES
Bayer, O. (2015). Relevance of Input Data Time Series for Tax Revenue Forecasting. Procedia Economics and Finance, 25, 518–529. https://doi.org/https://doi.org/10.1016/S2212-5671(15)00765-0.
Buxton, E., Kriz, K., Cremeens, M., & Jay, K. (2019). An Auto Regressive Deep Learning Model for Sales Tax Forecasting from Multiple Short Time Series. 2019 18th IEEE International Conference on Machine Learning and Applications (ICMLA), 1359–1364. https://doi.org/10.1109/ICMLA.2019.00221.
Huang, J., Chai, J., & Cho, S. (2020). Deep learning in finance and banking: A literature review and classification. Frontiers of Business Research in China, 14(1), 13. https://doi.org/10.1186/s11782-020-00082-6.
Hui, X. (2020). Comparison and Application of Logistic Regression and Support Vector Machine in Tax Forecasting. 2020 International Signal Processing, Communications and Engineering Management Conference (ISPCEM), 48–52. https://doi.org/10.1109/ISPCEM52197.2020.00015.
Kumar, N. N., Sridhar, R., Prasanna, U. U., & Priyanka, G. (2023b). Tax Management in the Digital Age: A TAB Algorithm-based Approach to Accurate Tax Prediction and Planning. 2023 International Conference on Inventive Computation Technologies (ICICT), 908–915. https://doi.org/10.1109/ICICT57646.2023.10133949.
Lahiri, K., & Yang, C. (2022). Boosting tax revenues with mixed-frequency data in the aftermath of COVID-19: The case of New York. International Journal of Forecasting, 38(2), 545–566. https://doi.org/https://doi.org/10.1016/j.ijforecast.2021.10.005.
Liu, D., Zhang, R., & Li, J. (2011). Tax Revenue Combination Forecast of Hebei Province Based on the IOWA Operator. 2011 Fourth International Joint Conference on Computational Sciences and Optimization, 516–519. https://doi.org/10.1109/CSO.2011.251.
Li-Xia, L., Yi-qi, Z., & Yong Xue-Liu. (2011). Tax forecasting theory and model based on SVM optimized by PSO. Expert Systems with Applications, 38(1), 116–120. https://doi.org/https://doi.org/10.1016/j.eswa.2010.06.022.
Lu, S., Jian Zhong-Cai, & bin Xiao-Zhang. (2009). Application of GA-SVM time series prediction in tax forecasting. 2009 2nd IEEE International Conference on Computer Science and Information Technology, 34–36. https://doi.org/10.1109/ICCSIT.2009.5234606.
Noor, N., Sarlan, A., & Aziz, N. (2022). Revenue Prediction for Malaysian Federal Government Using Machine Learning Technique. 2022 11th International Conference on Software and Computer Applications, 143–148. https://doi.org/10.1145/3524304.3524337.
Ticona, W., Figueiredo, K., & Vellasco, M. (2017), Hybrid model based on genetic algorithms and neural networks to forecast tax collection: Application using endogenous and exogenous variables. 2017 IEEE XXIV International Conference on Electronics, Electrical Engineering and Computing (INTERCON), 1–4. https://doi.org/10.1109/INTERCON.2017.8079660.
Xu, H., & Ma, M. (2021). An Improved Hybrid Model base on SVM and Random Forest for the Prediction of Corporate Taxation. 2021 IEEE 3rd International Conference on Civil Aviation Safety and Information Technology (ICCASIT), 1035–1038. https://doi.org/10.1109/ICCASIT53235.2021.9633659.
Zaw, T., Kyaw, S. S., & Oo, A. N. (2020), ARMA Model for Revenue Prediction. Proceedings of the 11th International Conference on Advances in Information Technology. https://doi.org/10.1145/3406601.3406617.
APPENDIX – FOOTNOTE
4. Acronym for Nota Fiscal Eletrônica – NFe, in Portuguese.
5. Acronym for Nota Fiscal do Consumidor Eletrônica – NFCe, in Portuguese.
6. Acronym for Cadastro Nacional de Pessoas Jurídicas – CNPJ, in Portuguese.
[1] M.SC in progress in the area of Computer Science at UFMA. Lato sensu postgraduate degree in Tax Law from Faculdade Venda Nova do Imigrante, in 2017. Telematics Technologist from IFPB in 2004. ORCID: 0009-0004-9163-7396. Currículo Lattes: http://lattes.cnpq.br/0769403199946412.
[2] PhD at the Department of Informatics at PUC-Rio between 2014 and 2015. PhD in Computer Science from the Institute of Mathematics and Statistics at USP, 2003. ORCID: 0000-0001-8339-3679 Currículo Lattes: http://lattes.cnpq.br/0770343284012942.
[3] Advisor. PhD in Science from the Electrical Engineering program at the University of São Paulo (2009), Master in Informatics from the Federal University of Paraíba (1999) and Graduate in Computer Science from the Federal University of Maranhão (1996). ORCID: 0000-0001-7996-7334. Currículo Lattes: http://lattes.cnpq.br/5901564732655853.
Material received: April 24, 2024.
Peer-Approved Material: May 23, 2024.
Edited material approved by the authors: July 20, 2024.