CRUZ, Marcielle Souza [1], RIOS, Cláudio Oliveira [2]
CRUZ, marcielle Souza, RIOS, cláudio oliveira. Economic-financial performance: an analysis applied to publicly traded corporations. Multidisciplinary core scientific journal of knowledge. 03 year, ed., vol. 08 06, pp. 27-59, August 2018. ISSN:2448-0959
SUMMARY
This work deals with the analysis of the financial statements of 20 public companies with shares traded on the stock exchange (BM & FBOVESPA), well screened by the criterion of greater profit, now by the greater prejudice, in absolute values in the year 2016. It was used for the calculation of activity indicators and financial indicators more applicants of accounting literature. The main objective of this work is to identify from the indicators which factors were decisive to the outcome of these companies. For the results to be achieved, bibliographic searches were carried out, in which we sought to describe the concept of financial statements, analysis of financial statements and calculation of indicators. With respect to the research methodology was used to research descriptive and qualitative analysis. With the interpretation of the indexes reached the expected results by the Academy, companies with the highest profits showed the best results in the indicators, enabling the identification of those factors most relevant to accounting its results. Therefore, the importance of analysis of financial statements to show the economic and financial situation of the entities.
Keywords: financial statements, BM & FBOVESPA, indicators
INTRODUCTION
Given the major changes in the market, the entrepreneur who decides to invest need to do a constant search for information to aggregate knowledge. It is necessary to understand a little of each part of the business and so exercise your role as administrator. In this way, the use of information that represent the real situation of a company if it makes necessary and are of the utmost importance because, from them will be drawn the business strategies. Soon, the Accounting provides valuable information about the financial health of the company, through the elaboration of financial statements information that is indispensable for a good orientation, providing greater efficiency in the management and asset control.
Accounting has as purpose the generation of information on equity and its variations. The financial statements, for your time are a concentration of all the oscillations that occur in organizations in certain period heritage and a source of information for the company and society. Each financial statement brings together different elements that together become essential to good management (FRITZ, 2015). Its goal is to provide information about the financial position, information which are useful for proper decision-making in the middle.
The analysis of the financial statements is a technique that relies on data collection, aimed at the determination of indicators making it possible to assess the ability to meet the solvency asset structure and discover the propensity of the entity to generate results ( SILVA, 2014), thus becoming an important option, and significant for the proper understanding of the real financial situation of companies.
A good accounting and consequently a good preparation of the financial statements and an adequate analysis of the statements from the economic and financial indicators, becomes a determining factor for the primacy in business. Is a fundamental instrument for the good practice within a company.
The financial indicators constitute an important management tool. Before them, it is possible to make an analysis on the current situation of the company, is to pass on to the market or even to show critical points to be worked out. Therefore, it becomes a valuable tool for measuring the performance of a particular company or market segment (FRANCISCO, 2015).
The indicators are calculated from the financial statements that purport to demonstrate certain aspects. Based on the indicators it is possible to achieve a result more transparent. Thus, this paper will explore the financial statements of the companies whose shares are traded on the stock exchange (B3 s.a) and who have obtained the higher profits in the year 2016. With the analysis, is still analyzing the companies with the biggest losses in the period and so confront the results and verify that the indexes really reproduce the real situation of the companies.
It is worth mentioning here that the B3 s.a is the current business name of BM & FBovespa, one of the largest suppliers of infrastructure for the financial market, and holding the role of encouraging the markets in which it operates through innovation and product development. Today it is the main institution in the capital market intermediation of Brazil, being the sixth largest exchange in terms of market value in the world. (B3 s.a, 2017).
In Brazil, there are 445 companies listed on the entity, (BM & FBOVESPA, 2017) i.e. anonymous companies. Joint-stock companies or corporations (S) are companies that share your social capital in shares, according to article 1 of Law 6404 of December 15, 1976 (law of societies by shares) and may have open or closed your capital, being open when your securities are traded on the stock exchange and closed when they are not admitted to trading, as article 4 of Law 6404/1976. Today in Brazil the stock market moves in brazilian economy an average daily volume of 7.19 billion Reais, these values stipulated by March 2017. In 2016 moved an average of 6.53 billion Reais and in 2015 6.06 billion Reais on average. (ECONOMATICA, 2017).
This work will focus on analysis and interpretation of financial statements. Through the analysis it will be possible to evaluate the performance of asset management and perform comparisons between companies. Still, it will be possible to determine future expectations of rentability and continuity of business. Allowing managers more assertive decisions, as well as implement changes case demonstrate an unfavourable scenario (SILVA, 2014), as well as understand what measures and strategies have been adopted to achieve success.
On of the above is that the theme and problem discussion: through the analysis of financial statements, how to identify the determining factors for the results, whether they are profit or loss, of publicly traded corporations.
This study aims to identify the General from the financial economic indicators the determining factors for the optimization of the performance of publicly traded corporations based on their financial statements. To achieve the overall objective were defined the following specific objectives:
- Identify publicly traded companies that recently presented the higher profits, as well as those who earned the biggest losses;
- Extract information through the financial statements of these companies on the basis of the data of BM & FBovespa.
- Calculate activity indicators, liquidity, capital structure and profitability.
- Analyze and interpret the indicators calculated.
- Compare indicators and information obtained from each company.
The choice of the theme arose from the need to demonstrate how a correct and appropriate analysis of financial statements make a difference within an enterprise, contributing to a good corporate management, for proper implementation and feasibility coach. This paper will explore the financial statements of the companies whose shares are traded on the BM & FBovespa. For this it is essential initially support of theoretical form the financial statements, the balance sheet and statement of income for the year.
This work becomes relevant, because currently the bibliographies available are remarkable quantity and quality of works that adorn and argue about the relevance of the analysis of financial statements, both for a good administration or to assist managers in decision making. Many authors talk about the importance of financial statements and on the analysis of the same, your indispensability for the design of information that actually are useful and support the direction of business. Is feasible for being a study that deals with access to financial information that will give the understanding and analysis that will be developed on certain companies.
2 LITERATURE REVIEW
In this chapter are presented theoretical data based on current literature, accounting legislation and standards in force. Will be described aspects of accounting, financial statements, with emphasis on balance sheet and statement of income for the year, types of actions, B3 s.a. (BM & FBovespa), as well as the indicators of activity, liquidity, capital structure and profitability.
Accounting is the science that studies and manages equity (set of assets, rights and obligations) of the companies and their quantitative and qualitative variations occurred in the entities. For Greco and Arend (2013) the concept of a coordinated set of accounting information with the objective and purpose defined, governed by precepts and norms.
Accounting achieves its goals through the record of events occurring in the company accounting moves and variations, to ensure your control and provide appropriate information to the management of the company. According to Greco and Arend (2013) accounting registers, studies and analyzes the events that occurred within the company and that affect equity, so as to ensure the asset control and provide relevant information.
Thus, accounting is a computerized system designed to provide users with adequate and reliable information to interested parties to decision making. Simply, it is the science that aims to record the events that occurred within the company (BRUNI, 2010). Already, Greek and Arend (2014, p. 01) defines the following as accounting:
She records, studies and plays (for analysis) the financial and economic facts that affect the assets and liabilities of a particular person or entity. That assets and liabilities is presented to the user (the person who has an interest in evaluating the situation of the entity) by means of the traditional financial statements and exception reporting, for certain specific purposes.
As a result of the accounting financial statements, monetary asset position structured representation on the given date. Your goal is to produce information about the asset position, results and cash flow. These objectives that are useful for decision-making and providing managerial results. Are a kind of graphical representation of the events that occurred in a given period and must be clear and easy to understand for all concerned.
At the end of each fiscal year, the corporations whose shares are traded on the stock exchange should disclose their financial statements with clarity, as article 176, 6404/1976 Law. Through the publication of financial statements it is possible to make a tangible follow-up of the situation of the company, reviewed the feasibility or not. According to the law 6404/1976, CVM deliberation # 488/2005 and NBC 26 TG (R4) financial statements that have mandatory publication by publicly traded companies are:
- balance sheet;
- statement of accumulated profits or losses;
- statement of income for the year;
- statement of cash flows; except for closed companies with shareholders ' equity on the balance sheet date, not exceeding R $2,000,000.00.
- If a publicly-traded company, value added statement;
- demonstration of changes in shareholders ' equity (DMPL);
- comprehensive statement of income (DRA);
- explanatory notes.
Within the financial statements listed above, the balance sheet and statement of income for the year are the demonstrations with greater importance within the company, show clearly and objectively the financial and economic situation. Both will be focus of this study, due to your generation.
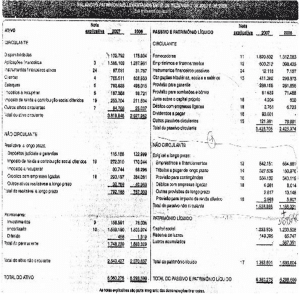
The balance sheet shows the assets and financial position of an organization, assets, rights and obligations, like a photo, a static representation. It is divided into two large groups, active and passive. And comprises the asset accounts, assets and rights of an entity, Liabilities, obligations that the company has with third parties and Equity, which represents the net value of the company. In table 1 you can see this structure:
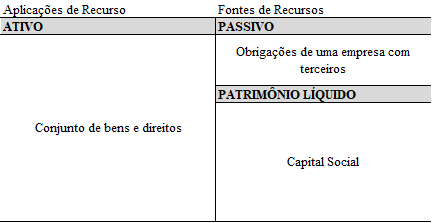
Table 1 – balance sheet Structure Saporito (2015, p. 53)
highlights:
Balance sheet is a report expressed in table form with two distinct sides, the left and the right side, each with your function specifies in order to gather accounts that have common features between them. In conceptual terms, the balance sheet is a financial statement that shows the financial situation of an entity on the given date.
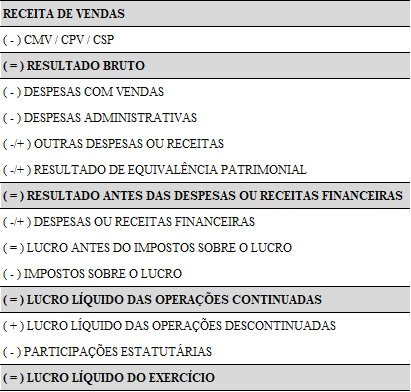
Already the statement of income for the year is a fundamental report, therefore, presents the composition of the company's result in logical sequence and ordered searches highlight the operational results that occur by the movement of assets and the result NET, i.e. values that effectively stayed to the partners (KINGS, 2009). According to Kings (2009, p. 98[…]): "this statement shows, in logical sequence and ordered all the factors that influenced more or less than the result for the period, becoming thus valuable instrument for decision-making[…]". For a better understanding, the following is presented in table 2, a summary of the model DRE.
Table 2-Structure statement of income for the year
Both the balance sheet as a demonstration of the Result of the exercise highlighted previously, should be published because of the requirement for disclosure. Large companies are obliged to disclose their demonstrations, even if it doesn't set up as limited liability company, supported by article 3 of law 11,638/2007 (BRAZIL, 2007).
It is considered large company those with total assets greater than R $240 million or annual gross revenue higher than R $300 million, according to § 1 of Law 11,638/2007 (BRAZIL, 2007). The Constitution of a company takes place in two ways, the capital open (public) or closed (private subscription). Have publicly when their shares are traded on the stock exchange, with any person and may be a member of the business from the purchase of the shares. And will be closed if its shares are not traded on the stock exchange. Thus, the third party access is limited, therefore, are not available for purchase. (IBMEC[2016]).
Shares are securities in the capital market and representing a portion of the share capital of the company that issued it. Its purpose is to raise funds that could be used in the development of the business. Are divided into two groups: preferred shares and common shares, the main difference between them is that ordinary bearer shares allow a vote in decisions of the company, while preferred shares entitle the holder priority receipt of dividends (BM & FBOVESPA,[2017]).
Today in Brazil the B3 S, former BM & FBOVESPA is who manages and organizes the stock market. Is the main institution of intermediation for capital market transactions of Brazil and one of the largest suppliers of infrastructure for the financial market in the world. Offers trading, post-trade services, over-the-counter transactions and registration of vehicle financing and real estate. It was created in March 2017, emerging from the combination between the BM & FBOVESPA with CETIP. This Union has consolidated the company as a supplier of financial market infrastructure, expanding the services and products offered to customers (BM & FBOVESPA,[2017]).
A company with shares traded on the stock exchange needs to demonstrate to the public indicators that reflect clearly and accessible your economic and financial situation, with respect to future expectations of rentability, financial return or degree of indebtedness. In this way, the use of demonstrations in conjunction with the analysis you do of extreme relevance for investors. Thus, the use of techniques for analysis of financial statements shown efficient to pass on to interested results.
The use of technical analysis of stock and consequently of other financial statements originated in Brazil in the 1970 and was basically used within financial institutions for credit analysis. Soon, has become a fundamental tool for decision making, both for lending and investment (SILVA, 2014). According to Lins and Son (2012, p. 152): "analysis of the financial statements is important to identify potential economic and financial problems, in order to facilitate decision-making in time, fix problems that can exacerbate the situation.[…] "
But like any tool, it can have limitations, which must be observed. When performing the analysis, are examples of limitations: companies that operate solely in a market segment, there is no competition; effects of inflation and the exchange rate; potential distortions when comparing current and previous results; adoption of accounting practices differ from one period to another, among others. Thus, it is important to know the company in all aspects and features to perform the analysis (SILVA, 2014).
Among the options of analysis of financial statements, widely studied in bibliographies, this work will focus on the analysis through indicators or ratios because, according to Silva (2014, p. 133):
The calculation of indicators or ratios provides a comprehensive vision of the economic, financial and asset situation of the company, and your analysis must be carried out by building with historic series of numbers, which are assessed through relationship between accounts or groups of accounts that are part of the financial statements.
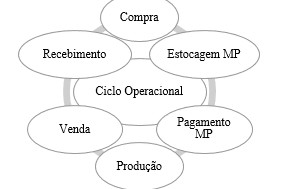
The analysis of indicators or Ratios is composed of two groups: activity Indicators and financial indicators. The calculation of the indicators of activity is called operating cycle and starts at the time of purchase of raw materials or merchandise and terminates at the time that the value for sale enters the company box, i.e. in the range in which the company needs to buy , produce, sell and receive.
Silva (2014, p. 134): "each company has your own Operating Cycle, the length of time required for the acquisition of goods or raw material, storage, production, distribution and receipt of the value corresponding to your sales. As shown in Figure 1, the operating cycle is represented as follows:
Figure 1-Operating Cycle process
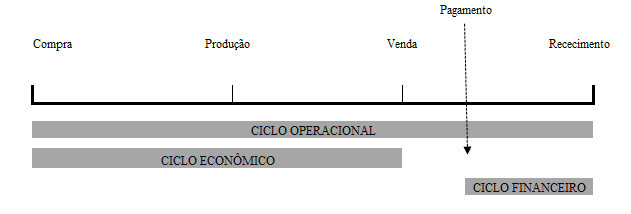
In addition to the operational cycle it is possible to determine the economic and financial cycle, from the data extracted from the financial statements. These data are used to quantify the time of development of the activities. In the economic cycle turns the time that the company spends to sell their goods, from acquisition of goods to your sale. Already the financial cycle is the period of payment to suppliers after the purchase of raw materials or goods to receipt in the company box. For a better understanding follow figure 2.
Figure 2 – Operating Cycle Steps
Quadro3-activity Indicators
| INDEX | GOAL | FORMULA |
| PMRE | Indicates how many days or months on average specific goods or product was in stock before being sold. | PMRE = (stock or Average Stock/CMV) x 360 |
| PMRV | Indicates how many days or months on average the company does it take to receive the values of sales. | PMRV = (receivables/sales revenue) x 360 |
| PMPC | Indicates how many days or months on average the company takes to pay off your debts with suppliers. | PMPC = (Average/Supplier Purchases) x 360 |
| OPERATING CYCLE | Compares the sales receipts with the term to payment of purchases. | CO = PMRE + PMRV |
| FINANCIAL CYCLE | Shows the time between the payment made to suppliers and receiving sales. | CF = CO-PMPC |
Source: adapted from Silva (2014).
Already the financial indicators are a set of economic-financial indices calculated from some ledger accounts. With them you can get information about the company. Are divided into three groups: liquidity, Capital structure and Profitability. Saporito (2015, p. 148) describes economic-financial index as follows:
[…] are numbers, decimals or percentages, obtained through Division of values of accounts or groups of accounts of the financial statements. They can either be made on the basis of accounts belonging to the same financial statement as may result from the Division of the value of an account or group of accounts financial statements different but from the same company[…].
Already the Liquidity indicators are intended to assess the ability of a company to pay its financial commitments vis-à-vis third parties. Marion (2012, p. 75) emphasis added, defines: "are used to evaluate the company's ability to pay, i.e. constitute a judgement on whether the company is able to pay its liabilities. This ability to pay can be assessed, considering: long-term, short-term or medium-term. ". The main indexes are liquidity: current ratio (LC), liquidity drought (LS), immediate liquidity (LI) and General liquidity (LG). In table 4 it will be possible to check the purpose of each index as well as the formula for calculation.
Table 4 – Liquidity indicators
| INDEX | GOAL | FORMULA |
| CURRENT RATIO | Shows the company's ability to pay its short-term debts. | LC = Current Assets/Current Liabilities |
| LIQUIDITY DROUGHT | Shows the capacity of the Organization to meet its short-term commitments by removing stocks. | LS = Current Assets-Stocks/Current Liabilities |
| IMMEDIATE LIQUIDITY | Shows the immediate capacity of the company to pay its obligations with third parties in a short period of time. | LI = Cash/Current Liabilities |
| GENERAL LIQUIDITY | Shows the company's ability to take payments in the short term soon. | LG = current assets + LP assets/current liabilities liabilities + LP |
Source: the author, adapted from Silva (2014).
Capital structure indicators are related to the composition of the company's capital (own and third parties). Francisco (2015, p. 28) points out: "this index indicates the amount of third-party resources that is being used in an attempt to generate profits for the company."
For Silva (2014, p. 146): "in a way these indicators are linked to the financing and investment decisions, serving therefore to demonstrate the broad lines of financing decisions adopted by the company, in terms of obtaining and applying resources. "
Points-if the following indicators of capital structure or its main debt ratings: participation of third party capital, degree of indebtedness and debt composition. In table 5 will be possible to check the purpose of each index as well as the formula for calculation.
Table 5 – indicators of capital structure or indebtedness.
| INDEX | GOAL | FORMULA |
| THIRD CAPITAL PARTICIPATION | Shows how much of the funds invested comes from third parties. | PCT = Third Capital/PC + PLC + PL |
| DEGREE OF INDEBTEDNESS | Shows the total indebtedness of the company. | GE = Third Capital/equity |
| DEBT COMPOSITION | Shows the volume of debt of the company with respect to the total debt in the short term. | CE = current liabilities/Capital from third parties |
Source: the author, adapted from Silva (2014).
The analysis of these three indicators enables us to understand the company's debt profile. In addition to these indexes will be presented the profitability indicators that are also key parts for a better analysis of the companies.
Profitability indicators seek to show the return on total investment, explore a remuneration of capital sources, represented by equity and third parties (BRUNI, 2010). These indicators can be calculated from the following indexes: gross margin, net margin, return on assets (ROI), return on equity (ROE) and the active, as can be seen in table 6:
Table 6 – profitability indicators
| INDEX | GOAL | FORMULA |
| GROSS MARGIN | Shows gross profit after deductions of costs (CMV). | MB = gross profit/sales revenue |
| NET MARGIN | Compares the net profit compared to net revenue. Also called return on sales. | ML = net income/sales revenue |
| ROI | Measures the efficiency of the company to make a profit. | ROI = Net Income/Total Assets |
| ROE | Shows the return that shareholders are getting about their investments. | ROE = Net Income/Shareholders ' Equity |
| ACTIVE SPINNING | Shows the relationship between sales and the total investments made in the company. | GA = Net Income/Total Assets |
Source: the author, adapted from Silva (2014).
The analysis of indicators it is important to determine and analyze the situation of a company and provide a broad view about the economic, financial and accounting situation (SILVA, 2014). If so the use of validate financial statements and indicators mentioned above, endorsing this study, based on academic work performed earlier in this same line of research.
Francisco (2015) did an analysis from liquidity, debt indicators (of capital structure), profitability, and vertical and horizontal analysis of companies Renner and Hering. The study sought to highlight the importance of the analysis to demonstrate the actual economic and financial situation of the company, using the financial statement balance sheet, the statement of income for the year and the statement of cash flow companies.
Ever Garcia (2015) in your study sought to analyze the economic performance of companies in the segment of ceramic coating. Analyzed indicators of liquidity, profitability, capital structure and vertical and horizontal analysis and used the balance sheet and statement of income for the year.
In another study the intention was to analyze the liquidity indicators, the activity, the indebtedness (capital structure) and the profitability of companies listed on stock exchanges in pharmaceutical segment (RODNISKI; TODESCATO; FELTRIN, 2016), used in this study, the balance sheet and statement of income for the year.
For Louzada et al. (2016) the focus of the study were the companies listed on the stock exchange, but in the manufacturing segment. Used liquidity indicators, debt (capital structure), activity, among others. Chosen were statements balance sheet and statement of income for the year.
Note that in all these cases, there are limitations for specific segments, however, after the prior literature search, not found a comprehensive study that includes distinct segments companies. It is this gap that this work intends to fill.
3 RESEARCH METHODOLOGY
In this chapter the methodological framework of this study and the procedure for collection and analysis of data. The definition of methodology, as the literature: study of the Organization of the paths to be taken to perform a search or a study (GERHARDT; Souza, 2009).
Research enables us to the understanding of a given subject, being a permanent process that enables us to approach a certain fact or situation, it is a study planned in order to find answers to certain questions from the use of scientific methods (PRODANOV; FREITAS, 2013). A search can be classified based on the type of approach, nature, purpose and procedure used. The types of research approach are quantitative or qualitative. On qualitative scientific research there is no concern with the numeric representation, but with the deepening of the understanding of a social group, an organization. Quantitative research on the study relies on interpretation and translation of the information, that is, the results can be quantified (PRODANOV; FREITAS, 2013).
With respect to your nature can be basic research or applied. In basic research, the goal is to generate new knowledge without any practical application. In contrast, in applied research the main objective is to solve a problem. Regarding the approach and nature of this research, it is the qualitative basic nature. As to the objectives of the survey, you can highlight the descriptive research, by requiring the author a lot of information on the topic of study which were recorded, described and observed without any interference. This research goal aims to describe characteristics of a particular population or establish relationship between them (PRODANOV; FREITAS, 2013).
From what has been exposed this work can be defined as a qualitative research, basic, descriptive. Will have as a source of information the financial statements of the companies whose shares are traded on the stock exchange. The data were collected, organized and standardized for they got the results that have been analyzed. In relation to our research is a case study, since this type of approach has several applications, being suitable for individual studies. For Prodanov and Freitas (2013), the kind of case study framework boils down to collect and analyze a sample for the purpose of studying different aspects.
In relation to this research sets forth phases as follows: survey of financial statements; Organization and standardization of data; application of analytical tools, in this case Microsoft Office Excel; interpretation of results; General analysis and conclusion.
The study was conducted with fourteen companies of various sectors of the brazilian economy, selected by relevance in your net income for the year 2016 base. For better comparison, also included the six companies with the biggest losses in the period. In table 7 you can verify the selection of companies and their profits and losses, that is, the sample of this study.
Table 7 – Companies with higher profits and losses in 2016
| Company | Sector | Jan-10 2016 profit (Thousand R$) |
| VALLEY | Mining | 13,311,455 |
| AMBEV | Food and Beverages. | 12,546,610 |
| CTEEP | Electric Energy | 4,932,312 |
| BOOK | Telecommunications | 4,085,242 |
| CIELO | Software and data | 4,005,450 |
| ELETROBRAS | Electric Energy | 3,425,899 |
| SABESP | Water and Sewer | 2,947,098 |
| KLABIN | Pulp and paper | 2,481,946 |
| KROTON | Education | 1,864,635 |
| CCR | Transport and Taizé. | 1,713,851 |
| SUZANO | Pulp and paper | 1,691,998 |
| FIBRIA | Pulp and paper | 1,654,848 |
| ULTRAPAR | Ultrapar | 1,561,585 |
| ENGIE | Electric Energy | 1,547,303 |
| Hi | Telecommunications | -6,943,506 |
| PDG | Construction | -5,307,817 |
| GERDAU | Siderur & Metalur. | -2,890,811 |
| GAFISA | Construction | -1,163,596 |
| RENOVA | Electric Energy | -1,101,472 |
| COURSE | Transport and Taizé. | -1,063,230 |
Source: Economatica (2016).
To achieve the objectives that were proposed in the survey were selected the balance sheet and statement of income for the year for 2016. After data collection, was applied to analysis by indicators of quotients. The results obtained were organized and standardized in spreadsheets so that if I could make a comparison with all companies of this research.
4 analysis and discussion of the RESULTS
From what was explained in the previous chapters and based on what was worthy, this chapter will demonstrate the results. The survey examined a selection of twenty companies, where fourteen are among the biggest profits and six with the biggest losses. The sample for this survey was selected due to the net profit of these companies 2016. We analyzed all the indicators highlighted in the theoretical framework. Companies that showed losses shall be represented by the color red in the charts.
Each company studied presents characteristics that make them unique in the market. One of the features is your operational and financial cycle, which reflects the policies adopted and your strategies, it affects directly in its medium term of rotation of stocks, sales receipt and payment of purchases.
The index of average inventory rotation (PMRE) aims to demonstrate how many days on average goods classified as stock, are in the company before they are marketed. In a satisfactory perspective companies must have a high rate of renewal of stocks, as long as it's a reflection of the marketing of products (SILVA, 2014). In the chart 1 is shown the results.
Chart 1 – average renewal of Stocks (PMRE)
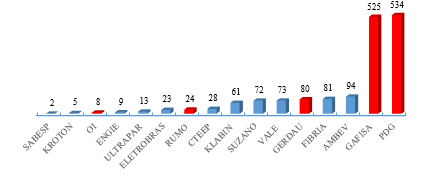
The company PDG is a leading company in the Brazilian real estate market, operates in the marketing of commercial and residential ventures, presented a PMRE of 534 days, i.e. This is the amount of days that the company brings to market their properties, after completion of the work. Gafisa, who plays in the same segment, showed a value of 525 days. These values are very retraction in the civil construction industry in years, mainly to 2015 and 2016, due to the political scenario, the income of households decreasing, fall in consumer confidence, among other things, were instrumental in this situation in the sector. (DONALD, 2015).
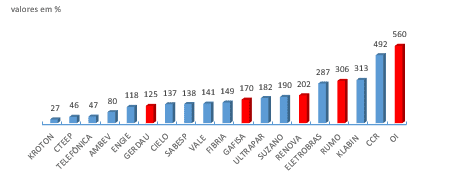
With respect to the average of the sales receipt (PMRV) your purpose is to indicate how many days on average a company takes to receive their values after the sales. Ideally, the period is as short as possible. This index also demonstrates the policy for granting credit that the company adopts. In graph 2, was not taken into consideration the value of the PDG, which was of 2,532 days, this considerable value to the PMRV is justified in principle, due to poor marketing of real estate in the year 2016, closing with R $247,228 sales revenue. The chart 2 it is possible to check the values found:
Chart 2 – Average receipt of sales (PMRV)
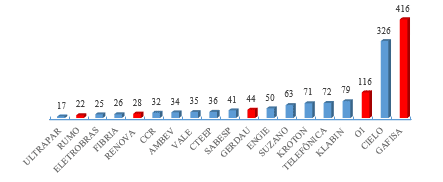
A company that stays healthy shall submit the lowest PMRV value possible. The study highlights the values of Ultrapar, 17 days and Course, 22 days, that even figuring among the biggest losses in the year 2016, obtained a value considerably.
The average payment of purchases (PMPC) shows the amount of days or months that the company takes to settle two debts with suppliers:
Chart 3 – average payment of purchases (PMPC)
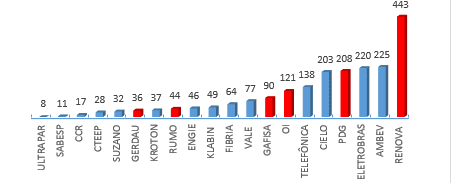
In reference to the values of the graph 3, you can validate the value of 443 days assigned the company Renews, in this case the company takes 443 days to settle their debts with the suppliers, the ideal for this index is to be superior to PMRV because, so there will be an adequate level of liquidity. When comparing the period of receipt of sales with the term to payment of purchases, it is feasible to analyze if the company is operating with a surplus or financial deficit in your operating cycle. The operating cycle from the time of purchase of goods until receipt of the sales, he can be found, when the company receives from its customers before payment of purchases, or a deficit when the sales receipt only occurs after the payment of purchases (SILVA, 2014).
The financial cycle represents the time in days or months between payment to vendors and the sales receipt, that is, the period that the company will need funding or not (spider, 2001). In smaller cycles it is possible to obtain higher profits on invested capital due to the increase in business turnover (ZANLUCA[2017],). Regarding the operational and financial cycle the most expressive of the sample values will be represented in table 8:
Table 8-operating Cycle, Comparative PMPC and financial Cycle.
| Operating cycle | PMPC | Financial cycle | |
| COURSE | 46 | 44 | 2 |
| Hi | 123 | 121 | 2 |
| GAFISA | 942 | 90 | 851 |
| PDG | 3,066 | 208 | 2,858 |
Source: Drawn by the author (2017), according to the companies.
The values of the operating cycle, PMPC and financial cycle indicate that the company pays its suppliers Bearing in 44 days after the shopping and 2 days after such payment the company received the value of sales, i.e. 46 days to buy, produce, sell and receive . In the case of PDG, the same, pays its suppliers in 208 days after purchases and only receives 2,858 clients days after payment to suppliers. To finance their customers by 2,858 days enterprise should use equity or resort to sources of funding. The indicators of activities should not be viewed in isolation, it is necessary to always be analyzed in conjunction with the liquidity indicators, enabling a better understanding of the real financial situation of the company.
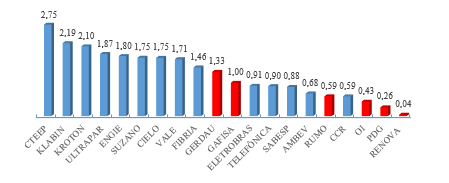
Liquidity indicators are intended to assess the financial capacity of the company to honour its commitments with third parties (SILVA, 2014). This indicator is subdivided in: current ratio, liquidity drought, immediate liquidity, liquidity. The index of current ratio demonstrates the company's ability to pay in the short term, in accordance with the higher the literature value found better, as it indicates how much resources the company has to pay off their debts. With respect to our sample, the results of the chart 4:
Graph 4-index of Current
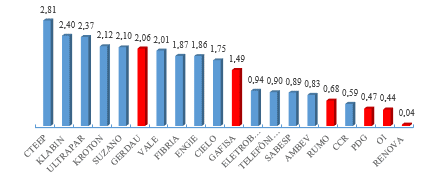
The values that stand out in this calculation is 2.81 CTEEP, represents that for every R $1.00 of debt she has R $2.81 to clear and still have surpluses. Electric power transmission company Paulista or CTEEP is a concessionary company of brazilian electric power transmission, is in third place in the ranking of higher profits with R $4,932,312 of net profit in the year 2016. With respect to this index it is still possible to highlight the values found for Klabin, 2.40 and Ultrapar, 2.37.
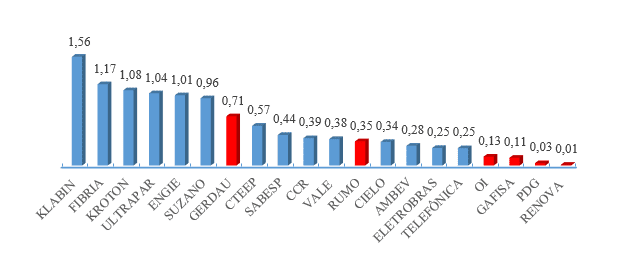
The liquidity drought index, represents the ability of payment of long-term debt that the company has. If the result of the index is less than R $1.00, there is evidence that the company present financial problems in the short term, but if it exceeds R $1.00, the company has sufficient balance to honor its financial commitments, as Hoji (apud 2010 SILVA; COUTO; CARDOSO, 2016).
Chart 5-liquidity Drought Index
With respect to this index the sample with the six companies that have obtained the largest losses, four of them as demonstrated in Chart 5, are with the lowest liquidity drought indices, they are: Gafisa, Rumo, HI, PDG and Renews. Also it is necessary to highlight the value of 0.68 to Ambev, which got the second-highest net income in 2016, reached a value well below compared with the CTEEP which reached the value of 2.75.
In immediate liquidity index chart 6 is determined the immediate capacity of the company to pay its obligations with third parties in a short period of time. Iudícibus (1998) points out that this index represents the value available with immediate access to pay off short-term debt.
Chart 6-Immediate Liquidity index
Again the companies that had the greatest losses are smaller indexes: the Klabin company, the largest producer and exporter of Brazil's papers (KLABIN,) in 2016 obta[2017]ined net profits of R $2,481,946 and your immediate liquidity index represents 1.56 the highest percentage of the sample. In general liquidity index it is possible to check the ability of long-term payment therefore considers all she can convert into money.
Graph 7-General Liquidity index
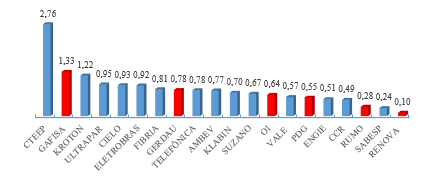
Stands in the General liquidity index, the company CTEEP to 2.76, i.e. for each R $1.00 long-term debt the company has R $2.76 available to pay off their debts.
On the index of capital structure, they looking to validate the return on capital invested, whether own or third parties. Evaluate enterprise security, depicting the relative position of the equity with respect to the third-party capital, are indicators of the utmost importance, because they demonstrate the dependence of the company with respect to third-party capital (IUDÍCIBUS, 1998). This is subdivided in index of participation in third-party capital, indebtedness and debt composition. The chart 8 is shown the values for the index third-party capital participation
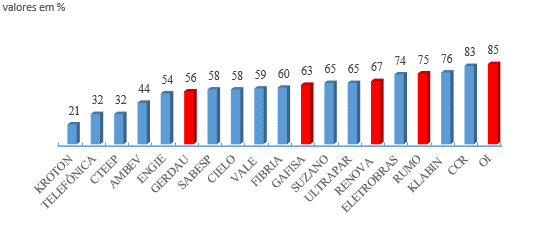
Chart 8 – participation of third party Capital
This index is of extreme importance in the analysis, because it shows how much resources the company captured by third parties in terms of risk, the lower the value, the better. And the higher the value, the greater the indication of future problems related to the freedom and financial independence will happen.
The company HI, reached a value of 85% participation index third-party capital, demonstrating a high financial dependence. Already the largest private company in Kroton branch of education, reached the value of 21%, the lowest value found in our sample, demonstrating a small dependence on third-party capital.
Once the participation of third-party capital becomes too high in relation to equity the company becomes vulnerable in the market, causing loss of credibility vis-à-vis third parties and reduced ability to pay. For obtaining loans and financing there will be great resistance together financial institutions. The degree of indebtedness search show the proportion of debt that the company has, however, this analysis should be done with caution, since there are two possibilities for the high level of indebtedness: high rate due to loans made to complete equity and/or perform/finance improvements in company. This type of indebtedness is healthy for the company, therefore, will provide growth, or high rate due to debts to pay other debts that are winning. As there is no generation of resources to pay off their debts the companies end up resorting to loans to pay off his debts and so on (TÉLES, 2003). 9 chart represents the values found
Graph 9-indebtedness
The company HI presented indebtedness of 560%, this index shows the policy of obtaining funds from the company and assesses the proportion of financing of their assets, are being financed with own resources or funds of third parties and in which proportion (TÉLES, 2003).
After analysis of the indebtedness of companies, it is necessary to check what the composition of this debt, this analysis is feasible, because the debt composition index. He represents the composition of the total indebtedness of the company. Téles (2003) defines as being one of the most significant analysis, therefore, determines whether the commitments are short-term or long-term. The sample showed the following results:
Source: Drawn by the author (2017), according to the companies.
Chart 10 – debt Composition
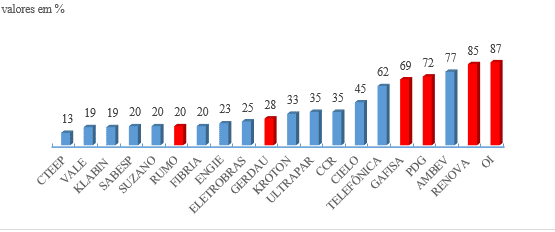
The ideal for this index is that there was a greater concentration of resources on non-current liabilities (long-term liabilities), which would provide a longer time to generate funds and pay off the debt, without the need to raise funds with third parties. Téles (2003, p. 6) it is appropriate: "If debt composition present a significant concentration in current liabilities (short-term), the company may have difficulty in a moment of reversal of market (which would not have happened if the debts were concentrated in the long term). "
In table 9 shows the balances of current liabilities (short-term debt) and non-current liabilities (long-term debt) of the five companies that presented the highest values in the composition of the debt. From this analysis it is possible to check if the concentration of the debts of each company:
| GAFISA | PDG | RENOVA | Hi | |
| Current Liabilities | 2,275,550 | 5,807,432 | 3,346,901 | 60,749,243 |
| Noncurrent Liabilities | 1,004,086 | 2,258,084 | 598,637 | 8,966,349 |
| Debt composition | 69% | 72% | 85% | 87% |
Source: the author (2017).
Table 9-Relationship of current liabilities and long-term liabilities
It is appropriate to analyse the disproportion between the accounts, being possible to understand the composition of the indebtedness of these companies, since all had the highest rates of indebtedness and are on the list of major losses in the period. In the next paragraphs will operate the viability indices, divided into: gross margin, net margin, ROI, ROE and active turnover. Gross margin is the index which shows how one company achieved sales return, after exclusion of the costs, that is, the really left after removal of the costs (TIBURCIO, 2012). The higher the value, the higher the profitability of sales, however, may vary depending on the type of business, trade and retail segment, for example, a margin above 40% is high, also depends on the way it is calculated the costs in the company. The net margin for your time, represents what is left to shareholders in relation to revenue from sales and services, shows which the net profit for each unit of sale held (TIBURCIO, 2012). The analysis of the net margin must be done in conjunction with the gross margin, net margin analysis is considered to be the shareholder side. Tiburcio (2012) sets though: "companies that are more profitable to have higher net margin. However the result must be analysed within a larger context, compared with competitors and with external factors. "
Graph 11-gross margin and net
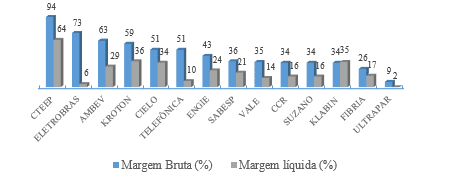
The most outstanding companies in the index of gross margin (94%) were CTEEP, Eletrobrás (73%), Ambev (63%) and Kroton (59%), that means that for every R $1.00 sold, each company will be 0.94, 0.73, and 0.63 0.59 of gross margin in the period, compared to net margin most profitable companies are: CTEEP (64%), Kroton (36%) and Klabin (35%). For Silva (2014) there is an ideal index for net margin, many factors must be taken into consideration, such as, the company sector and region, for example, and many factors that influence the profitability on sales. In the preparation of the chart 11, Gerdau companies, heading, Hi, Gafisa, renews and PDG, were withdrawn from the chart in question, for presenting negative net margin, will be presented in table 10:
Table 10-gross margin and net margin bigger losses.
| Hi | COURSE | GERDAU | RENOVA | GAFISA | PDG | |
| Gross Margin (%) | 35 | 13 | 9 | 6 | -12 | -294 |
| Net Margin (%) | -8 | -24 | -27 | -127 | -228 | -2,197 |
Source: the author (2017).
OI presented the highest gross margin between companies with larger losses, but, compared with the company that had the highest percentage (94%), CTEEP, the value is well below. The PDG had the value of-294%, due to injury in 2016, R$-5,430,942. In net margin all companies showed negative values, due to the negative balance on account of net income.
The next indicator that will be shown, is the ROI or rate of return on Total assets (ROA-Return on Total Assets), it has the function in the analysis of measuring the efficiency of the company in generating profits from your total investment. In the ROE or return of Equity (ROE – Return on Equily), demonstrates the return that shareholders of the company are getting what was invested (SILVA, 2014). The sample obtained the following results evidenced in graph 11:
Graph 11-ROI and ROE
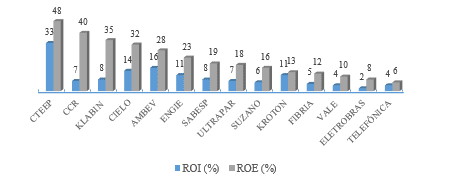
The company CTEEP presented the best values for ROI and ROE, 33% return on the assets invested (ROI), that is, for each R $100.00 invested the company presents a return of 33%. In the ROE reached the value of 48%, that is, for each R $100.00 invested the CTEEP won R $48.00, value that represents the return on invested capital. Companies with losses will be presented in table 11, these were with ROI and ROE negative, that is, for each R $100.00 invested in the case of ROI PDG present prejudice to R$-117.00. With respect to the ROE of the PDG was null because of negative equity.
Table 11 – ROI and ROE greater losses.
| COURSE | GERDAU | Hi | RENOVA | GAFISA | PDG | |
| ROI (%) | -5 | -5 | -9 | -19 | -22 | -117 |
| ROE (%) | -56 | -12 | -57 | -56 | -60 | Null |
Source: the author (2017).
Finally, will be demonstrated the active swivel values, establishing the relationship between sales and investment and indicates in decimal numbers how many times the asset was renovated in relation to sales (BRUNI, 2010). Francisco (2015) the active swivel is the relationship of the sales period and the total investments of the company, demonstrated the productivity of investment, the higher the value, the better. You can highlight the following values of this index:
Graph 12-Active swivel
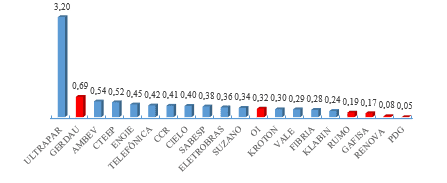
For River[2016]s () the active swivel can also be called as productivity index, due to evidence when the company sells to each real invested. The company that stands out in this index is for presenting the Ultrapar 3.20 value, that is, to House an actual invested the company achieved a revenue of R $3.20. Course, Gafisa, renews and PDG contained the lowest.
5 CONCLUSION
This study examined the financial statements of companies who trade stocks in the stock market, and that in 2016 presented significant net results, both in profit and loss. The proposed objectives were achieved, since, raised the information concerning the economic and financial situation of firms, focus of this study, its analysis with the focus on their financial statements. This demonstrates how important it is to the analysis of financial statements and how they can make a difference within an enterprise, to measure gains and losses. It was verified the list of indexes with the enterprise results, profit and loss, if actually the companies with the largest net profits obtained the best results through indicators, for in this way confirm the good performance of the company. In graph 13 will be analyzed the average values of the PMRE, PMRV and PMPC of six companies most profitable that showed the best results in the medium term indicators in comparison with companies that showed the biggest losses:
Chart 13-Average activity Indicators
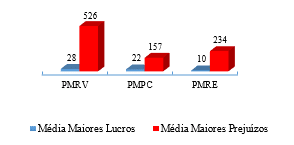
Note-If these indicators a discrepancy between the values. Most profitable companies feature smaller average to receive, make payment of purchases and renew their stocks. While the companies with the highest losses medium are elevated their deadlines, being necessary in this case to resort to third-party capital or other sources of funding to maintain their activities until the sales receipt.
In this sense, the operating cycle (PMRE + PMRV), 760 days on average for companies with higher losses and 38 days on average for companies with higher profits, this shows that companies with higher profits have the cleanest operating cycle between date of purchase of goods until the date of receipt of the sales, which is a determining factor for the satisfactory results of the companies, because there is a greater rotation of stocks and resource input in a short period of time. The financial cycle (CO-PMPC) the higher the value, the greater the time of financing, that is, the greater the cost to keep that companies with largest losses submitted 603 days average, while companies with higher profits showed average 16 days. Clearly it is possible to check the company with higher profits have a better average activity indicators when comparing with the biggest losses.
In graph 14 we can conclude that the average of the indicators of the most profitable companies are highest when comparing with companies with major losses.
Source: Drawn by the author (2017), according to the companies.
Chart 14-Middle Liquidity indicators
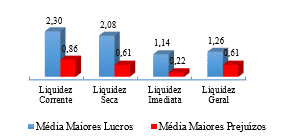
The liquidity index assesses the ability to pay of the companies, being possible to conclude that the higher profits have the best results on average. However, you must consider the average results of liquidity in conjunction with the results of the indicators of capital structure. These show the capital structure of enterprises as shareholders ' funds are distributed and third parties and the level and composition of the companies ' debt. The chart 15 presents the results of the third capital participation, composition of the indebtedness and indebtedness:
Chart 15-Average indicators of Capital structure
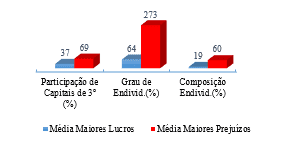
This indicator within the analysis has enough representativeness on the economic and financial situation of the companies, once, that shows the participation of third-party capital, the indebtedness of the company and the composition of the debt, which highlights the composition of the debt, whether they are short or long term. Again it is possible to check the company with higher profits with the best results, demonstrating a financial balance. However, the companies with the biggest losses shows that the degree of indebtedness is a determining factor for the unsatisfactory financial situation in the year 2016. For your time, the results of the indicators of profitability, make it possible to complete the return of each company. We can affirm with respect to the results found that companies with the highest profits generally are those that have had the best results.
Table 12 – Relationship of the top three levels of Profitability
| Gross Margin (%) | Net margin (%) | ROI (%) | ROE (%) | |
| Average Higher Profits | 51 | 37 | 16 | 37 |
| Largest Average Losses | -41 | -435 | -30 | -41 |
Source: the author (2017).
It is confirmed that the companies with the best results showed the best average indexes, translating so satisfactory economic situation of each, and the results found in the profitability indicators also are proving to be relevant to determine the performance of each company investigated, Yes, good yields converge to good profits. For companies already with prejudice the logic is the same, but in reverse way. In table 13 presents the frequency with which companies with largest losses were among the six worst values for each indicator (activity, liquidity, capital structure and profitability), respecting the peculiarities of each index.
Table 13 – Often Major Damage
| COMPANY | Activity | Liquidity | Capital structure | Profitability |
| COURSE | 0 | 3 | 2 | 5 |
| RENOVA | 0 | 4 | 2 | 5 |
| GAFISA | 2 | 1 | 1 | 5 |
| GERDAU | 2 | – | – | 4 |
| PDG | 2 | 4 | – | 4 |
| Hi | 1 | 3 | 3 | 3 |
Source: the author (2017).
It is plausible to assert that the companies with the biggest losses are agreed between the times that were among the six worst values of each indicator. Gafisa companies, Gerdau and PDG appear twice each, in the activity index with unsatisfactory results, probably indicating the need to adjust variables such as renovation policies of the stocks, credit, payment of purchases, among other. Liquidity indexes most companies with losses were among the lowest, it reflects the degree of liquidity that each company presents.
Indicators of Capital structure and Profitability also reflect the negative results of each company, are indicators that represent the degree of debt composition and in this case, Course, renews and HI presented the highest values between the companies, showing a high degree of indebtedness and high participation of third party capital. In reference to the profitability of companies, heading, renews and Gafisa took the worst values for this indicator, i.e. all indexes of profitability.
This study made the economic and financial analysis through the application of indices, the aim was to prove the results obtained if they reflect the result of each company, being instrumental to their results. The goal was to find the determining factors for the profits or losses of the companies through the analysis of the financial statements. Soon, you can identify that the high degree of indebtedness, the high concentration of third short-term capital and insufficient liquidity, are determining factors for companies that had the greatest losses. On the other hand, it is possible to note the excellent liquidity of companies, low degree of indebtedness and low participation of third party capital in companies with the highest profits. Likewise, these represent determining factors for the results obtained. Soon, stay as a suggestion to future research, conduct a monitoring of the companies in the sample, in order to verify that the companies are still adopting the same strategies to stay on top and if companies with losses changed business strategy over the next few years, with the intention to reverse the results of the year 2016.
REFERENCES
Spider, José A. Moura; Financial Cycles and operational indicators: an approach with a focus on liquidity and profitability of enterprises. Campo Grande-2001. Available in: <https: neonconcursos.com.br/wp-content/uploads/2012/02/banco-ciclo.pdf="">.</https:> Accessed on: 10 Oct. 2017.
B3 S.a; Profile and history. [2017]. Available in: <http: ri.bmfbovespa.com.br/static/ptb/perfil-historico.asp?idioma="ptb">.</http:> 29 access open. 2017.
BM & FBOVESPA; Actions. [2017]. Available in: <http: www.bmfbovespa.com.br/pt_br/produtos/listados-a-vista-e-derivativos/renda-variavel/acoes.htm="">.</http:> Accessed on: 10 May. 2017.
BM & FBOVESPA; Who We Are. [2017]. Available in: <http: www.bmfbovespa.com.br/pt_br/institucional/sobre-a-bm-fbovespa/quem-somos/="">.</http:> Accessed on: 10 May. 2017.
BM & FBOVESPA; Companies Listed. [2017]. Available in: <http: www.bmfbovespa.com.br/pt_br/produtos/listados-a-vista-e-derivativos/renda-variavel/empresas-listadas.htm="">.</http:> Access in: 05 mai. 2017.
Brazil. Law nº 11,638, 28 December 2007. Amending and repealing provisions of law nº 6,404, of December 15, 1976 and of law nº 6,385, of 7 December 1976, and extends large companies provisions for the preparation and disclosure of financial statements. Available in: <http: www.planalto.gov.br/ccivil_03/_ato2007-2010/2007/lei/l11638.htm="">.</http:> Access in: 05 jun. 2017.
Brazil. Law No. 6,404 of December 15, 1976. It determines the joint-stock companies. Available in: <http: www.planalto.gov.br/ccivil_03/leis/l6404consol.htm="">.</http:> Access in: 20 mai. 2017.
BRUNI, Adriano. Accounting and financial analysis. Series unveiled the finances. São Paulo: Atlas, 2010.
SECURITIES AND EXCHANGE COMMISSION. CVM resolution 488 of October 03, 2005. Financial statements-presentation and disclosures. Available in: <http: www.cvm.gov.br/export/sites/cvm/legislacao/deliberacoes/anexos/0400/deli488.pdf="">.</http:> Access in: 20 mai. 2017
FEDERAL ACCOUNTING COUNCIL. NBC 26 TG (R4). Presentation of the financial statements. Available at: http://www1.cfc.org.br/sisweb/SRE/docs/NBCTG26 (R3) .pdf. Access in: 04 Apr. 2017.
ECONOMATICA; BOVESPA hits record trading in 2017-PNA Valley is the most traded-segment of Banks has the highest concentration. 2016. Available in: <https: economatica.com/estudos/data/20170321a.pdf="">.</https:> Access in: 06 May. 2017.
ECONOMATICA; Profit of publicly traded companies have growth of 9.4% in 2016 with respect to 2015 – Banks are still the most lucrative, however, have fall of 13.28% in 2016.2017. Available in: <https: economatica.com/estudos/data/20170330a.pdf="">.</https:> Access in: 06 jun. 2017.
FRANCISCO, Catia Delfino; Analysis of financial statements: A Comparative case study between the companies Renner and Hering. University of Southern Santa Catarina – Criciúma-2015.
Available in: <http: repositorio.unesc.net/bitstream/1/3558/1/catia%20delfino%20francisco.pdf="">.</http:> Access in: 26 mar. 2017.
FRITZ, Jessica. Economic and financial analysis: information generated from the size of the companies. Regional University in the northeast of the State of Rio Grande do Sul-Ijuí-2015. Available in: <http: bibliodigital.unijui.edu.br:8080/xmlui/bitstream/handle/123456789/2998/jessica%20fritz%20final.pdf?sequence="1">.</http:> Access in: 24 mar. 2017.
GERHARDT, Tatiana Engel; SILVEIRA, Denise Tolfo. Research methods. 1st Edition. Porto Alegre: UFRGS, 2009.
Available in: <http: www.ufrgs.br/cursopgdr/downloadsserie/derad005.pdf="">.</http:> Accessed on 05 jul. 2017.
GARCIA, Levi; Economic-financial performance of ceramic coating of the segment South of Santa Catarina: a multicasos study. University of Southern Santa Catarina-Criciúma-2015.
Available in: <http: repositorio.unesc.net/bitstream/1/3643/1/jucimar%20gomes.pdf="">.</http:> Access in: 15 Aug. 2017.
Greek, Alvísio; AREND, Lauro. Accounting: theory and practice Basic-4th ed. São Paulo: Saraiva, 2013.
IBMEC. Step by step to be S.A. [2016]. Available in: <http: ibmec.org.br/empresario/financiamento-de-empresas/passo-a-passo-para-ser-s-a/="">.</http:> Access in: 06 jun. 2017.
IUDÍCIBUS, Sérgio. Analysis of balance sheets. São Paulo: Atlas, 1998.
Klabin. The company. [2017]. Available at: https://www.klabin.com.br/pt/a-klabin/a-empresa/. Access in: 13 set. 2017.
LINS, Luiz dos Santos; SON, José Francisco. Fundamentals and analysis of financial statements: An Interactive approach. São Paulo: Atlas, 2012.
LOUZADA, Luiz Cláudio, et al. Comparative analysis between the economic-financial indicators applied to manufacturing industries listed on the Bovespa. Universidade do Estado de Santa Catarina-Florianopolis-2016. Available in: <http: www.revistas.udesc.br/index.php/reavi/article/download/…/5566="">.</http:> Access in: 15 jul. 2017.
MARION, José Carlos. Analysis of financial statements-7th ed. São Paulo: Atlas, 2010.
MATARAZZO, Dante Carmine. Financial analysis of Swing-7th ed. São Paulo: Atlas, 2010.
Nunes, Douglas Zanette; Analysis of financial performance indicators of companies listed on the BM & FBOVESPA meat and derivatives segment based on its financial statements. University of Southern Santa Catarina – Criciúma-2015. Available in: <http: repositorio.unesc.net/bitstream/1/3562/1/douglas%20zanette%20nunes.pdf="">.</http:> Access in: 20 Aug. 2017.
PRODANOV, Cleber Cristiano; FREITAS, Ernani Chaput. Methodology of scientific work: methods and techniques of research and scholarly work. 2nd Edition. Feevale, Novo Hamburgo: 2013. Available in: <www.feevale.br ../e-book%20metodologia%20do%20trabalho%20cientifico.pdf="">.</www.feevale.br> Accessed on 05 jul. 2017.
QUINTÃO, Chiara. Building sector shrink 8 percent this year and 5% drop in 2016. Economic value, São Paulo, 8 10. Available at: http://www.valor.com.br/empresas/4346912/setor-de-construcao-encolhe-8-neste-ano-e-preve-queda-de-5-em-2016. Access in: 09 set. 2017.
REIS, Arnaldo Carlos de Rezende. Financial statements: structure and analysis-3rd ed. São Paulo: Saraiva, 2009.
RIVERS, Cláudio; Structuring and analysis of financial statements. [2016]. Material made available in class.
RODNISKI, Cleber Marcos; TODESCATO, Gisele; FELTRIN, Patricia Bernardi: analysis of economic and financial performance indicators of drug companies listed on the BM & Fbovespa. University of the West of Santa Catarina Chapecó-2016. Available in: <https: editora.unoesc.edu.br/index.php/acsa/article/view/11924/pdf="">.</https:> Access in: 15 Aug. 2017.
SAPORITO, Antonio. Analysis and structure of the financial statements. Curitiba: InterSaberes, 2015.
SILVA, Alexandre Alcântara. Structure, analysis and interpretation of financial statements-4th ed. São Paulo: Atlas, 2014.
SILVA, Michele silver; Couto, Carlos Henrique da Mota; CARDOSO, Antônio Augusto Brion: analysis of financial statements as financial management support tool. Centro de Ensino Superior de São Gotardo-Minas Gerais-2016. Available in: <https: periodicos.cesg.edu.br/index.php/gestaoeengenharia/article/download/244/341="">.</https:> Access in: 15 jul. 2017.
TÉLES, Anthony Carvalho: analysis of accounting statements debt indexes. Universidade Federal do Pará-Bethlehem-2003. Available in < http://www.peritocontador.com.br/artigos/colaboradores/artigo_-__ndices_de_endividamento.pdf=""> </>. Access in: 05 set. 2017.
TIBURCIO, César; Valuation of companies. 2012. Available in: <http: avaliacaodeempresas.blogspot.com.br/2012/03/margem-bruta.html="">.</http:> Access in: 15 set. 2017.
ZANLUCA, Jonatan de Souza; Economic cycles, operational and financial. [2017]. Available in: <http: www.portaldecontabilidade.com.br/tematicas/ciclos.htm="">.</http:> Access in: 01 Sep. 2017.
Telephone companies, Cielo, CCR and Renews do not appear in Chart 1, for not submitting your stock account balance.
Has been removed from the analysis the company PDG, for presenting negative balance on the account of shareholders ' equity. Has been removed from the analysis the company PDG, for presenting negative balance on the account of shareholders ' equity.
[1] Bachelor's degree in accounting
[2] Master in development economics-PUC-RS